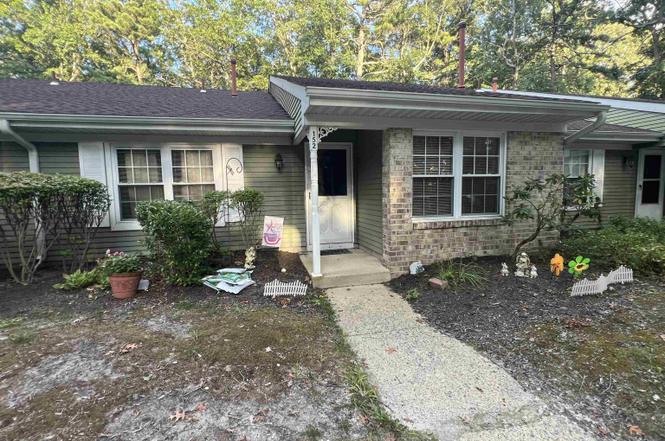
152 Club Pl #152 · Smithville, NJ
Flood risk 1/10 · Minimal
- FEMA flood zone
- X
- Chance of flooding over 30 yrs
- 0.0%
- Est. flood insurance / yr
- $507 – $1,088
Fire risk 3/10 · Minor
- Est. fire insurance / yr
- $526 – $976
Heat risk 8/10 · Major
- Hot days now (above 99°F)
- 7 days/yr
- Hot days in 30 yrs
- 15 days/yr
Wind risk 8/10 · Major
- Chance of severe wind over 30 yrs
- 80.0%
Air-quality risk 3/10 · Minor
- Unhealthy air days now
- 2 days/yr
- Unhealthy air days in 30 yrs
- 3 days/yr
Risk factors via First Street. Map © Google.
Why this score? — see what drove the B- grade
The composite is a weighted blend of 9 inputs, each scored 0–100. Each bar is that input's sub-score; the figure is the points it added to the 100-point composite (weight × sub-score).
- Cash flow +30.0/30.0
- 1% rule +10.0/10.0
- DSCR +10.0/10.0
- ARV discount +7.5/15.0
- Livability +3.2/5.0
- Schools +2.9/10.0
- Rent growth +2.5/5.0
- Condition / age +2.5/5.0
- Appreciation +0.0/10.0
$119,000
🖨 Deal sheet 📄 Offer letter ✓ Due diligence
Listing remarks
Must take tenant with this property for at least one year at $1,300/mo. rent – This has become a Beat the Bank Sale and will be handled by a Short Sale Attorney. Listing Price is not guaranteed and is based on bank short sale approval. Would need a full rehab once tenant moves out. One of the Villa models that was completely rehabbed last summer SOLD for $267,000. Actively looking for senior assisted HUD living that is income based. This 2 bedroom 2 full bath ranch style, sought out "Villa" model offers an excellent opportunity for investors or buyers looking to build equity. The home features single floor living, a spacious living area, eat in kitchen, primary bedroom with
Key facts
- Bonus room
- Backyard
- Single-floor living
Tags
Property features AI
Finance
- Other: Condo unit on entry level (single-level unit)
- HOA & community: Monthly association fee of $235; Association-managed community; HOA includes management, maintenance, pool, and trash; Adult community (55+)
Exterior
- Parking: One assigned exterior parking space; No garage
- Utilities: Public water; Public sewer; Gas water heater
- Home design: Single-story unit; Condo: Club 1 / The Club at Galloway; For sale
- Construction: Vinyl exterior
- Exterior features: Vinyl siding; Pets allowed with restrictions; Not waterfront
Interior
- Kitchen: Dishwasher; Gas stove; Refrigerator
- Bathrooms: 2 full bathrooms
- Heating & cooling: Central air conditioning; Natural gas heating
- Interior features: Dryer; Dishwasher; Gas stove; Refrigerator; Washer; 7 rooms
- Laundry & utility: Washer; Dryer
Neighborhood map
What this means for you Summary
Snapshot
- This is a 2-bed/2.0-bath condo listed at $119k.
Deal economics
- At list price, monthly cash flow is $593 ($7k/yr) — positive.
- The deal already cash-flows at list — no discount required.
- Meets the 1% rule at list price ($2k rent vs $119k).
- Recommended offer: $105k (12.0% below list) — sets the bar for market timing.
- Cap rate 12.3% vs local median 3.9% in Smithville — top-decile yield for the area; either an underpriced asset or a hidden risk that comps aren't pricing in. Stress-test before assuming the spread holds.
Location & tenants
- Location reads 64/100 on livability (#402 in NJ) — a middle-class / working-renter tenant base. Strengths: housing B; Watch: cost of living C-, amenities F, commute F.
- Greater Egg Harbor Regional High School District (suburban): math 16% / reading 49% proficiency, ranked #319 of 472 in NJ (top 68%) — families likely to look elsewhere, expect single-tenant / working-renter base with shorter leases.
- Market conditions: 240 active listings in the ZIP; 2 comparable units currently listed for rent nearby; solid renter incomes; 672 units permitted in Atlantic County in 2024 (258 in 5+ unit buildings).
Forward outlook
- Local home prices are declining (-3.0%/yr); year-one equity from $823 of loan paydown is wiped out by about $4k of value loss. Plan a longer hold.
- Atlantic County population projected at -12% by 2050 — secular population decline; favor cash flow + early exit over multi-decade hold.
- At projected returns (-3.0% appreciation + 3.0% rent growth), your $33k cash investment doubles in ~6 years — after that, you're playing with house money.
Negotiation context
- It's been on market 275 days — a 12% lower offer ($105k) is reasonable based on typical stale-listing flexibility.
Risks & watch-outs
- Climate carrying-cost: severe wind risk, 80% chance of damaging wind over 30y; extreme-heat days projected 7→15/yr by 2055 (HVAC capex compounding) — expect insurance premiums to compound above CPI over the hold.
Questions for the listing agent
- It's been on market 275 days. Have you received any prior offers? Is the seller open to a 12% concession, seller financing, or rate buy-down credit?
- What does the HOA fee cover, when was the last increase, and are there any pending special assessments or reserve-fund shortfalls?
- Any open or pending special assessments — roof, HVAC, plumbing, elevator, façade? What's the per-unit balance and payoff schedule, and is the seller paying it off at close or rolling it to the buyer?
- Why hasn't it sold? Are there any deal-killer items the seller is aware of (foundation, flood, title, zoning, code violations)?
- Is there a deadline driving the sale (1031 exchange, divorce, estate, relocation)? That informs how much negotiation room exists.
- What's the average days-on-market for RENTAL listings here right now (not sales)? A rising rental-DOM trend means longer vacancies and softer asking-rent achievability than the comps imply.
- What's the recent tenant-quality profile in this submarket — average credit score on applications, eviction rate, late-payment / NSF rate, and stable-employment percentage? A property-management company in the area should have these aggregated.
- How much new apartment / multifamily construction is in the pipeline within 1–3 miles? Heavy new supply (>2% of stock underway) typically softens rents 12–24 months out; light construction supports rent growth.
Investment metrics
- 1% rule
- 1.76% ✓
- Cap rate
- 12.28%
- Cash-on-cash
- 21.37%
- DSCR
- 1.95
- GRM
- 4.7
CMA / ARV
No comps found within radius.
Projected returns pro-forma
-3.0% appreciation · 3.0% rent growth · sell at horizon
- IRR
- 14.0%
- Equity multiple
- 1.56×
- Total profit
- $18,690
- Equity at exit
- $17,743
- IRR
- 22.9%
- Equity multiple
- 2.97×
- Total profit
- $65,659
- Equity at exit
- $10,289
Cash invested: $33,320 (down + closing). Projections, not guarantees.
Landlord ↔ Tenant lean methodology
- Overall (STATE)
- 21 Tenant-Leaning
- State New Jersey
- 21 Tenant-Leaning · D+6
- County
- — inherits STATE
- City
- — inherits STATE
ZIP-level market 08205
- Home prices YoY
- -12.3%
- Active inventory
- 240
- Price-to-rent
- 4.7×
Monthly cashflow live
- Estimated rent
- $2,090 medium interval (Pro) →
- Mortgage (P&I)
- −$624
- Tax est. 1.5%
- −$149 /mo · $1,785/yr
- Insurance
- −$50
- HOA
- −$235
- Vacancy / Maint / Mgmt
- −$439
- Net cashflow
- $593
Break-even live
UW: 25.0% down · 7.5% · 30yr · 1.5% tax · 5.0% vac · 8.0% maint · 8.0% mgmt
Financing live
Cash to close
- Down payment
- $29,750
- Closing costs
- $3,570
- Reserves months
- —
- Total cash needed
- —
Loan-product check · same deal, 3 products live
Conventional
25% down · 7.5% · 30yr
- Down + closing
- —
- Monthly P&I
- —
- Monthly cashflow
- —
- DSCR
- —
- Eligible?
- —
Personal DTI + credit; lowest rate.
DSCR
20% down · 8.5% · 30yr
- Down + closing
- —
- Monthly P&I
- —
- Monthly cashflow
- —
- DSCR
- —
- Eligible?
- —
No personal income docs; deal must DSCR.
Hard money
10% down · 12.0% · 12mo
- Down + closing
- —
- Monthly P&I
- —
- Monthly cashflow
- —
- DSCR
- —
- Eligible?
- —
Short-term bridge; refi at stabilization.
Rent comps 2 comps
| Address | Beds | Baths | Sqft | Rent | $/sqft | DOM | Units | Dist |
|---|---|---|---|---|---|---|---|---|
| 180 Walden Way Galloway, NJ | 1.0–3.0 | 1.0–2.5 | 1037 | $2,319 | $2.24 | 1d | 1 | 0.65mi |
| 64 Mattix Run Galloway, NJ | 2.0 | 1.0 | 1007 | $1,800 | $1.79 | 21d | 1 | 1.14mi |
HOA detail condo
- Monthly dues
- $235 · $2,820/yr
- Assessments
- None detected in remarks — confirm with the listing agent.
Listing history 14 events
-
2026-06-10days on market $119,000 Under Contract 275 DOM
-
2026-06-09days on market $119,000 Under Contract 274 DOM
-
2026-06-08days on market $119,000 Under Contract 273 DOM
-
2026-06-07days on market $119,000 Under Contract 272 DOM
-
2026-06-03days on market $119,000 Under Contract 268 DOM
-
2026-06-02days on market $119,000 Under Contract 267 DOM
-
2026-06-01days on market $119,000 Under Contract 266 DOM
-
2026-05-31days on market $119,000 Under Contract 265 DOM
-
2026-05-30days on market $119,000 Under Contract 264 DOM
-
2026-04-07historical Under Contract
-
2026-04-03price $119,000
-
2026-01-19price $195,000
-
2025-10-06price $214,000
-
2025-09-08$219,000 Active
ⓘ Source: listings_history table (triggers on properties + properties_extension) + one-shot
backfill from property_details.listing_events for pre-trigger history.
Climate risk First Street
- Flood 1/10 Low FEMA zone X · 0% chance over 30 yrs
- Wildfire 3/10 Moderate
- Heat 8/10 Severe 7 d/yr ≥99°F today · 15 d/yr by 30 yrs out
- Wind 8/10 Severe 80% chance of damaging wind over 30 yrs
- Air quality 3/10 Moderate 2 unhealthy d/yr today · 3 by 30 yrs out
Nearby sold comps map
Loading sold comps map…
Walkable amenities ~0.75 mi
Loading nearby amenities…
Taxation est. · year 1
- Rental income
- $25,076
- − Mortgage interest
- −$6,666
- − Property taxes
- −$1,785
- − Insurance
- −$595
- − Repairs & maintenance
- −$2,006
- − Management
- −$2,006
- − HOA
- −$2,820
- − Depreciation
- −$3,462
- Taxable income
- $5,736
- Est. tax owed @ 24.0%
- −$1,377
- After-tax cash flow
- $5,745/yr
For passive investors: Depreciation is non-cash, so a rental often shows a tax loss while cash-flowing — sheltering income. Rental losses are passive: they offset passive income freely, and up to $25,000/yr can offset ordinary (W-2) income if you actively participate and your MAGI is under $100k (phasing out to $0 by $150k); unused losses carry forward. On sale, claimed depreciation is recaptured at up to 25%, and gains may owe capital-gains tax (a 1031 exchange can defer both). Figures are a year-1 estimate at your 24.0% rate — not tax advice; consult a CPA.
Schools (NCES district)
- District
- Greater Egg Harbor Regional High School District
- NCES district ID
- 3406060
- Math proficiency
- 16% ▼ -13.00%
- Reading proficiency
- 49% ▲ 2.00%
- Median HH income
- $58,324
- Composite
- 28.94/100
- National rank
- #6629
- State rank
- #319 of 472 in NJ
Livability — Smithville
- Score
- 64/100
- State rank
- #402
- US rank
- #13992
Category grades
Schools grade is shown separately in the Schools card above.
Census & demographics
- County
- Atlantic County · 143,611 people
- Metro
- Atlantic City-Hammonton, NJ
- Population (ZIP)
- 28,877
- Household income
- $93,370
- Rent vs Own
- Severe rent burden
- 732.0
Population outlook (Atlantic County) Hauer SSP2
- Today (2025)
- 268,948 people
- By 2030
- 264,497 · -1.7%
- By 2040
- 252,261 · -6.2%
- By 2050
- 237,846 · -11.6%
- By 2075
- 210,650 · -21.7%
- By 2100
- 180,234 · -33.0%
Race, ethnicity, and origin ACS 2023
- Neighborhood character
- Diverse neighborhood (Simpson 0.58)
- Race & ethnicity
- White 62% Hispanic / Latino 14% Two or more races 12% Asian 9% Black 7%
- Hispanic origin (detail)
- Mexican 2% Puerto Rican 6%
- Common ancestry
- Romanian 7% Scotch-Irish 1% Lithuanian 1%
- Foreign-born
- 17% · Canada, Vietnam, China
- Languages at home
- 75% English-only · Spanish 11% Other Indo-European 7% Russian/Polish/Slavic 3%
Political lean MEDSL · Atlantic
- 2024 margin
- Toss-up / Even · D 47.7% · R 50.7% · Other 1.6%
- 2008→2024 swing
- -18.1pp toward R · 2008: 15.1pp · 2024: -3.0pp
- All cycles
- 2024: R+3.0 2020: D+6.7 2016: D+6.2 2012: D+17.2 2008: D+15.1
Not yet ingested
- Civics
- —
Market trends
- HPI YoY
- ▼ -44.12%
- Current HPI
- 315.4814
- Rent YoY
- —
- Metro
- Atlantic City-Hammonton, NJ
- State GDP YoY
- ▲ 2.05%
- F500 in state
- 34
Industry mix (Fortune 500 HQ in NJ)
| Industry | F500 HQs | Revenue |
|---|---|---|
| Consumer Goods | 3 | $31B |
|
||
| Pharmaceuticals | 2 | $153B |
|
||
| Technology | 2 | $21B |
|
||
| Insurance | 2 | $20B |
|
||
| Healthcare | 2 | $19B |
|
||
| Financial Services | 1 | $70B |
|
||
Price history
-45.7% since first listed5 events — show timeline
- 2026-04-07 Contingent — SJSRMLS
- 2026-04-03 Price Changed $119,000 SJSRMLS
- 2026-01-19 Price Changed $195,000 SJSRMLS
- 2025-10-06 Price Changed $214,000 SJSRMLS
- 2025-09-08 Listed $219,000 SJSRMLS
Cash-flow waterfall
monthlySold comps — $/sqft
last 12 mo · ≤1 miLoading sold comps…