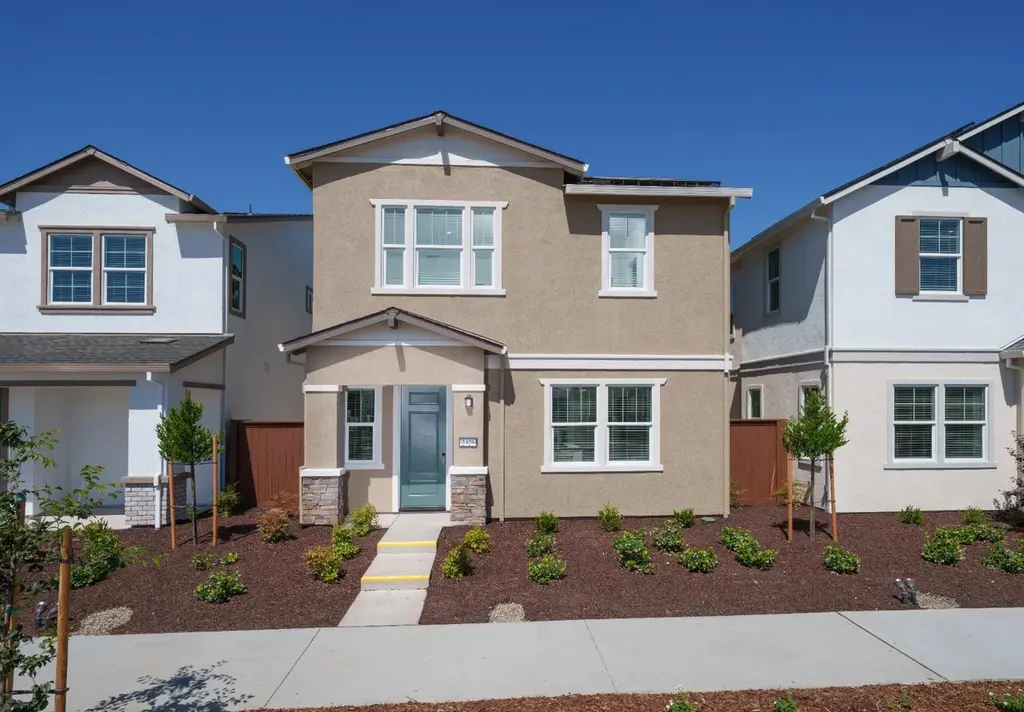
2332 Kaufman Ct · Woodland, CA
Flood risk No data
- FEMA flood zone
- —
- Chance of flooding over 30 yrs
- —
- Est. flood insurance / yr
- —
Fire risk No data
- Est. fire insurance / yr
- —
Heat risk No data
- Hot days now (above threshold)
- —
- Hot days in 30 yrs
- —
Wind risk No data
- Chance of severe wind over 30 yrs
- —
Air-quality risk No data
- Unhealthy air days now
- —
- Unhealthy air days in 30 yrs
- —
Risk factors via First Street. Map © Google.
Why this score? — see what drove the D grade
The composite is a weighted blend of 9 inputs, each scored 0–100. Each bar is that input's sub-score; the figure is the points it added to the 100-point composite (weight × sub-score).
- ARV discount +15.0/15.0
- Cash flow +8.7/30.0
- Schools +4.0/10.0
- Rent growth +3.9/5.0
- Livability +3.4/5.0
- Condition / age +2.5/5.0
- DSCR +2.4/10.0
- 1% rule +1.4/10.0
- Appreciation +0.0/10.0
$520,740
🖨 Deal sheet 📄 Offer letter ✓ Due diligence
Listing remarks MLS
This new two-story home is host to an inviting open-concept floorplan on the first level, combining the kitchen, living and dining areas for simple transitions and everyday multitasking. All three bedrooms are located on the second floor, including the lavish owner's suite at the front of the home, complete with a full bathroom and walk-in closet.
Key facts
- Full bathroom
- Walk-in closet
- Owner's suite
Tags
Neighborhood map
What this means for you Summary
Snapshot
- This is a 3-bed/2.5-bath single-family listed at $521k.
Deal economics
- At list price, monthly cash flow is $-439 ($-5k/yr) — negative.
- To cash-flow at today's rent, offer at most $443k (14.9% below list).
- To meet the 1% rule (rent ≥ 1% of price), the offer needs to be $332k (36.3% below list).
- Recommended offer: $332k (36.3% below list) — sets the bar for 1% rule.
- Cap rate 5.3% vs local median 3.4% in Woodland — top-decile yield for the area; either an underpriced asset or a hidden risk that comps aren't pricing in. Stress-test before assuming the spread holds.
Location & tenants
- Location reads 67/100 on livability (#314 in CA) — a middle-class / working-renter tenant base. Strengths: employment A, housing A; Watch: amenities C-, schools F, cost of living F.
- Woodland Joint Unified (suburban): math 34% / reading 58% proficiency, ranked #171 of 517 in CA (top 33%) — families likely to look elsewhere, expect single-tenant / working-renter base with shorter leases.
- Market conditions: Rents rising fast (+5.4%/yr); 96 active listings in the ZIP; 3 comparable units currently listed for rent nearby; rentals at typical pace (median 15d on market — plan ~3-4 weeks tenant-placement turnaround); solid renter incomes; 721 units permitted in Yolo County in 2024 (260 in 5+ unit buildings).
- This rent runs 37% of the median local income ($107k/yr) — at the standard rent-burdened threshold; future hikes will face affordability resistance.
Forward outlook
- Local home prices are declining (-3.0%/yr); year-one equity from $4k of loan paydown is wiped out by about $16k of value loss. Plan a longer hold.
- Yolo County population projected at +31% by 2050 — long-run rental-demand tailwind backs the buy-and-hold thesis.
Negotiation context
- It's been on market 58 days — a 3% lower offer ($505k) is reasonable based on typical stale-listing flexibility.
Questions for the listing agent
- What do current leases actually rent for vs. the listed asking? Can we see a recent rent roll and the last 12 months of T-12 income?
- It's been on market 58 days. Have you received any prior offers? Is the seller open to a 36% concession, seller financing, or rate buy-down credit?
- Is there a deadline driving the sale (1031 exchange, divorce, estate, relocation)? That informs how much negotiation room exists.
- Schools are F-rated, which usually means shorter tenancies and higher turnover. Who's the typical renter profile here, and what's been the actual vacancy rate?
- The area grade is low — what's the realistic commute time and amenity access for the typical tenant pool here? Any planned neighborhood developments (good or bad) we should know about?
- What's the average days-on-market for RENTAL listings here right now (not sales)? A rising rental-DOM trend means longer vacancies and softer asking-rent achievability than the comps imply.
- What's the recent tenant-quality profile in this submarket — average credit score on applications, eviction rate, late-payment / NSF rate, and stable-employment percentage? A property-management company in the area should have these aggregated.
- How much new for-sale + rental construction is in the pipeline within 1–3 miles? Heavy new supply typically softens prices + rents 12–24 months out; constrained supply supports both.
Investment metrics
- 1% rule
- 0.64% ✗
- Cap rate
- 5.28%
- Cash-on-cash
- -3.62%
- DSCR
- 0.84
- GRM
- 13.1
CMA / ARV
- ARV (median comp)
- $715,447
- List price
- $520,740
- Delta
- -27.21%
- Verdict
- UNDERPRICED
- Comps
- 20 within 1.0 mi
Show comp detail 12 sales within ~0.75 mi
| Address | Dist | Beds/Ba | Sqft | Sold | Price | $/sf | Match |
|---|---|---|---|---|---|---|---|
| 2336 Dahler Ct | 0.05mi | 3/2.5 | 1,943 (+14%) | 2mo | $530,000 | $273 | 73 |
| 2316 Dahler Ln | 0.05mi | 3/2.5 | 1,943 (+14%) | 3mo | $512,000 | $264 | 73 |
| 2554 Chamberlain Ct | 0.06mi | 3/2.0 | 1,945 (+14%) | 6mo | $640,000 | $329 | 67 |
| 1832 Dunlap Pl | 0.59mi | 3/2.0 | 1,688 (-1%) | 4mo | $605,000 | $358 | 65 |
| 2041 Marston Dr | 0.50mi | 3/2.5 | 1,668 (-2%) | 11mo | $614,724 | $369 | 64 |
| 1916 Campos Ave | 0.56mi | 3/2.0 | 1,651 (-3%) | 6mo | $605,000 | $366 | 61 |
| 1911 Neal Way | 0.56mi | 3/2.5 | 1,556 (-9%) | 10mo | $542,000 | $348 | 51 |
| 2104 Edgington Cir | 0.46mi | 3/2.0 | 1,945 (+14%) | 8mo | $650,000 | $334 | 47 |
| 1924 Miekle Ave | 0.47mi | 3/2.0 | 1,904 (+11%) | 14mo | $608,000 | $319 | 46 |
| 2100 Soza Pl | 0.75mi | 4/3.0 (+1) | 1,856 (+9%) | 1mo | $645,000 | $348 | 43 |
| 2001 Gumbinger Pl | 0.56mi | 3/2.0 | 1,945 (+14%) | 11mo | $660,000 | $339 | 40 |
| 2037 Marston Dr | 0.50mi | 4/3.0 (+1) | 1,924 (+13%) | 12mo | $649,607 | $338 | 39 |
Match score weights: distance 35% · size 25% · config 20% · recency 20%. Top-matched comps best support the ARV.
Projected returns pro-forma
-3.0% appreciation · 5.4% rent growth · sell at horizon
- IRR
- -20.2%
- Equity multiple
- 0.28×
- Total profit
- $-104,448
- Equity at exit
- $77,644
- IRR
- -9.5%
- Equity multiple
- 0.36×
- Total profit
- $-92,765
- Equity at exit
- $45,024
Cash invested: $145,807 (down + closing). Projections, not guarantees.
Landlord ↔ Tenant lean methodology
- Overall (STATE)
- 18 Strongly Tenant-Friendly
- State California
- 18 Strongly Tenant-Friendly · D+13
- County
- — inherits STATE
- City
- — inherits STATE
ZIP-level market 95776
- Home prices YoY
- -30.2%
- Rents YoY
- 5.4%
- Active inventory
- 96
- Price-to-rent
- 13.1×
Monthly cashflow live
- Estimated rent
- $3,318 medium interval (Pro) →
- Mortgage (P&I)
- −$2,731
- Tax from tax record
- −$113 /mo · $1,359/yr
- Insurance
- −$217
- HOA
- −$0
- Vacancy / Maint / Mgmt
- −$697
- Net cashflow
- $-439
Break-even live
UW: 25.0% down · 7.5% · 30yr · 1.5% tax · 5.0% vac · 8.0% maint · 8.0% mgmt
Financing live
Cash to close
- Down payment
- $130,185
- Closing costs
- $15,622
- Reserves months
- —
- Total cash needed
- —
Loan-product check · same deal, 3 products live
Conventional
25% down · 7.5% · 30yr
- Down + closing
- —
- Monthly P&I
- —
- Monthly cashflow
- —
- DSCR
- —
- Eligible?
- —
Personal DTI + credit; lowest rate.
DSCR
20% down · 8.5% · 30yr
- Down + closing
- —
- Monthly P&I
- —
- Monthly cashflow
- —
- DSCR
- —
- Eligible?
- —
No personal income docs; deal must DSCR.
Hard money
10% down · 12.0% · 12mo
- Down + closing
- —
- Monthly P&I
- —
- Monthly cashflow
- —
- DSCR
- —
- Eligible?
- —
Short-term bridge; refi at stabilization.
Rent comps 3 comps
| Address | Beds | Baths | Sqft | Rent | $/sqft | DOM | Units | Dist |
|---|---|---|---|---|---|---|---|---|
| 2123 Sieber Dr Woodland, CA | 4.0 | 2.5 | 1760 | $2,900 | $1.65 | 14d | 1 | 0.53mi |
| 2123 Sieber Dr Woodland, CA | 4.0 | 3.0 | 1760 | $3,000 | $1.70 | 17d | 1 | 0.53mi |
| 2509 Allen Cir Woodland, CA | 3.0 | 2.5 | 2043 | $3,850 | $1.88 | 4d | 1 | 0.93mi |
Listing history 16 events
-
2026-06-18days on market $520,740 Active 58 DOM
-
2026-06-17days on market $520,740 Active 57 DOM
-
2026-06-16days on market $520,740 Active 56 DOM
-
2026-06-15days on market $520,740 Active 55 DOM
-
2026-06-13days on market $520,740 Active 53 DOM
-
2026-06-09days on market $520,740 Active 49 DOM
-
2026-06-08days on market $520,740 Active 48 DOM
-
2026-06-07days on market $520,740 Active 47 DOM
-
2026-06-05days on market $520,740 Active 44 DOM
-
2026-06-03days on market $520,740 Active 43 DOM
-
2026-06-02days on market $520,740 Active 42 DOM
-
2026-06-01days on market $520,740 Active 41 DOM
-
2026-05-31days on market $520,740 Active 40 DOM
-
2026-04-03price $520,740 349-char remark
Show marketing remark (349 chars)
This new two-story home is host to an inviting open-concept floorplan on the first level, combining the kitchen, living and dining areas for simple transitions and everyday multitasking. All three bedrooms are located on the second floor, including the lavish owner's suite at the front of the home, complete with a full bathroom and walk-in closet.
-
2026-02-17price $540,740 349-char remark
Show marketing remark (349 chars)
This new two-story home is host to an inviting open-concept floorplan on the first level, combining the kitchen, living and dining areas for simple transitions and everyday multitasking. All three bedrooms are located on the second floor, including the lavish owner's suite at the front of the home, complete with a full bathroom and walk-in closet.
-
2025-12-23$560,740 Active 349-char remark
Show marketing remark (349 chars)
This new two-story home is host to an inviting open-concept floorplan on the first level, combining the kitchen, living and dining areas for simple transitions and everyday multitasking. All three bedrooms are located on the second floor, including the lavish owner's suite at the front of the home, complete with a full bathroom and walk-in closet.
ⓘ Source: listings_history table (triggers on properties + properties_extension) + one-shot
backfill from property_details.listing_events for pre-trigger history.
Tax reassessment forecast CA · Resets to sale price
- Current annual tax
- $1,359 · $113/mo
- Projected year-2 tax
- $3,958 · $330/mo
- Expected delta
- +$2,599/yr (+$217/mo · 191.2%)
ⓘ Screening estimate from a state-policy table — verify with the county assessor before closing.
Nearby sold comps map
Loading sold comps map…
Walkable amenities ~0.75 mi
Loading nearby amenities…
Taxation est. · year 1
- Rental income
- $39,821
- − Mortgage interest
- −$29,170
- − Property taxes
- −$1,359
- − Insurance
- −$2,604
- − Repairs & maintenance
- −$3,186
- − Management
- −$3,186
- − Depreciation
- −$15,149
- Taxable loss
- −$14,831
- Est. tax savings @ 24.0%
- +$3,559
- After-tax cash flow
- $-1,714/yr
For passive investors: Depreciation is non-cash, so a rental often shows a tax loss while cash-flowing — sheltering income. Rental losses are passive: they offset passive income freely, and up to $25,000/yr can offset ordinary (W-2) income if you actively participate and your MAGI is under $100k (phasing out to $0 by $150k); unused losses carry forward. On sale, claimed depreciation is recaptured at up to 25%, and gains may owe capital-gains tax (a 1031 exchange can defer both). Figures are a year-1 estimate at your 24.0% rate — not tax advice; consult a CPA.
Schools (NCES district)
- District
- Woodland Joint Unified
- NCES district ID
- 0643080
- Math proficiency
- 34% ▲ 6.00%
- Reading proficiency
- 58% ▲ 15.00%
- Median HH income
- $57,556
- Composite
- 40.1/100
- National rank
- #3803
- State rank
- #171 of 517 in CA
Livability — Woodland
- Score
- 67/100
- State rank
- #314
- US rank
- #10682
Category grades
Schools grade is shown separately in the Schools card above.
Census & demographics
- Census place
- Woodland, CA
- County
- Yolo County · 212,115 people
- City population
- 66,420
- Metro
- Sacramento-Roseville-Folsom, CA
- Population (ZIP)
- 28,718
- Household income
- $106,698
- Rent vs Own
- Severe rent burden
- 654.0
Population outlook (Yolo County) Hauer SSP2
- Today (2025)
- 242,183 people
- By 2030
- 257,662 · +6.4%
- By 2040
- 288,050 · +18.9%
- By 2050
- 318,202 · +31.4%
- By 2075
- 392,736 · +62.2%
- By 2100
- 438,150 · +80.9%
Race, ethnicity, and origin ACS 2023
- Neighborhood character
- Diverse neighborhood (Simpson 0.67)
- Race & ethnicity
- Hispanic / Latino 46% White 32% Two or more races 20% Asian 13% Black 2%
- Hispanic origin (detail)
- Mexican 43%
- Common ancestry
- Italian 3% Scotch-Irish 2% Lithuanian 1%
- Foreign-born
- 25% · Canada, China, South Korea
- Languages at home
- 57% English-only · Spanish 31% Other Indo-European 7% Chinese 2%
Political lean MEDSL · Yolo
- 2024 margin
- Solid D (+36.2) · D 66.3% · R 30.1% · Other 3.6%
- 2008→2024 swing
- 0.0pp no change · 2008: 36.2pp · 2024: 36.2pp
- All cycles
- 2024: D+36.2 2020: D+41.4 2016: D+42.0 2012: D+33.2 2008: D+36.2
Not yet ingested
- Civics
- —
Market trends
- HPI YoY
- ▼ -119.41%
- Current HPI
- 276.202
- Rent YoY
- ▲ 5.40%
- Metro
- Sacramento-Roseville-Folsom, CA
- State GDP YoY
- ▲ 3.21%
- F500 in state
- 116
Industry mix (Fortune 500 HQ in CA)
| Industry | F500 HQs | Revenue |
|---|---|---|
| Technology | 27 | $1,492B |
|
||
| Financial Services | 3 | $174B |
|
||
| Retail | 3 | $44B |
|
||
| Insurance | 3 | $26B |
|
||
| Media / Entertainment | 2 | $115B |
|
||
| Pharmaceuticals / Biotech | 2 | $62B |
|
||
Price history
-7.1% since first listed3 events — show timeline
- 2026-04-03 Price Changed $520,740 Zillow
- 2026-02-17 Price Changed $540,740 Zillow
- 2025-12-23 Listed $560,740 Zillow
Cash-flow waterfall
monthlySold comps — $/sqft
last 12 mo · ≤1 miLoading sold comps…