1825 Saint Julian Pl Unit 5E · Columbia, SC
Flood risk 1/10 · Minimal
- FEMA flood zone
- X (unshaded)
- Chance of flooding over 30 yrs
- 0.0%
- Est. flood insurance / yr
- $473 – $860
Fire risk 1/10 · Minimal
- Est. fire insurance / yr
- $783 – $1,453
Heat risk 6/10 · Moderate
- Hot days now (above 109°F)
- 7 days/yr
- Hot days in 30 yrs
- 16 days/yr
Wind risk 6/10 · Moderate
- Chance of severe wind over 30 yrs
- 68.0%
Air-quality risk 3/10 · Minor
- Unhealthy air days now
- 2 days/yr
- Unhealthy air days in 30 yrs
- 2 days/yr
Risk factors via First Street. Map © Google.
Why this score? — see what drove the D grade
The composite is a weighted blend of 9 inputs, each scored 0–100. Each bar is that input's sub-score; the figure is the points it added to the 100-point composite (weight × sub-score).
- 1% rule +9.4/10.0
- Cash flow +9.3/30.0
- ARV discount +7.5/15.0
- Livability +3.9/5.0
- Rent growth +3.7/5.0
- DSCR +2.6/10.0
- Schools +2.6/10.0
- Condition / age +2.5/5.0
- Appreciation +0.0/10.0
$119,000
🖨 Deal sheet 📄 Offer letter ✓ Due diligence
Listing remarks
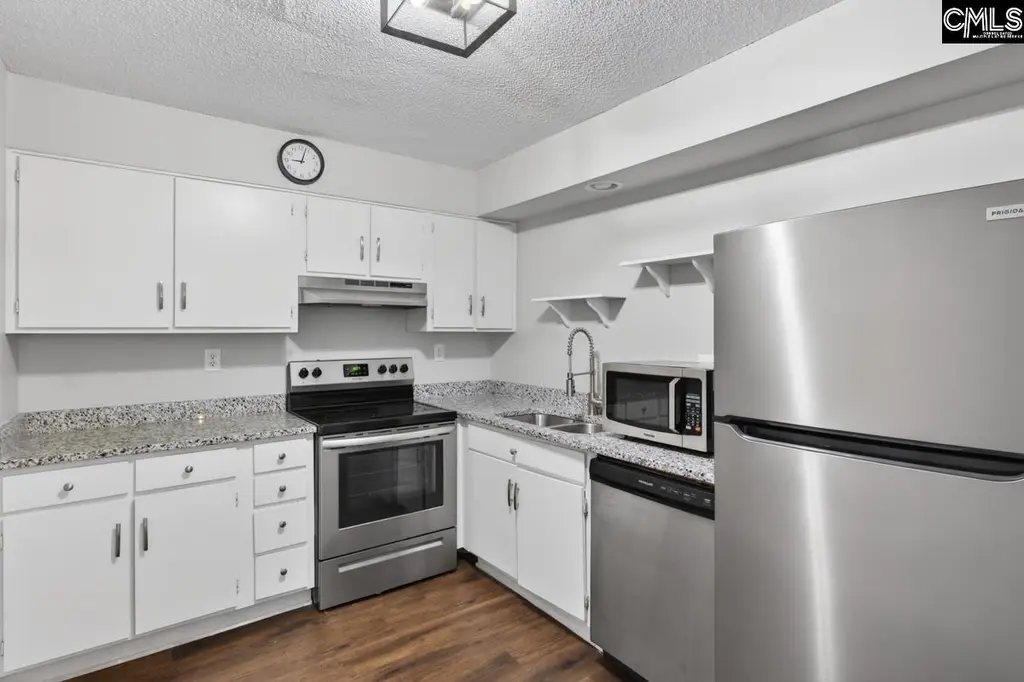
1825 St. Julian Place, unit 5E is an updated high-rise condo in the heart of Forest Acres. This two-bedroom, two-bathroom residence is perfect for a first time homebuyer or investor building a portfolio. Unit 5E offers a serene retreat from the bustling city while providing easy access to top restaurants, shops, and schools. Enjoy the morning breeze or the afternoon sunset on your spacious balcony. Located just minutes from downtown, Fort Jackson, and major highways, the building features 24-hour security and resort-style amenities, including a pool, laundry facility, and comfortable common areas. Experience the best of city living with all the convenience and none of the maintenance respon
Key facts
- Spacious balcony
- 24-hour security
- Pool
Tags
Property features AI
Finance
- Other: Paved road access
- HOA & community: Community association present
Exterior
- Parking: 10 parking spaces
- Utilities: Public water; Public sewer
- Home design: Condominium unit
- Construction: Slab foundation
- Exterior features: Synthetic stucco exterior; Private pool
Interior
- Bedrooms: Master bedroom on the main level; Second bedroom on the main level
- Bathrooms: Two full bathrooms
- Heating & cooling: Central heating; Central air conditioning
- Interior features: Family room on the main level; Kitchen on the main level
Neighborhood map
What this means for you Summary
Snapshot
- This is a 2-bed/2.0-bath condo listed at $119k.
Deal economics
- At list price, monthly cash flow is $-86 ($-1k/yr) — negative.
- To cash-flow at today's rent, offer at most $104k (12.8% below list).
- Meets the 1% rule at list price ($2k rent vs $119k).
- Recommended offer: $104k (12.8% below list) — sets the bar for cash-flow.
Location & tenants
- Location reads 78/100 on livability (#18 in SC, #2,436 nationally) — a middle-class / working-renter tenant base. Strengths: amenities A+, commute A+, cost of living A+; Watch: employment D, crime F.
- Richland 01 (urban): math 26% / reading 36% proficiency, ranked #54 of 80 in SC (top 68%) — families likely to look elsewhere, expect single-tenant / working-renter base with shorter leases; 64% free/reduced lunch — lower-income household profile, screen leases tightly.
- Zoned schools: Bradley Elementary (math 22% / reading 32%, grade F, #421 of 597 statewide, top 73%, 437 students, 100% FRL); A. C. Flora High (math 42% / reading 92%, grade B, #73 of 196 statewide, top 41%, 1,352 students, 100% FRL) — zoned schools average 100% FRL vs 64% district-wide (36 pts higher); higher-poverty schools than district average — tighter screening recommended.
- Zoned-school proficiency averages 47% at this address vs 31% district-wide (+16 pts) — the actual schools serving this property are materially stronger than the Richland 01 average implies; a family-tenant draw the district grade alone would hide.
- Market conditions: Rents rising fast (+4.7%/yr); 116 active listings in the ZIP; 20 comparable units currently listed for rent nearby; rentals at typical pace (median 24d on market — plan ~3-4 weeks tenant-placement turnaround); 3,472 units permitted in Richland County in 2024 (1,096 in 5+ unit buildings).
- This rent runs 41% of the median local income ($50k/yr) — at the standard rent-burdened threshold; future hikes will face affordability resistance.
Forward outlook
- Local home prices are declining (-3.0%/yr); year-one equity from $823 of loan paydown is wiped out by about $4k of value loss. Plan a longer hold.
- Richland County population projected at +30% by 2050 — long-run rental-demand tailwind backs the buy-and-hold thesis.
Negotiation context
- It's been on market 36 days — a 3% lower offer ($115k) is reasonable based on typical stale-listing flexibility.
- 2 sale attempts with the ask held roughly flat each time — persistent listings suggest the price (not the market) is what's stuck; bring a comps-based counter.
Risks & watch-outs
- Watch-outs: HOA is 30% of rent.
- Climate carrying-cost: major wind risk, 68% chance of damaging wind over 30y; extreme-heat days projected 7→16/yr by 2055 (HVAC capex compounding) — expect insurance premiums to compound above CPI over the hold.
Questions for the listing agent
- What do current leases actually rent for vs. the listed asking? Can we see a recent rent roll and the last 12 months of T-12 income?
- It's been on market 36 days. Have you received any prior offers? Is the seller open to a 13% concession, seller financing, or rate buy-down credit?
- Built in 1974 — when were the roof, HVAC, electrical panel, plumbing, and water heater last replaced?
- What does the HOA fee cover, when was the last increase, and are there any pending special assessments or reserve-fund shortfalls?
- Any open or pending special assessments — roof, HVAC, plumbing, elevator, façade? What's the per-unit balance and payoff schedule, and is the seller paying it off at close or rolling it to the buyer?
- Is there a deadline driving the sale (1031 exchange, divorce, estate, relocation)? That informs how much negotiation room exists.
- Schools are D-rated, which usually means shorter tenancies and higher turnover. Who's the typical renter profile here, and what's been the actual vacancy rate?
- Crime grade is F in this area — have there been break-ins, vandalism, or insurance claims at this property in the last 3 years? What carrier currently insures it and at what premium?
- The area grade is low — what's the realistic commute time and amenity access for the typical tenant pool here? Any planned neighborhood developments (good or bad) we should know about?
- What's the average days-on-market for RENTAL listings here right now (not sales)? A rising rental-DOM trend means longer vacancies and softer asking-rent achievability than the comps imply.
- What's the recent tenant-quality profile in this submarket — average credit score on applications, eviction rate, late-payment / NSF rate, and stable-employment percentage? A property-management company in the area should have these aggregated.
- How much new apartment / multifamily construction is in the pipeline within 1–3 miles? Heavy new supply (>2% of stock underway) typically softens rents 12–24 months out; light construction supports rent growth.
Investment metrics
- 1% rule
- 1.44% ✓
- Cap rate
- 5.42%
- Cash-on-cash
- -3.11%
- DSCR
- 0.86
- GRM
- 5.8
CMA / ARV
No comps found within radius.
Projected returns pro-forma
-3.0% appreciation · 4.73% rent growth · sell at horizon
- IRR
- -17.6%
- Equity multiple
- 0.36×
- Total profit
- $-21,337
- Equity at exit
- $17,743
- IRR
- -4.4%
- Equity multiple
- 0.67×
- Total profit
- $-11,085
- Equity at exit
- $10,289
Cash invested: $33,320 (down + closing). Projections, not guarantees.
Landlord ↔ Tenant lean methodology
- Overall (STATE)
- 90 Strongly Landlord-Friendly
- State South Carolina
- 90 Strongly Landlord-Friendly · R+6
- County
- — inherits STATE
- City
- — inherits STATE
ZIP-level market 29204
- Home prices YoY
- -34.9%
- Rents YoY
- 4.7%
- Active inventory
- 116
- Price-to-rent
- 5.8×
Monthly cashflow live
- Estimated rent
- $1,717 high interval (Pro) →
- Mortgage (P&I)
- −$624
- Tax from tax record
- −$246 /mo · $2,956/yr
- Insurance
- −$50
- HOA
- −$523
- Vacancy / Maint / Mgmt
- −$361
- Net cashflow
- $-86
Break-even live
UW: 25.0% down · 7.5% · 30yr · 1.5% tax · 5.0% vac · 8.0% maint · 8.0% mgmt
Financing live
Cash to close
- Down payment
- $29,750
- Closing costs
- $3,570
- Reserves months
- —
- Total cash needed
- —
Loan-product check · same deal, 3 products live
Conventional
25% down · 7.5% · 30yr
- Down + closing
- —
- Monthly P&I
- —
- Monthly cashflow
- —
- DSCR
- —
- Eligible?
- —
Personal DTI + credit; lowest rate.
DSCR
20% down · 8.5% · 30yr
- Down + closing
- —
- Monthly P&I
- —
- Monthly cashflow
- —
- DSCR
- —
- Eligible?
- —
No personal income docs; deal must DSCR.
Hard money
10% down · 12.0% · 12mo
- Down + closing
- —
- Monthly P&I
- —
- Monthly cashflow
- —
- DSCR
- —
- Eligible?
- —
Short-term bridge; refi at stabilization.
Rent comps 20 comps
| Address | Beds | Baths | Sqft | Rent | $/sqft | DOM | Units | Dist |
|---|---|---|---|---|---|---|---|---|
| 2834 Keats St Columbia, SC | 3.0 | 2.0 | 921 | $2,250 | $2.44 | 14d | 1 | 0.26mi |
| 3040 Girardeau Ave Columbia, SC | 3.0 | 1.5 | 1400 | $2,150 | $1.54 | 14d | 1 | 0.54mi |
| 3040 Girardeau Ave Columbia, SC | 3.0 | 1.5 | 1400 | $2,150 | $1.54 | 23d | 1 | 0.54mi |
| 2511 Chestnut St Columbia, SC | 2.0 | 1.0 | 928 | $1,300 | $1.40 | 14d | 1 | 0.56mi |
| 1121 Zeigler St Unit B Columbia, SC | 3.0 | 2.5 | 1550 | $3,300 | $2.13 | 21d | 1 | 0.72mi |
| 2050 N Beltline Blvd Columbia, SC | 1.0–2.0 | 1.0–1.5 | 831 | $1,042 | $1.25 | 14d | 6 | 1.11mi |
| 2347 Stark St Columbia, SC | 2.0 | 1.0 | 876 | $1,100 | $1.26 | 23d | 1 | 1.13mi |
| 3117 Quitman St Columbia, SC | 3.0 | 2.0 | 1500 | $1,750 | $1.17 | 23d | 1 | 1.16mi |
| 3111 Kline St Columbia, SC | 2.0 | 2.0 | 950 | $1,850 | $1.95 | 23d | 1 | 1.19mi |
| 2710 Preston St Columbia, SC | 2.0 | 1.0 | 1000 | $1,495 | $1.50 | 23d | 1 | 1.26mi |
| 3419 Piedmont Ave Columbia, SC | 3.0 | 1.0 | 1100 | $1,195 | $1.09 | 23d | 1 | 1.27mi |
| 2229 Greene St Columbia, SC | 3.0 | 2.0 | 1050 | $1,695 | $1.61 | 19d | 1 | 1.29mi |
| 2928 English Ave Unit NA Columbia, SC | 3.0 | 1.0 | 1320 | $1,590 | $1.20 | 11d | 1 | 1.32mi |
| 3431 Covenant Rd Columbia, SC | 1.0–3.0 | 1.0–1.5 | 950 | $1,016 | $1.07 | 23d | 1 | 1.39mi |
| 1115 Carter St Columbia, SC | 1.0–2.0 | 1.0 | 854 | $1,405 | $1.65 | 23d | 1 | 1.39mi |
| 1018 Laurens St Columbia, SC | 3.0 | 1.0 | 1500 | $2,700 | $1.80 | 23d | 1 | 1.42mi |
| 3015 English Ave Columbia, SC | 2.0 | 1.0 | 981 | $1,250 | $1.27 | 11d | 1 | 1.44mi |
| 3145 Bronx Rd Columbia, SC | 3.0 | 1.5 | 1207 | $1,511 | $1.25 | 23d | 1 | 1.47mi |
| 151 Renaissance Way Columbia, SC | 3.0 | 2.0 | 1200 | $1,400 | $1.17 | 23d | 1 | 1.48mi |
| 1800 Cherry Laurel Dr Unit 18005 Columbia, SC | 2.0 | 1.0 | 960 | $895 | $0.93 | 23d | 1 | 1.49mi |
HOA detail condo
- Monthly dues
- $523 · $6,276/yr
- Likely covers
- poolsecurity
- Assessments
- None detected in remarks — confirm with the listing agent.
Listing history 22 events
-
2026-06-18days on market $119,000 Active 36 DOM
-
2026-06-17days on market $119,000 Active 35 DOM
-
2026-06-16days on market $119,000 Active 34 DOM
-
2026-06-15days on market $119,000 Active 33 DOM
-
2026-06-14days on market $119,000 Active 31 DOM
-
2026-06-10days on market $119,000 Active 28 DOM
-
2026-06-09days on market $119,000 Active 27 DOM
-
2026-06-08days on market $119,000 Active 26 DOM
-
2026-06-07days on market $119,000 Active 25 DOM
-
2026-06-03days on market $119,000 Active 21 DOM
-
2026-06-03days on market $119,000 Active 20 DOM
-
2026-06-01days on market $119,000 Active 19 DOM
-
2026-05-31days on market $119,000 Active 18 DOM
-
2026-05-13$119,000 Active
-
2025-11-05soldstatus $115,000
-
2025-11-01status Pending
-
2025-10-18historical Active - Contingent
-
2025-09-24price $129,900
-
2025-08-25$135,000 Active
-
2021-07-20soldstatus $92,000
-
2021-01-31soldstatus $55,000
-
1989-07-01soldstatus $47,000
ⓘ Source: listings_history table (triggers on properties + properties_extension) + one-shot
backfill from property_details.listing_events for pre-trigger history.
Tax reassessment forecast SC · Resets to sale price
- Current annual tax
- $2,956 · $246/mo
- Projected year-2 tax
- $2,956 · $246/mo
- Expected delta
- $0/yr ($0/mo · 0.0%)
ⓘ Screening estimate from a state-policy table — verify with the county assessor before closing.
Climate risk First Street
- Flood 1/10 Low FEMA zone X (unshaded) · 0% chance over 30 yrs
- Wildfire 1/10 Low
- Heat 6/10 Major 7 d/yr ≥109°F today · 16 d/yr by 30 yrs out
- Wind 6/10 Major 68% chance of damaging wind over 30 yrs
- Air quality 3/10 Moderate 2 unhealthy d/yr today · 2 by 30 yrs out
Nearby sold comps map
Loading sold comps map…
Walkable amenities ~0.75 mi
Loading nearby amenities…
Taxation est. · year 1
- Rental income
- $20,606
- − Mortgage interest
- −$6,666
- − Property taxes
- −$2,956
- − Insurance
- −$595
- − Repairs & maintenance
- −$1,649
- − Management
- −$1,649
- − HOA
- −$6,276
- − Depreciation
- −$3,462
- Taxable loss
- −$2,645
- Est. tax savings @ 24.0%
- +$635
- After-tax cash flow
- $-402/yr
For passive investors: Depreciation is non-cash, so a rental often shows a tax loss while cash-flowing — sheltering income. Rental losses are passive: they offset passive income freely, and up to $25,000/yr can offset ordinary (W-2) income if you actively participate and your MAGI is under $100k (phasing out to $0 by $150k); unused losses carry forward. On sale, claimed depreciation is recaptured at up to 25%, and gains may owe capital-gains tax (a 1031 exchange can defer both). Figures are a year-1 estimate at your 24.0% rate — not tax advice; consult a CPA.
Schools (NCES district)
- District
- Richland 01
- NCES district ID
- 4503360
- Math proficiency
- 26% ▼ -7.00%
- Reading proficiency
- 36% ▼ -5.00%
- Median HH income
- $38,931
- Composite
- 25.94/100
- National rank
- #7335
- State rank
- #54 of 80 in SC
Livability — Columbia
- Score
- 78/100
- State rank
- #18
- US rank
- #2436
Category grades
Schools grade is shown separately in the Schools card above.
Census & demographics
- Census place
- Columbia, SC
- County
- Richland County · 389,530 people
- City population
- 335,994
- Metro
- Columbia, SC
- Population (ZIP)
- 18,159
- Household income
- $50,189
- Rent vs Own
- Severe rent burden
- 1045.0
Population outlook (Richland County) Hauer SSP2
- Today (2025)
- 459,667 people
- By 2030
- 487,524 · +6.1%
- By 2040
- 542,035 · +17.9%
- By 2050
- 595,371 · +29.5%
- By 2075
- 732,998 · +59.5%
- By 2100
- 820,415 · +78.5%
Race, ethnicity, and origin ACS 2023
- Neighborhood character
- Diverse neighborhood (Simpson 0.57)
- Race & ethnicity
- Black 48% White 44% Two or more races 3% Asian 3% Hispanic / Latino 2%
- Common ancestry
- Serbian 2% Slovak 2% Italian 1%
- Foreign-born
- 3% · Canada
- Languages at home
- 93% English-only · Spanish 2% Tagalog/Filipino 1% Arabic 1%
Political lean MEDSL · Richland
- 2024 margin
- Solid D (+34.6) · D 66.4% · R 31.8% · Other 1.8%
- 2008→2024 swing
- +5.7pp toward D · 2008: 28.9pp · 2024: 34.6pp
- All cycles
- 2024: D+34.6 2020: D+38.3 2016: D+32.9 2012: D+33.3 2008: D+28.9
Not yet ingested
- Civics
- —
Market trends
- HPI YoY
- ▼ -104.76%
- Current HPI
- 195.2246
- Rent YoY
- ▲ 4.73%
- Metro
- Columbia, SC
- State GDP YoY
- ▲ 4.51%
- F500 in state
- 2
Industry mix (Fortune 500 HQ in SC)
| Industry | F500 HQs | Revenue |
|---|---|---|
| Packaging | 1 | $7B |
|
||
Price history
+153.2% since first listed9 events — show timeline
- 2026-05-13 Listed $119,000 Consolidated MLS
- 2025-11-05 Sold (Public Records) $115,000 Public Records
- 2025-11-01 Pending — Consolidated MLS
- 2025-10-18 Contingent — Consolidated MLS
- 2025-09-24 Price Changed $129,900 Consolidated MLS
- 2025-08-25 Listed $135,000 Consolidated MLS
- 2021-07-20 Sold (Public Records) $92,000 Public Records
- 2021-01-31 Sold (Public Records) $55,000 Public Records
- 1989-07-01 Sold (Public Records) $47,000 Public Records
Property tax history
+0.9%/yrLatest (2025): $2,956 · +2.1% YoY. Source: county tax records.
Cash-flow waterfall
monthlySold comps — $/sqft
last 12 mo · ≤1 miLoading sold comps…