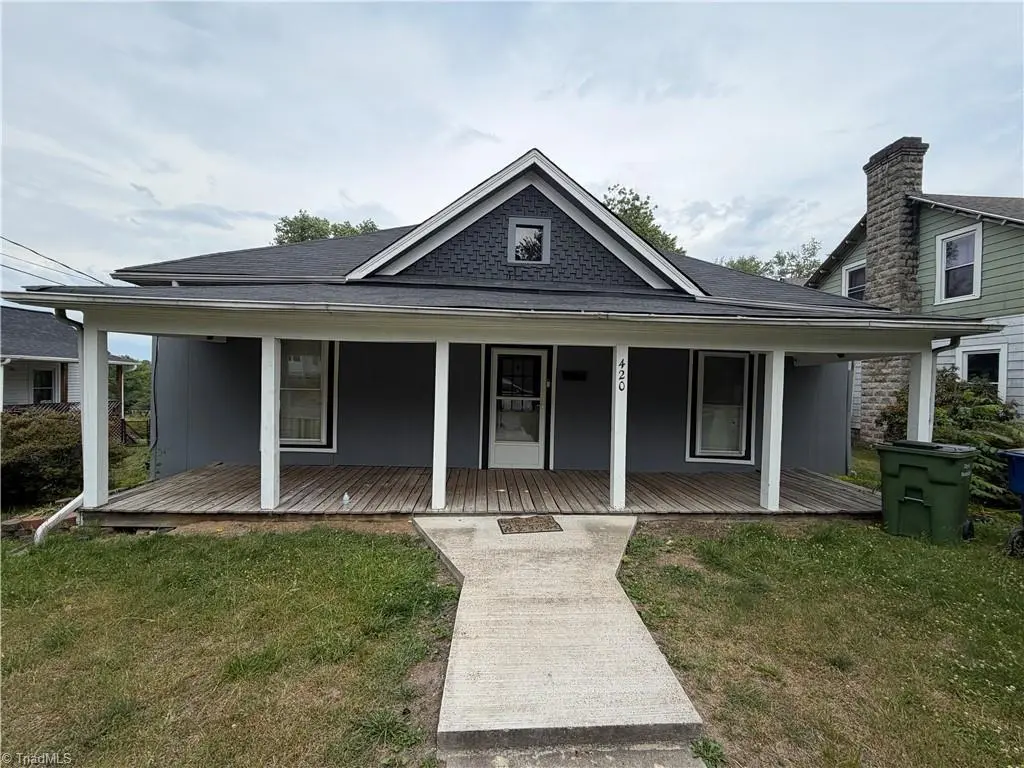
420 Junction St · Mount Airy, NC
Flood risk 1/10 · Minimal
- FEMA flood zone
- X (unshaded)
- Chance of flooding over 30 yrs
- 0.0%
- Est. flood insurance / yr
- $473 – $860
Fire risk 3/10 · Minor
- Est. fire insurance / yr
- $906 – $1,684
Heat risk 5/10 · Moderate
- Hot days now (above 100°F)
- 7 days/yr
- Hot days in 30 yrs
- 19 days/yr
Wind risk 2/10 · Minimal
- Chance of severe wind over 30 yrs
- 1.0%
Air-quality risk 1/10 · Minimal
- Unhealthy air days now
- 0 days/yr
- Unhealthy air days in 30 yrs
- 0 days/yr
Risk factors via First Street. Map © Google.
Why this score? — see what drove the B- grade
The composite is a weighted blend of 9 inputs, each scored 0–100. Each bar is that input's sub-score; the figure is the points it added to the 100-point composite (weight × sub-score).
- Cash flow +30.0/30.0
- DSCR +10.0/10.0
- 1% rule +9.0/10.0
- ARV discount +7.5/15.0
- Schools +4.1/10.0
- Livability +3.1/5.0
- Rent growth +2.5/5.0
- Condition / age +2.5/5.0
- Appreciation +0.0/10.0
$99,900
🖨 Deal sheet 📄 Offer letter ✓ Due diligence
Listing remarks
Great location walking distance to downtown Mt. Airy's restaurants, shopping, & Market St. Even closer walking distance to Riverside Park and walking & bike trails. Lots of square footage means great potential for this fixer upper to make this your permanent home, a long term rental, or an Air BnB! Ceiling height in laundry room & bathroom on rear of home are less than 7' and not counted in the advertised total sq ft. Selling "as-is". home has flooring and structural areas in need of repair. Roof leaked in rear laundry room. Many Other repairs probably also needed but sellers have not lived in the home and inherited property. Buyers please do all your own inspecti
Key facts
- Walking bike trails
- 0.33 acre lot
- Built 1924
Tags
Property features AI
Finance
- Other: Publicly maintained road access
- HOA & community: No homeowners association
Exterior
- Parking: Driveway
- Utilities: Public water; Public sewer; Electric water heater
- Home design: Residential stick/site-built house; One story; Built in 1924; Existing structure
- Construction: Masonite exterior; Crawl space foundation; No fireplaces reported
- Exterior features: City lot
Interior
- Kitchen: Kitchen on the main level
- Bedrooms: Multiple bedrooms on the main level (rooms with main-level dimensions listed)
- Bathrooms: One full bathroom
- Heating & cooling: Central air conditioning; Heat pump; Electric heating; Propane heating
- Interior features: Primary bedroom located on the main level
- Laundry & utility: Main-level laundry room
Neighborhood map
What this means for you Summary
Snapshot
- This is a 3-bed/1.0-bath single-family listed at $100k.
Deal economics
- At list price, monthly cash flow is $490 ($6k/yr) — positive.
- The deal already cash-flows at list — no discount required.
- Meets the 1% rule at list price ($1k rent vs $100k).
- Cap rate 12.2% vs local median 3.1% in Mount Airy — top-decile yield for the area; either an underpriced asset or a hidden risk that comps aren't pricing in. Stress-test before assuming the spread holds.
Location & tenants
- Location reads 62/100 on livability (#473 in NC) — a middle-class / working-renter tenant base. Strengths: cost of living A+; Watch: crime D+, schools D, amenities F.
- Mount Airy City Schools (town): math 51% / reading 49% proficiency, ranked #69 of 178 in NC (top 39%) — acceptable for families but not a draw, mixed tenant base, ~2y average lease.
- Market conditions: 213 active listings in the ZIP; 243 units permitted in Surry County in 2024 (0 in 5+ unit buildings).
- This rent runs 36% of the median local income ($46k/yr) — at the standard rent-burdened threshold; future hikes will face affordability resistance.
Forward outlook
- Local home prices are declining (-3.0%/yr); year-one equity from $691 of loan paydown is wiped out by about $3k of value loss. Plan a longer hold.
- Surry County population projected at -22% by 2050 — secular population decline; favor cash flow + early exit over multi-decade hold.
- At projected returns (-3.0% appreciation + 3.0% rent growth), your $28k cash investment doubles in ~6 years — after that, you're playing with house money.
Negotiation context
- Only 2 days on market — expect competitive offers; lowballing is unlikely to land.
- Current owner paid $53k; list at $100k implies a 88% gain — meaningful room to come down on a strong offer.
Risks & watch-outs
- Watch-outs: built in 1924 — expect roof / HVAC / electrical / plumbing capex.
- Climate carrying-cost: extreme-heat days projected 7→19/yr by 2055 (HVAC capex compounding) — expect insurance premiums to compound above CPI over the hold.
Questions for the listing agent
- Built in 1924 — when were the roof, HVAC, electrical panel, plumbing, and water heater last replaced?
- Is there a deadline driving the sale (1031 exchange, divorce, estate, relocation)? That informs how much negotiation room exists.
- Schools are D-rated, which usually means shorter tenancies and higher turnover. Who's the typical renter profile here, and what's been the actual vacancy rate?
- Crime grade is D in this area — have there been break-ins, vandalism, or insurance claims at this property in the last 3 years? What carrier currently insures it and at what premium?
- What's the average days-on-market for RENTAL listings here right now (not sales)? A rising rental-DOM trend means longer vacancies and softer asking-rent achievability than the comps imply.
- What's the recent tenant-quality profile in this submarket — average credit score on applications, eviction rate, late-payment / NSF rate, and stable-employment percentage? A property-management company in the area should have these aggregated.
- How much new for-sale + rental construction is in the pipeline within 1–3 miles? Heavy new supply typically softens prices + rents 12–24 months out; constrained supply supports both.
Investment metrics
- 1% rule
- 1.40% ✓
- Cap rate
- 12.18%
- Cash-on-cash
- 21.02%
- DSCR
- 1.94
- GRM
- 5.9
CMA / ARV
- ARV (on-the-fly)
- $293,530
- Comps found
- 10
Show comp detail 10 sales within ~0.75 mi
| Address | Dist | Beds/Ba | Sqft | Sold | Price | $/sf | Match |
|---|---|---|---|---|---|---|---|
| 549 E Pine St | 0.30mi | 3/2.0 | 1,796 (-9%) | 1mo | $318,000 | $177 | 66 |
| 108 Luther Ridge Ln | 0.64mi | 3/1.0 | 1,986 (+1%) | 6mo | $12,000 | $6 | 64 |
| 364 Woodruff St | 0.43mi | 3/2.0 | 1,881 (-4%) | 12mo | $279,900 | $149 | 58 |
| 302 Spring St | 0.56mi | 3/2.0 | 1,830 (-7%) | 2mo | $265,000 | $145 | 57 |
| 322 W Church St | 0.69mi | 3/2.0 | 1,870 (-5%) | 11mo | $272,500 | $146 | 46 |
| 424 Spring St | 0.63mi | 3/2.5 | 1,887 (-4%) | 16mo | $310,000 | $164 | 45 |
| 140 W Poplar St | 0.74mi | 3/2.5 | 1,865 (-5%) | 11mo | $175,000 | $94 | 42 |
| 229 Orchard St | 0.70mi | 4/2.5 (+1) | 1,774 (-10%) | 11mo | $442,500 | $249 | 31 |
| 245 Orchard St | 0.74mi | 3/2.0 | 1,688 (-14%) | 10mo | $224,500 | $133 | 30 |
| 931 Willow St | 0.63mi | 3/2.5 | 1,714 (-13%) | 22mo | $305,000 | $178 | 24 |
Match score weights: distance 35% · size 25% · config 20% · recency 20%. Top-matched comps best support the ARV.
Projected returns pro-forma
-3.0% appreciation · 3.0% rent growth · sell at horizon
- IRR
- 13.4%
- Equity multiple
- 1.54×
- Total profit
- $14,993
- Equity at exit
- $14,895
- IRR
- 22.3%
- Equity multiple
- 2.90×
- Total profit
- $53,138
- Equity at exit
- $8,638
Cash invested: $27,972 (down + closing). Projections, not guarantees.
Landlord ↔ Tenant lean methodology
- Overall (STATE)
- 85 Strongly Landlord-Friendly
- State North Carolina
- 85 Strongly Landlord-Friendly · R+3
- County
- — inherits STATE
- City
- — inherits STATE
ZIP-level market 27030
- Active inventory
- 213
- Price-to-rent
- 5.9×
Monthly cashflow live
- Estimated rent
- $1,400 medium interval (Pro) →
- Mortgage (P&I)
- −$524
- Tax from tax record
- −$51 /mo · $609/yr
- Insurance
- −$42
- HOA
- −$0
- Vacancy / Maint / Mgmt
- −$294
- Net cashflow
- $490
Break-even live
UW: 25.0% down · 7.5% · 30yr · 1.5% tax · 5.0% vac · 8.0% maint · 8.0% mgmt
Financing live
Cash to close
- Down payment
- $24,975
- Closing costs
- $2,997
- Reserves months
- —
- Total cash needed
- —
Loan-product check · same deal, 3 products live
Conventional
25% down · 7.5% · 30yr
- Down + closing
- —
- Monthly P&I
- —
- Monthly cashflow
- —
- DSCR
- —
- Eligible?
- —
Personal DTI + credit; lowest rate.
DSCR
20% down · 8.5% · 30yr
- Down + closing
- —
- Monthly P&I
- —
- Monthly cashflow
- —
- DSCR
- —
- Eligible?
- —
No personal income docs; deal must DSCR.
Hard money
10% down · 12.0% · 12mo
- Down + closing
- —
- Monthly P&I
- —
- Monthly cashflow
- —
- DSCR
- —
- Eligible?
- —
Short-term bridge; refi at stabilization.
Listing history 5 events
-
2026-05-24historical Due Diligence Period
-
2026-05-22$99,900 Active
-
1997-08-01soldstatus $53,000
-
1997-01-01soldstatus $15,000
-
1984-01-01soldstatus $14,500
ⓘ Source: listings_history table (triggers on properties + properties_extension) + one-shot
backfill from property_details.listing_events for pre-trigger history.
Tax reassessment forecast NC · Resets to sale price
- Current annual tax
- $609 · $51/mo
- Projected year-2 tax
- $819 · $68/mo
- Expected delta
- +$210/yr (+$18/mo · 34.5%)
ⓘ Screening estimate from a state-policy table — verify with the county assessor before closing.
Climate risk First Street
- Flood 1/10 Low FEMA zone X (unshaded) · 0% chance over 30 yrs
- Wildfire 3/10 Moderate
- Heat 5/10 Major 7 d/yr ≥100°F today · 19 d/yr by 30 yrs out
- Wind 2/10 Low 100% chance of damaging wind over 30 yrs
- Air quality 1/10 Low 0 unhealthy d/yr today · 0 by 30 yrs out
Nearby sold comps map
Loading sold comps map…
Walkable amenities ~0.75 mi
Loading nearby amenities…
Taxation est. · year 1
- Rental income
- $16,803
- − Mortgage interest
- −$5,596
- − Property taxes
- −$609
- − Insurance
- −$500
- − Repairs & maintenance
- −$1,344
- − Management
- −$1,344
- − Depreciation
- −$2,906
- Taxable income
- $4,504
- Est. tax owed @ 24.0%
- −$1,081
- After-tax cash flow
- $4,798/yr
For passive investors: Depreciation is non-cash, so a rental often shows a tax loss while cash-flowing — sheltering income. Rental losses are passive: they offset passive income freely, and up to $25,000/yr can offset ordinary (W-2) income if you actively participate and your MAGI is under $100k (phasing out to $0 by $150k); unused losses carry forward. On sale, claimed depreciation is recaptured at up to 25%, and gains may owe capital-gains tax (a 1031 exchange can defer both). Figures are a year-1 estimate at your 24.0% rate — not tax advice; consult a CPA.
Schools (NCES district)
- District
- Mount Airy City Schools
- NCES district ID
- 3703210
- Math proficiency
- 51% ▲ 8.00%
- Reading proficiency
- 49% ▲ 2.00%
- Median HH income
- $33,113
- Composite
- 41.19/100
- National rank
- #3546
- State rank
- #69 of 178 in NC
Livability — Mount Airy
- Score
- 62/100
- State rank
- #473
- US rank
- #17188
Category grades
Schools grade is shown separately in the Schools card above.
Census & demographics
- Census place
- Mount Airy, NC
- County
- Surry County · 36,241 people
- City population
- 36,241
- Metro
- Mount Airy, NC
- Population (ZIP)
- 36,241
- Household income
- $46,377
- Rent vs Own
- Severe rent burden
- 939.0
Population outlook (Surry County) Hauer SSP2
- Today (2025)
- 69,473 people
- By 2030
- 66,964 · -3.6%
- By 2040
- 60,967 · -12.2%
- By 2050
- 54,102 · -22.1%
- By 2075
- 38,806 · -44.1%
- By 2100
- 24,711 · -64.4%
Race, ethnicity, and origin ACS 2023
- Neighborhood character
- Predominantly White (83%)
- Race & ethnicity
- White 83% Hispanic / Latino 9% Two or more races 5% Black 5%
- Hispanic origin (detail)
- Mexican 7%
- Common ancestry
- Serbian 2% Slovak 2% Italian 1%
- Foreign-born
- 4% · Canada
- Languages at home
- 92% English-only · Spanish 6% Other Asian/Pacific 1%
Political lean MEDSL · Surry
- 2024 margin
- Solid R (+53.3) · D 23.0% · R 76.3%
- 2008→2024 swing
- -25.4pp toward R · 2008: -28.0pp · 2024: -53.3pp
- All cycles
- 2024: R+53.3 2020: R+51.4 2016: R+50.7 2012: R+36.9 2008: R+28.0
Not yet ingested
- Civics
- —
Market trends
- HPI YoY
- ▼ -132.64%
- Current HPI
- 177.1549
- Rent YoY
- —
- Metro
- Mount Airy, NC
- State GDP YoY
- ▲ 3.28%
- F500 in state
- 26
Industry mix (Fortune 500 HQ in NC)
| Industry | F500 HQs | Revenue |
|---|---|---|
| Financial Services | 2 | $213B |
|
||
| Retail | 2 | $95B |
|
||
| Industrial Conglomerate | 1 | $38B |
|
||
| Metals / Steel | 1 | $35B |
|
||
| Utilities | 1 | $30B |
|
||
| Industrial Machinery | 1 | $19B |
|
||
Price history
+589.0% since first listed5 events — show timeline
- 2026-05-24 Contingent — Triad MLS
- 2026-05-22 Listed $99,900 Triad MLS
- 1997-08-01 Sold (Public Records) $53,000 Public Records
- 1997-01-01 Sold (Public Records) $15,000 Public Records
- 1984-01-01 Sold (Public Records) $14,500 Public Records
Property tax history
+1.1%/yrLatest (2025): $609 · +19.1% YoY. Source: county tax records.
Cash-flow waterfall
monthlySold comps — $/sqft
last 12 mo · ≤1 miLoading sold comps…