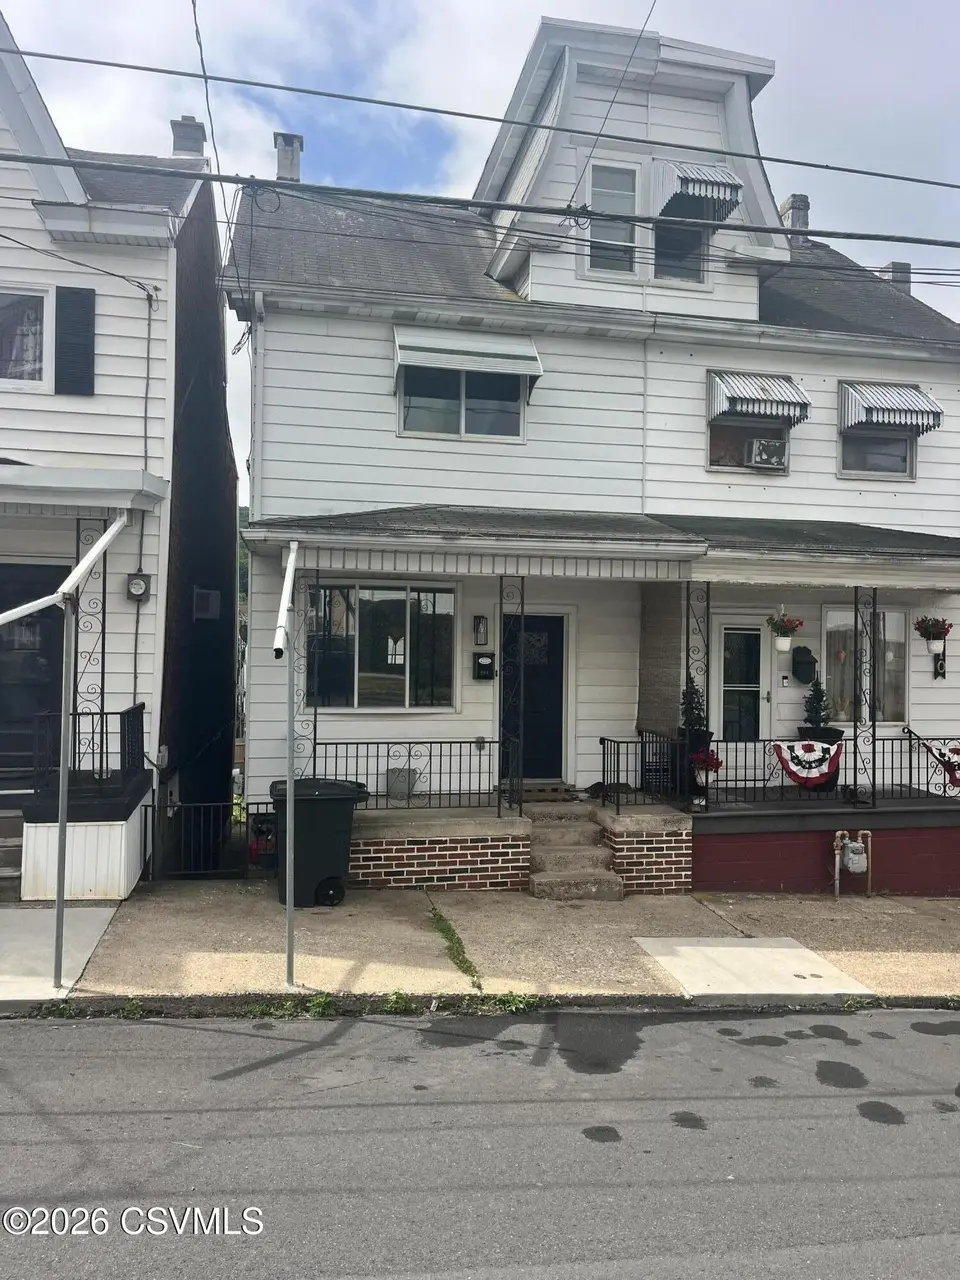
208 W 4th St · Mount Carmel, PA
Flood risk 9/10 · Severe
- FEMA flood zone
- X (unshaded)
- Chance of flooding over 30 yrs
- 0.99%
- Est. flood insurance / yr
- $473 – $860
Fire risk 3/10 · Minor
- Est. fire insurance / yr
- $511 – $949
Heat risk 4/10 · Minor
- Hot days now (above 93°F)
- 8 days/yr
- Hot days in 30 yrs
- 17 days/yr
Wind risk 3/10 · Minor
- Chance of severe wind over 30 yrs
- 5.0%
Air-quality risk 2/10 · Minimal
- Unhealthy air days now
- 1 days/yr
- Unhealthy air days in 30 yrs
- 2 days/yr
Risk factors via First Street. Map © Google.
Why this score? — see what drove the B+ grade
The composite is a weighted blend of 9 inputs, each scored 0–100. Each bar is that input's sub-score; the figure is the points it added to the 100-point composite (weight × sub-score).
- Cash flow +30.0/30.0
- 1% rule +10.0/10.0
- DSCR +10.0/10.0
- Appreciation +8.2/10.0
- ARV discount +7.5/15.0
- Livability +3.6/5.0
- Rent growth +2.5/5.0
- Condition / age +2.5/5.0
- Schools +2.3/10.0
$79,900
🖨 Deal sheet (PDF) 📄 Offer letter ✓ Due diligence
Listing remarks MLS
Move in and ready for you. Half double with 2 3/4 baths and 2 bedrooms. SQ FT taken from county tax card. Schedule through Showing Time.
Key facts
- 1,306 sq ft lot
- Built 1930
- Listed 10 days
Property features AI
Finance
- HOA & community: Sidewalks; Street lights
Exterior
- Parking: No dedicated parking
- Utilities: Public water; Public sewer; Circuit breaker electric; Cable available
- Home design: Single-family residence; Residential property
- Construction: Aluminum siding; Asbestos; Frame construction; Shingle roof; No foundation specified; Built area above grade: 1,320
- Exterior features: Patio; Porch; Storm door(s)
Interior
- Kitchen: Refrigerator
- Bathrooms: Two three-quarter bathrooms
- Heating & cooling: Heating present
- Interior features: Window coverings; Unfinished basement; Accessible entrance
- Laundry & utility: Washer; Dryer
Neighborhood map
What this means for you Summary
Snapshot
- This is a 3-bed/2.0-bath other listed at $80k.
Deal economics
- At list price, monthly cash flow is $574 ($7k/yr) — positive.
- The deal already cash-flows at list — no discount required.
- Meets the 1% rule at list price ($1k rent vs $80k).
- Cap rate 15.7% vs local median 12.2% in Mount Carmel — meaningfully above typical; check what's discounted (condition, days-on-market, listing class) to confirm the premium yield is real.
Location & tenants
- Location reads 72/100 on livability (#641 in PA) — a middle-class / working-renter tenant base. Strengths: cost of living A+, health & safety A+, crime B+; Watch: commute F, employment F.
- Mount Carmel Area SD (town): math 20% / reading 37% proficiency, ranked #455 of 539 in PA (top 84%) — low school quality limits family demand, transient renter base, plan for 1-2y turnover.
- Zoned schools: Mount Carmel Area El Sch (math 18% / reading 40%, grade F, #1,146 of 1,518 statewide, top 76%, 790 students, 100% FRL); Mount Carmel Area Jh (math 13% / reading 30%, grade F, #429 of 512 statewide, top 84%, 263 students, 100% FRL); Mount Carmel Area Hs (math 57% / reading 75%, grade B, #62 of 437 statewide, top 14%, 493 students, 74% FRL) — zoned schools average 91% FRL vs 50% district-wide (42 pts higher); higher-poverty schools than district average — tighter screening recommended.
- Market conditions: 55 active listings in the ZIP; 1 comparable units currently listed for rent nearby; 81 units permitted in Northumberland County in 2024 (0 in 5+ unit buildings).
Forward outlook
- In year one you build about $6k of equity ($552 loan paydown + $5k appreciation (6.3% local appreciation)).
- Northumberland County population projected at -11% by 2050 — secular population decline; favor cash flow + early exit over multi-decade hold.
- At projected returns (6.3% appreciation + 3.0% rent growth), your $22k cash investment doubles in ~2 years — after that, you're playing with house money.
- By year 6, paydown + projected appreciation supports a ~$31k cash-out refi (75% LTV) — recoverable capital for the next deal without selling this one.
Negotiation context
- Only 10 days on market — expect competitive offers; lowballing is unlikely to land.
- 2 sale attempts since 4y ago with the ask held roughly flat each time — persistent listings suggest the price (not the market) is what's stuck; bring a comps-based counter.
- Current owner paid $37k; list at $80k implies a 116% gain — meaningful room to come down on a strong offer.
Risks & watch-outs
- Watch-outs: flood insurance adds $56/mo; built in 1930 — expect roof / HVAC / electrical / plumbing capex.
- Climate carrying-cost: severe flood risk — expect insurance premiums to compound above CPI over the hold.
Questions for the listing agent
- Built in 1930 — when were the roof, HVAC, electrical panel, plumbing, and water heater last replaced?
- What's the actual annual flood-insurance premium (NFIP or private), and is the property in a SFHA with mandatory coverage?
- Is there a deadline driving the sale (1031 exchange, divorce, estate, relocation)? That informs how much negotiation room exists.
- Schools are D-rated, which usually means shorter tenancies and higher turnover. Who's the typical renter profile here, and what's been the actual vacancy rate?
- What's the average days-on-market for RENTAL listings here right now (not sales)? A rising rental-DOM trend means longer vacancies and softer asking-rent achievability than the comps imply.
- What's the recent tenant-quality profile in this submarket — average credit score on applications, eviction rate, late-payment / NSF rate, and stable-employment percentage? A property-management company in the area should have these aggregated.
- How much new for-sale + rental construction is in the pipeline within 1–3 miles? Heavy new supply typically softens prices + rents 12–24 months out; constrained supply supports both.
Investment metrics
- 1% rule
- 1.81% ✓
- Cap rate
- 15.75%
- Cash-on-cash
- 33.77%
- DSCR
- 2.50
- GRM
- 4.6
CMA / ARV
No comps found within radius.
Projected returns pro-forma
6.31% appreciation · 3.0% rent growth · sell at horizon
- IRR
- 42.0%
- Equity multiple
- 3.73×
- Total profit
- $61,152
- Equity at exit
- $51,811
- IRR
- 38.9%
- Equity multiple
- 7.75×
- Total profit
- $150,948
- Equity at exit
- $95,353
Cash invested: $22,372 (down + closing). Projections, not guarantees.
Landlord ↔ Tenant lean methodology
- Overall (STATE)
- 62 Landlord-Friendly
- State Pennsylvania
- 62 Landlord-Friendly · EVEN
- County
- — inherits STATE
- City
- — inherits STATE
ZIP-level market 17851
- Home prices YoY
- 5.2%
- Active inventory
- 55
- Price-to-rent
- 4.6×
Monthly cashflow live
- Estimated rent
- $1,450 medium interval (Pro) →
- Mortgage (P&I)
- −$419
- Tax from tax record
- −$64 /mo · $763/yr
- Insurance
- −$33
- Flood insurance flood zone
- −$56 /mo · $666/yr
- HOA
- −$0
- Vacancy / Maint / Mgmt
- −$304
- Net cashflow
- $574
Break-even live
Sensitivity live
| Price | -10% $619 | -5% $597 | +0% $574 | +5% $551 | +10% $529 |
|---|---|---|---|---|---|
| Rent | -10% $460 | -5% $517 | +0% $574 | +5% $631 | +10% $689 |
| Rate | -1.0pp $614 | -0.5pp $594 | base $574 | +0.5pp $553 | +1.0pp $532 |
UW: 25.0% down · 7.5% · 30yr · 1.5% tax · 5.0% vac · 8.0% maint · 8.0% mgmt
Financing live
Cash to close
- Down payment
- $19,975
- Closing costs
- $2,397
- Reserves months
- —
- Total cash needed
- —
Loan-product check · same deal, 3 products live
Conventional
25% down · 7.5% · 30yr
- Down + closing
- —
- Monthly P&I
- —
- Monthly cashflow
- —
- DSCR
- —
- Eligible?
- —
Personal DTI + credit; lowest rate.
DSCR
20% down · 8.5% · 30yr
- Down + closing
- —
- Monthly P&I
- —
- Monthly cashflow
- —
- DSCR
- —
- Eligible?
- —
No personal income docs; deal must DSCR.
Hard money
10% down · 12.0% · 12mo
- Down + closing
- —
- Monthly P&I
- —
- Monthly cashflow
- —
- DSCR
- —
- Eligible?
- —
Short-term bridge; refi at stabilization.
Rent comps 1 comps
| Address | Beds | Baths | Sqft | Rent | $/sqft | DOM | Units | Dist |
|---|---|---|---|---|---|---|---|---|
| 414 W 4th St Mount Carmel, PA | 3.0 | 1.5 | 900 | $1,450 | $1.61 | 45d | 1 | 0.16mi |
Listing history 10 events
-
2026-06-21days on market $79,900 Active 10 DOM
-
2026-06-21days on market $79,900 Active 9 DOM
-
2026-06-18days on market $79,900 Active 7 DOM
-
2026-06-17days on market $79,900 Active 6 DOM
-
2026-06-16days on market $79,900 Active 5 DOM
-
2026-06-16remarks 599-char remark
-
2026-06-15days on market $79,900 Active 4 DOM
-
2026-06-13days on market $79,900 Active 2 DOM
-
2026-06-12remarks 187-char remark
-
2026-06-12$79,900 Active 1 DOM
ⓘ Source: listings_history table (triggers on properties + properties_extension) + one-shot
backfill from property_details.listing_events for pre-trigger history.
Tax reassessment forecast PA · Partial reset (capped growth)
- Current annual tax
- $763 · $64/mo
- Projected year-2 tax
- $1,013 · $84/mo
- Expected delta
- +$250/yr (+$21/mo · 32.7%)
ⓘ Screening estimate from a state-policy table — verify with the county assessor before closing.
Climate risk First Street
- Flood 9/10 Extreme FEMA zone X (unshaded) · 99% chance over 30 yrs
- Wildfire 3/10 Moderate
- Heat 4/10 Moderate 8 d/yr ≥93°F today · 17 d/yr by 30 yrs out
- Wind 3/10 Moderate 5% chance of damaging wind over 30 yrs
- Air quality 2/10 Low 1 unhealthy d/yr today · 2 by 30 yrs out
Nearby sold comps map
Loading sold comps map…
Walkable amenities ~0.75 mi
Loading nearby amenities…
Taxation est. · year 1
- Rental income
- $17,400
- − Mortgage interest
- −$4,476
- − Property taxes
- −$763
- − Insurance
- −$1,066
- − Repairs & maintenance
- −$1,392
- − Management
- −$1,392
- − Depreciation
- −$2,324
- Taxable income
- $5,987
- Est. tax owed @ 24.0%
- −$1,437
- After-tax cash flow
- $5,452/yr
For passive investors: Depreciation is non-cash, so a rental often shows a tax loss while cash-flowing — sheltering income. Rental losses are passive: they offset passive income freely, and up to $25,000/yr can offset ordinary (W-2) income if you actively participate and your MAGI is under $100k (phasing out to $0 by $150k); unused losses carry forward. On sale, claimed depreciation is recaptured at up to 25%, and gains may owe capital-gains tax (a 1031 exchange can defer both). Figures are a year-1 estimate at your 24.0% rate — not tax advice; consult a CPA.
Schools (NCES district)
- District
- Mount Carmel Area SD
- NCES district ID
- 4215990
- Math proficiency
- 20% ▼ -18.00%
- Reading proficiency
- 37% ▼ -15.00%
- Median HH income
- $35,195
- Composite
- 23.48/100
- National rank
- #7876
- State rank
- #455 of 539 in PA
Livability — Mount Carmel
- Score
- 72/100
- State rank
- #641
- US rank
- #6230
Category grades
Schools grade is shown separately in the Schools card above.
Census & demographics
- Census place
- Mount Carmel, PA
- Population (ZIP)
- 7,174
Population outlook (Northumberland County) Hauer SSP2
- Today (2025)
- 90,896 people
- By 2030
- 89,084 · -2.0%
- By 2040
- 84,822 · -6.7%
- By 2050
- 80,521 · -11.4%
- By 2075
- 72,152 · -20.6%
- By 2100
- 62,257 · -31.5%
Race, ethnicity, and origin ACS 2023
- Neighborhood character
- Predominantly White (92%)
- Race & ethnicity
- White 92% Two or more races 5% Hispanic / Latino 4% Black 1%
- Common ancestry
- Romanian 21% Subsaharan African 3% Iranian 2%
- Foreign-born
- 2% · Canada
- Languages at home
- 96% English-only · Spanish 3% Russian/Polish/Slavic 1%
Political lean MEDSL · Northumberland
- 2024 margin
- Solid R (+39.9) · D 29.6% · R 69.5%
- 2008→2024 swing
- -26.1pp toward R · 2008: -13.8pp · 2024: -39.9pp
- All cycles
- 2024: R+39.9 2020: R+38.5 2016: R+43.6 2012: R+19.4 2008: R+13.8
Not yet ingested
- Civics
- —
Market trends
- HPI YoY
- ▲ 6.31%
- Current HPI
- 127.4102
- Rent YoY
- —
- Metro
- —
- State GDP YoY
- ▲ 1.68%
- F500 in state
- 34
Industry mix (Fortune 500 HQ in PA)
| Industry | F500 HQs | Revenue |
|---|---|---|
| Healthcare | 2 | $309B |
|
||
| Insurance | 2 | $27B |
|
||
| Telecommunications / Media | 1 | $124B |
|
||
| Industrial Distribution | 1 | $22B |
|
||
| Financial Services | 1 | $20B |
|
||
| Chemicals / Materials | 1 | $18B |
|
||
Price history
+167.2% since first listed3 events — show timeline
- 2026-06-11 Listed $79,900 CSVBR
- 2022-05-31 Sold (MLS) $37,000 CSVBR
- 2022-04-25 Listed $29,900 CSVBR
Property tax history
+2.6%/yrLatest (2026): $763 · +1.5% YoY. Source: county tax records.
Cash-flow waterfall
monthlySold comps — $/sqft
last 12 mo · ≤1 miLoading sold comps…