 🏷️ Likely Rental
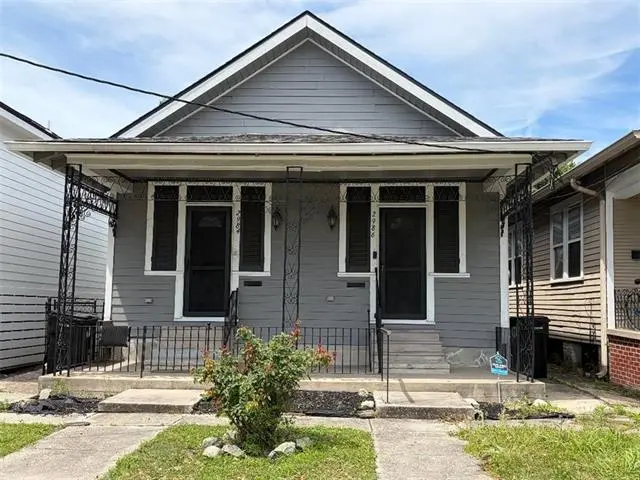
2984- Toledano St · New Orleans, LA
Flood risk 8/10 · Major
- FEMA flood zone
- AE
- Chance of flooding over 30 yrs
- 0.78%
- Est. flood insurance / yr
- $1,737 – $8,500
Fire risk 1/10 · Minimal
- Est. fire insurance / yr
- $1,269 – $2,357
Heat risk 10/10 · Severe
- Hot days now (above 108°F)
- 7 days/yr
- Hot days in 30 yrs
- 21 days/yr
Wind risk 10/10 · Severe
- Chance of severe wind over 30 yrs
- 99.0%
Air-quality risk 3/10 · Minor
- Unhealthy air days now
- 3 days/yr
- Unhealthy air days in 30 yrs
- 4 days/yr
Risk factors via First Street. Map © Google.
Why this score? — see what drove the B+ grade
The composite is a weighted blend of 9 inputs, each scored 0–100. Each bar is that input's sub-score; the figure is the points it added to the 100-point composite (weight × sub-score).
- Cash flow +30.0/30.0
- ARV discount +15.0/15.0
- DSCR +10.0/10.0
- 1% rule +9.8/10.0
- Livability +4.0/5.0
- Rent growth +2.7/5.0
- Condition / age +2.2/5.0
- Schools +1.6/10.0
- Appreciation +0.0/10.0
$195,000
🖨 Deal sheet 📄 Offer letter ✓ Due diligence
Multi-family units
County records classify this as Multi-Family (2-4 Unit). Listing-text estimate: 1 unit. estimate disagrees with records
Listing remarks MLS
Move in right now and get help with note payment. Updated 2009 Located in rapidly developing area, convenient to hospitals, CBD, transportation, shopping and universities... New construction built for owner occupant. The front of this double likely dates from 1920's or earlier and has high ceilings and hardwood floors. Great opportunity to get into this area of may renovations. EZ access to Superdome, Smoothie Center and I-10 and the Crescent City Connection. Don't miss this opportunity to buy this double on large lot with a long term tenant, paying $1000 per month. neighbors have told me they pay $1300 and $1500 for similarly sized units Motivated seller Make an offer
Key facts
- Gutted and renovated
- High ceilings
- Built 1925
Tags
Property features AI
Finance
- Other: Lot is a rectangular city lot (approximately 30 x 154/154); Tenant pays electricity, gas, and water (multi-unit information indicates tenant responsibility)
Exterior
- Parking: Off-street parking
- Utilities: Public water; Public sewer
- Home design: Single-story home; Raised foundation
- Construction: Wood siding exterior; Asphalt shingle roof
- Exterior features: Fenced yard; Front porch
Interior
- Bathrooms: 2 full bathrooms
- Heating & cooling: Central heating; Window unit heating; Central air conditioning; Window unit air conditioning
- Interior features: Average condition
- Laundry & utility: Inside laundry
Neighborhood map
What this means for you Summary
Snapshot
- This is a 4-bed/2.0-bath multifamily listed at $195k. Condition is rated fair.
Deal economics
- At list price, monthly cash flow is $503 ($6k/yr) — positive.
- The deal already cash-flows at list — no discount required.
- Meets the 1% rule at list price ($3k rent vs $195k).
- Recommended offer: $189k (3.0% below list) — sets the bar for market timing.
- Cap rate 12.0% vs local median 4.4% in New Orleans — top-decile yield for the area; either an underpriced asset or a hidden risk that comps aren't pricing in. Stress-test before assuming the spread holds.
Location & tenants
- Location reads 81/100 on livability (#3 in LA, #1,383 nationally) — a professional / high-income tenant draw. Strengths: amenities A+, commute A+, health & safety A+; Watch: crime C-, employment D.
- Orleans Parish (urban): math 11% / reading 27% proficiency, ranked #69 of 98 in LA (top 70%) — low school quality limits family demand, transient renter base, plan for 1-2y turnover; 68% free/reduced lunch — lower-income household profile, screen leases tightly.
- Market conditions: Rents flat; 217 active listings in the ZIP; 40 comparable units currently listed for rent nearby; rentals at typical pace (median 24d on market — plan ~3-4 weeks tenant-placement turnaround); 710 units permitted in Orleans Parish in 2024 (244 in 5+ unit buildings).
- At $2,883/mo this rent would consume 57% of the median local household income ($61k/yr) (locally 1270% of renters already pay >50% of income on rent) — very limited rent-growth headroom before tenants either downsize or default.
Forward outlook
- Local home prices are declining (-3.0%/yr); year-one equity from $1k of loan paydown is wiped out by about $6k of value loss. Plan a longer hold.
- Orleans County population projected at +61% by 2050 — long-run rental-demand tailwind backs the buy-and-hold thesis.
Negotiation context
- It's been on market 44 days — a 3% lower offer ($189k) is reasonable based on typical stale-listing flexibility.
- 2 sale attempts with the ask held roughly flat each time — persistent listings suggest the price (not the market) is what's stuck; bring a comps-based counter.
Risks & watch-outs
- Watch-outs: flood insurance adds $427/mo; built in 1925 — expect roof / HVAC / electrical / plumbing capex.
- Climate carrying-cost: in FEMA flood zone AE (mandatory federal flood insurance); severe wind risk, 99% chance of damaging wind over 30y; extreme-heat days projected 7→21/yr by 2055 (HVAC capex compounding) — expect insurance premiums to compound above CPI over the hold.
Questions for the listing agent
- It's been on market 44 days. Have you received any prior offers? Is the seller open to a 3% concession, seller financing, or rate buy-down credit?
- Have any recent inspections been done? Can we get a copy of the seller's disclosures and any deferred-maintenance estimates?
- Built in 1925 — when were the roof, HVAC, electrical panel, plumbing, and water heater last replaced?
- What's the actual annual flood-insurance premium (NFIP or private), and is the property in a SFHA with mandatory coverage?
- Is there a deadline driving the sale (1031 exchange, divorce, estate, relocation)? That informs how much negotiation room exists.
- What's the average days-on-market for RENTAL listings here right now (not sales)? A rising rental-DOM trend means longer vacancies and softer asking-rent achievability than the comps imply.
- What's the recent tenant-quality profile in this submarket — average credit score on applications, eviction rate, late-payment / NSF rate, and stable-employment percentage? A property-management company in the area should have these aggregated.
- How much new apartment / multifamily construction is in the pipeline within 1–3 miles? Heavy new supply (>2% of stock underway) typically softens rents 12–24 months out; light construction supports rent growth.
Investment metrics
- 1% rule
- 1.48% ✓
- Cap rate
- 12.02%
- Cash-on-cash
- 20.44%
- DSCR
- 1.91
- GRM
- 5.6
CMA / ARV
- ARV (median comp)
- $288,760
- List price
- $195,000
- Delta
- -30.91%
- Verdict
- UNDERPRICED
- Comps
- 20 within 1.0 mi
Show comp detail 12 sales within ~0.75 mi
| Address | Dist | Beds/Ba | Sqft | Sold | Price | $/sf | Match |
|---|---|---|---|---|---|---|---|
| 3020 22 Gen Taylor St | 0.22mi | 4/2.0 | 1,717 (-5%) | 6mo | $190,000 | $111 | 77 |
| 2820-22 Milan St | 0.35mi | 4/2.0 | 1,704 (-5%) | 0mo | $305,000 | $179 | 74 |
| 2712 14 S Johnson St | 0.23mi | 4/4.0 | 1,870 (+4%) | 6mo | $246,200 | $132 | 70 |
| 3112 14 General Taylor St | 0.22mi | 4/2.0 | 1,930 (+7%) | 11mo | $265,000 | $137 | 69 |
| 3528 30 Toledano St | 0.34mi | 5/2.0 (+1) | 1,700 (-6%) | 2mo | $133,000 | $78 | 68 |
| 3717 S Johnson St | 0.24mi | 4/2.0 | 1,605 (-11%) | 7mo | $145,000 | $90 | 65 |
| 2624-2626 Jackson Ave | 0.51mi | 4/2.0 | 1,713 (-5%) | 6mo | $159,900 | $93 | 63 |
| 3324-26 Second St | 0.32mi | 4/2.0 | 1,995 (+11%) | 9mo | $30,003 | $15 | 59 |
| 2700-2702 S Johnson St | 0.24mi | 4/3.0 | 1,600 (-11%) | 9mo | $315,000 | $197 | 59 |
| 2219 21 Toledano St | 0.60mi | 4/2.0 | 1,640 (-9%) | 4mo | $232,000 | $141 | 54 |
| 4911 13 Willow St | 0.67mi | 4/4.0 | 1,769 (-2%) | 11mo | $375,000 | $212 | 48 |
| 2113 15 S Liberty St | 0.73mi | 4/2.0 | 1,624 (-10%) | 10mo | $228,500 | $141 | 41 |
Match score weights: distance 35% · size 25% · config 20% · recency 20%. Top-matched comps best support the ARV.
Projected returns pro-forma
-3.0% appreciation · 0.73% rent growth · sell at horizon
- IRR
- -2.8%
- Equity multiple
- 0.90×
- Total profit
- $-5,668
- Equity at exit
- $29,075
- IRR
- 3.6%
- Equity multiple
- 1.23×
- Total profit
- $12,346
- Equity at exit
- $16,860
Cash invested: $54,600 (down + closing). Projections, not guarantees.
Landlord ↔ Tenant lean methodology
- Overall (STATE)
- 90 Strongly Landlord-Friendly
- State Louisiana
- 90 Strongly Landlord-Friendly · R+12
- County
- — inherits STATE
- City
- — inherits STATE
ZIP-level market 70125
- Home prices YoY
- -16.3%
- Rents YoY
- 0.7%
- Active inventory
- 217
- Price-to-rent
- 11.3×
Monthly cashflow live
- Estimated rent
- $2,883 high interval (Pro) →
- Mortgage (P&I)
- −$1,023
- Tax est. 1.5%
- −$244 /mo · $2,925/yr
- Insurance
- −$81
- Flood insurance flood zone
- −$427 /mo · $5,118/yr
- HOA
- −$0
- Vacancy / Maint / Mgmt
- −$605
- Net cashflow
- $503
Break-even live
2-unit breakdown (identical units grouped — click to expand)
| Units | Beds | Baths | Est. rent |
|---|---|---|---|
| 2× units | 2 | 1 | $2,884 |
| #1 | 2 | 1 | $1,442 |
| #2 | 2 | 1 | $1,442 |
| Total (2 units) | $2,883 | ||
UW: 25.0% down · 7.5% · 30yr · 1.5% tax · 5.0% vac · 8.0% maint · 8.0% mgmt
Financing live
Cash to close
- Down payment
- $48,750
- Closing costs
- $5,850
- Reserves months
- —
- Total cash needed
- —
Loan-product check · same deal, 3 products live
Conventional
25% down · 7.5% · 30yr
- Down + closing
- —
- Monthly P&I
- —
- Monthly cashflow
- —
- DSCR
- —
- Eligible?
- —
Personal DTI + credit; lowest rate.
DSCR
20% down · 8.5% · 30yr
- Down + closing
- —
- Monthly P&I
- —
- Monthly cashflow
- —
- DSCR
- —
- Eligible?
- —
No personal income docs; deal must DSCR.
Hard money
10% down · 12.0% · 12mo
- Down + closing
- —
- Monthly P&I
- —
- Monthly cashflow
- —
- DSCR
- —
- Eligible?
- —
Short-term bridge; refi at stabilization.
Rent comps 40 comps
| Address | Beds | Baths | Sqft | Rent | $/sqft | DOM | Units | Dist |
|---|---|---|---|---|---|---|---|---|
| 2833 S Derbigny St New Orleans, LA | 3.0 | 2.0 | 1500 | $1,795 | $1.20 | 24d | 1 | 0.05mi |
| 3200 Washington Ave Unit NA New Orleans, LA | 4.0 | 3.0 | 2490 | $3,400 | $1.37 | 3d | 1 | 0.10mi |
| 3044 Louisiana Avenue Pkwy New Orleans, LA | 3.0 | 2.0 | 1800 | $1,900 | $1.06 | 24d | 1 | 0.10mi |
| 3208 Louisiana Avenue Pkwy New Orleans, LA | 3.0 | 2.0 | 1391 | $1,900 | $1.37 | 17d | 1 | 0.11mi |
| 3035 Delachaise St New Orleans, LA | 3.0 | 1.0 | 1968 | $1,750 | $0.89 | 2d | 1 | 0.14mi |
| 2614 S Johnson St New Orleans, LA | 3.0 | 2.0 | 1536 | $2,079 | $1.35 | 14d | 1 | 0.24mi |
| 3120 Second St New Orleans, LA | 3.0 | 3.0 | 1256 | $2,050 | $1.63 | 24d | 1 | 0.27mi |
| 3429 Clara St New Orleans, LA | 3.0 | 2.0 | 1620 | $2,350 | $1.45 | 14d | 1 | 0.27mi |
| 4206 S Derbigny St New Orleans, LA | 3.0 | 1.0 | 1300 | $1,600 | $1.23 | 24d | 1 | 0.30mi |
| 3514 S Miro St New Orleans, LA | 3.0 | 2.0 | 1230 | $1,950 | $1.59 | 17d | 1 | 0.30mi |
| 2606 S Miro St New Orleans, LA | 3.0 | 2.0 | 1450 | $2,016 | $1.39 | 24d | 1 | 0.34mi |
| 3617 Fourth St Unit A New Orleans, LA | 3.0 | 2.0 | 1225 | $1,995 | $1.63 | 17d | 1 | 0.36mi |
| 2608 Magnolia St New Orleans, LA | 4.0 | 2.5 | 1950 | $3,200 | $1.64 | 44d | 1 | 0.38mi |
| 2717 Milan St New Orleans, LA | 3.0 | 1.5 | 1850 | $1,650 | $0.89 | 14d | 1 | 0.41mi |
| 3218 Jackson Ave New Orleans, LA | 3.0 | 2.0 | 1267 | $1,750 | $1.38 | 24d | 1 | 0.42mi |
| 2539 Amelia St New Orleans, LA | 3.0 | 2.0 | 1296 | $2,200 | $1.70 | 24d | 1 | 0.43mi |
| 2600 Peniston St New Orleans, LA | 4.0 | 2.0 | 2342 | $3,500 | $1.49 | 44d | 1 | 0.44mi |
| 2535 Marengo St New Orleans, LA | 3.0 | 1.0 | 1300 | $1,200 | $0.92 | 14d | 1 | 0.48mi |
| 3350 Jena St New Orleans, LA | 3.0 | 2.5 | 2200 | $2,500 | $1.14 | 44d | 1 | 0.50mi |
| 4603 S Miro St New Orleans, LA | 3.0 | 2.0 | 1650 | $1,650 | $1.00 | 24d | 1 | 0.60mi |
| 2722 Martin L King Bl New Orleans, LA | 3.0 | 2.5 | 1350 | $1,800 | $1.33 | 24d | 1 | 0.64mi |
| 2717 Loyola Ave New Orleans, LA | 3.0 | 2.0 | 1250 | $2,300 | $1.84 | 2d | 1 | 0.65mi |
| 2717 Loyola Ave New Orleans, LA | 3.0 | 2.0 | 1232 | $2,300 | $1.87 | 24d | 1 | 0.65mi |
| 3636 Upperline St New Orleans, LA | 3.0 | 1.0 | 1600 | $1,975 | $1.23 | 24d | 1 | 0.66mi |
| 2231 S Liberty St New Orleans, LA | 3.0 | 3.5 | 1752 | $2,000 | $1.14 | 17d | 1 | 0.68mi |
| 4223 S Liberty St New Orleans, LA | 3.0 | 1.5 | 1509 | $2,400 | $1.59 | 3d | 1 | 0.69mi |
| 1407 Magnolia St New Orleans, LA | 3.0 | 2.0 | 1824 | $1,500 | $0.82 | 24d | 1 | 0.70mi |
| 2806 Upperline St Unit Lower New Orleans, LA | 3.0 | 2.0 | 1250 | $2,500 | $2.00 | 20d | 1 | 0.71mi |
| 2123 S Liberty St Unit 2125 New Orleans, LA | 3.0 | 2.0 | 1500 | $2,100 | $1.40 | 3d | 1 | 0.72mi |
| 2107 Fourth St New Orleans, LA | 3.0 | 1.0 | 1292 | $1,775 | $1.37 | 17d | 1 | 0.72mi |
| 5417 S Johnson St New Orleans, LA | 3.0 | 3.0 | 1739 | $2,900 | $1.67 | 17d | 1 | 0.75mi |
| 2733 Danneel St New Orleans, LA | 4.0 | 2.0 | 1350 | $1,775 | $1.31 | 24d | 1 | 0.78mi |
| 2403 S Saratoga St New Orleans, LA | 3.0 | 2.5 | 1600 | $2,500 | $1.56 | 24d | 1 | 0.78mi |
| 2117 S Lopez St New Orleans, LA | 5.0 | 2.0 | 1920 | $2,000 | $1.04 | 24d | 1 | 0.78mi |
| 2308 Jena St New Orleans, LA | 3.0 | 2.5 | 2550 | $3,300 | $1.29 | 44d | 1 | 0.79mi |
| 3212 Danneel St New Orleans, LA | 3.0 | 2.0 | 1945 | $2,000 | $1.03 | 24d | 1 | 0.80mi |
| 4400 Elba St New Orleans, LA | 3.0 | 2.0 | 1600 | $1,875 | $1.17 | 24d | 1 | 0.83mi |
| 4435 Loyola Ave New Orleans, LA | 3.0 | 2.0 | 1973 | $2,900 | $1.47 | 16d | 1 | 0.83mi |
| 2318 Martin Luther King Junior Blvd New Orleans, LA | 3.0 | 2.0 | 1400 | $1,700 | $1.21 | 24d | 1 | 0.83mi |
| 4403 Elba St New Orleans, LA | 3.0 | 2.0 | 1400 | $1,800 | $1.29 | 3d | 1 | 0.83mi |
Listing history 19 events
-
2026-06-18days on market $195,000 Active 44 DOM
-
2026-06-17price $195,000 Active 43 DOM
Show marketing remark (677 chars)
Move in right now and get help with note payment. Updated 2009 Located in rapidly developing area, convenient to hospitals, CBD, transportation, shopping and universities... New construction built for owner occupant. The front of this double likely dates from 1920's or earlier and has high ceilings and hardwood floors. Great opportunity to get into this area of may renovations. EZ access to Superdome, Smoothie Center and I-10 and the Crescent City Connection. Don't miss this opportunity to buy this double on large lot with a long term tenant, paying $1000 per month. neighbors have told me they pay $1300 and $1500 for similarly sized units Motivated seller Make an offer
-
2026-06-17days on market $199,500 Active 43 DOM
Show marketing remark (677 chars)
Move in right now and get help with note payment. Updated 2009 Located in rapidly developing area, convenient to hospitals, CBD, transportation, shopping and universities... New construction built for owner occupant. The front of this double likely dates from 1920's or earlier and has high ceilings and hardwood floors. Great opportunity to get into this area of may renovations. EZ access to Superdome, Smoothie Center and I-10 and the Crescent City Connection. Don't miss this opportunity to buy this double on large lot with a long term tenant, paying $1000 per month. neighbors have told me they pay $1300 and $1500 for similarly sized units Motivated seller Make an offer
-
2026-06-16days on market $199,500 Active 42 DOM
-
2026-06-15days on market $199,500 Active 41 DOM
-
2026-06-13days on market $199,500 Active 39 DOM
-
2026-06-10days on market $199,500 Active 36 DOM
-
2026-06-09days on market $199,500 Active 35 DOM
-
2026-06-08days on market $199,500 Active 34 DOM
-
2026-06-07days on market $199,500 Active 33 DOM
-
2026-06-05days on market $199,500 Active 30 DOM
-
2026-06-03days on market $199,500 Active 29 DOM
-
2026-06-02days on market $199,500 Active 28 DOM
-
2026-06-01days on market $199,500 Active 27 DOM
-
2026-05-31days on market $199,500 Active 26 DOM
-
2026-05-05$205,000 Active 523-char remark
Show marketing remark (677 chars)
Move in right now and get help with note payment. Updated 2009 Located in rapidly developing area, convenient to hospitals, CBD, transportation, shopping and universities... New construction built for owner occupant. The front of this double likely dates from 1920's or earlier and has high ceilings and hardwood floors. Great opportunity to get into this area of may renovations. EZ access to Superdome, Smoothie Center and I-10 and the Crescent City Connection. Don't miss this opportunity to buy this double on large lot with a long term tenant, paying $1000 per month. neighbors have told me they pay $1300 and $1500 for similarly sized units Motivated seller Make an offer
-
2026-05-05$205,000 Active 525-char remark
Show marketing remark (677 chars)
Move in right now and get help with note payment. Updated 2009 Located in rapidly developing area, convenient to hospitals, CBD, transportation, shopping and universities... New construction built for owner occupant. The front of this double likely dates from 1920's or earlier and has high ceilings and hardwood floors. Great opportunity to get into this area of may renovations. EZ access to Superdome, Smoothie Center and I-10 and the Crescent City Connection. Don't miss this opportunity to buy this double on large lot with a long term tenant, paying $1000 per month. neighbors have told me they pay $1300 and $1500 for similarly sized units Motivated seller Make an offer
-
2025-11-03price $225,000
-
2025-02-25price $275,000
ⓘ Source: listings_history table (triggers on properties + properties_extension) + one-shot
backfill from property_details.listing_events for pre-trigger history.
Climate risk First Street
- Flood 8/10 Severe FEMA zone AE · 78% chance over 30 yrs
- Wildfire 1/10 Low
- Heat 10/10 Extreme 7 d/yr ≥108°F today · 21 d/yr by 30 yrs out
- Wind 10/10 Extreme 99% chance of damaging wind over 30 yrs
- Air quality 3/10 Moderate 3 unhealthy d/yr today · 4 by 30 yrs out
Nearby sold comps map
Loading sold comps map…
Walkable amenities ~0.75 mi
Loading nearby amenities…
Taxation est. · year 1
- Rental income
- $34,596
- − Mortgage interest
- −$10,923
- − Property taxes
- −$2,925
- − Insurance
- −$6,094
- − Repairs & maintenance
- −$2,768
- − Management
- −$2,768
- − Depreciation
- −$5,673
- Taxable income
- $3,446
- Est. tax owed @ 24.0%
- −$827
- After-tax cash flow
- $5,214/yr
For passive investors: Depreciation is non-cash, so a rental often shows a tax loss while cash-flowing — sheltering income. Rental losses are passive: they offset passive income freely, and up to $25,000/yr can offset ordinary (W-2) income if you actively participate and your MAGI is under $100k (phasing out to $0 by $150k); unused losses carry forward. On sale, claimed depreciation is recaptured at up to 25%, and gains may owe capital-gains tax (a 1031 exchange can defer both). Figures are a year-1 estimate at your 24.0% rate — not tax advice; consult a CPA.
Condition & rehab AI · 7 photos
This property is in fair condition with moderate rehabilitation needs. It has potential for increased value through painting, updating countertops and tiles, and landscaping.
Repairs flagged
- Minor Kitchen countertops — The countertops appear worn and could benefit from a fresh coat of paint or replacement.
- Minor Bathroom tiles — The tiles in the bathrooms appear worn and could benefit from a fresh coat of paint or replacement.
- Minor Landscaping — The landscaping is overgrown and needs trimming to improve curb appeal.
Value-add opportunities
- Resale Painting interior walls — Fresh paint can make a significant difference in the home's appearance and can increase its resale value.
- Resale Reframing kitchen countertops — Fresh countertops can improve the home's functionality and aesthetic appeal, increasing its resale value.
- Resale Reframing bathroom tiles — Fresh tiles can improve the home's functionality and aesthetic appeal, increasing its resale value.
- Rental Landscaping — A well-maintained yard can attract tenants and increase rental value.
Renovation cost estimate screening
| Repair item | Severity | Est. cost |
|---|---|---|
| Kitchen countertops · The countertops appear worn and could benefit from a fresh coat of paint or replacement. | Minor | $500–3,000 |
| Bathroom tiles · The tiles in the bathrooms appear worn and could benefit from a fresh coat of paint or replacement. | Minor | $500–3,000 |
| Landscaping · The landscaping is overgrown and needs trimming to improve curb appeal. | Minor | $500–3,000 |
| Total estimated repair cost · 3 items | $1,500–9,000 |
Value-add ROI direction
- Resale Painting interior walls — Fresh paint can make a significant difference in the home's appearance and can increase its resale value. ↑
- Resale Reframing kitchen countertops — Fresh countertops can improve the home's functionality and aesthetic appeal, increasing its resale value. ↑
- Resale Reframing bathroom tiles — Fresh tiles can improve the home's functionality and aesthetic appeal, increasing its resale value. ↑
- Rental Landscaping — A well-maintained yard can attract tenants and increase rental value. ↑
ⓘ Cost ranges are severity-bucket heuristics (US national rule-of-thumb). Get contractor quotes + a written scope before underwriting a rehab budget.
Schools (NCES district)
- District
- Orleans Parish
- NCES district ID
- 2201170
- Math proficiency
- 11% ▼ -52.00%
- Reading proficiency
- 27% ▼ -46.00%
- Median HH income
- $37,011
- Composite
- 15.78/100
- National rank
- #9271
- State rank
- #69 of 98 in LA
Livability — New Orleans
- Score
- 81/100
- State rank
- #3
- US rank
- #1383
Category grades
Schools grade is shown separately in the Schools card above.
Census & demographics
- Census place
- New Orleans, LA
- County
- Orleans Parish · 338,817 people
- City population
- 338,817
- Metro
- New Orleans-Metairie, LA
- Population (ZIP)
- 17,821
- Household income
- $61,174
- Rent vs Own
- Severe rent burden
- 1270.0
Population outlook (Orleans County) Hauer SSP2
- Today (2025)
- 513,025 people
- By 2030
- 575,781 · +12.2%
- By 2040
- 700,174 · +36.5%
- By 2050
- 826,541 · +61.1%
- By 2075
- 1,123,374 · +119.0%
- By 2100
- 1,355,609 · +164.2%
Race, ethnicity, and origin ACS 2023
- Neighborhood character
- Diverse neighborhood (Simpson 0.63)
- Race & ethnicity
- Black 51% White 32% Hispanic / Latino 9% Two or more races 9% Asian 2% Native American 1%
- Hispanic origin (detail)
- Mexican 2%
- Common ancestry
- Lithuanian 8% Romanian 1% Slovak 1%
- Foreign-born
- 7% · Canada, China
- Languages at home
- 90% English-only · Spanish 6% French/Haitian/Cajun 1% Chinese 1%
Political lean MEDSL · Orleans
- 2024 margin
- Solid D (+67.0) · D 82.2% · R 15.2% · Other 2.7%
- 2008→2024 swing
- +6.7pp toward D · 2008: 60.3pp · 2024: 67.0pp
- All cycles
- 2024: D+67.0 2020: D+68.2 2016: D+66.2 2012: D+62.5 2008: D+60.3
Not yet ingested
- Civics
- —
Market trends
- HPI YoY
- ▼ -49.68%
- Current HPI
- 255.5998
- Rent YoY
- ▲ 0.73%
- Metro
- New Orleans-Metairie, LA
- State GDP YoY
- ▲ 3.29%
- F500 in state
- 10
Industry mix (Fortune 500 HQ in LA)
| Industry | F500 HQs | Revenue |
|---|---|---|
| Telecommunications | 2 | $23B |
|
||
| Utilities | 1 | $12B |
|
||
| Wholesale / Distribution | 1 | $5B |
|
||
| Advertising | 1 | $2B |
|
||
Price history
-29.1% since first listed8 events — show timeline
- 2026-06-17 Price Changed $195,000 AcadianaMLS
- 2026-06-17 Price Changed $195,000 GSREIN
- 2026-05-22 Price Changed $199,500 AcadianaMLS
- 2026-05-22 Price Changed $199,500 GSREIN
- 2026-05-05 Listed $205,000 GSREIN
- 2026-05-05 Listed $205,000 AcadianaMLS
- 2025-11-03 Price Changed $225,000 GSREIN
- 2025-02-25 Price Changed $275,000 GSREIN
Cash-flow waterfall
monthlySold comps — $/sqft
last 12 mo · ≤1 miLoading sold comps…