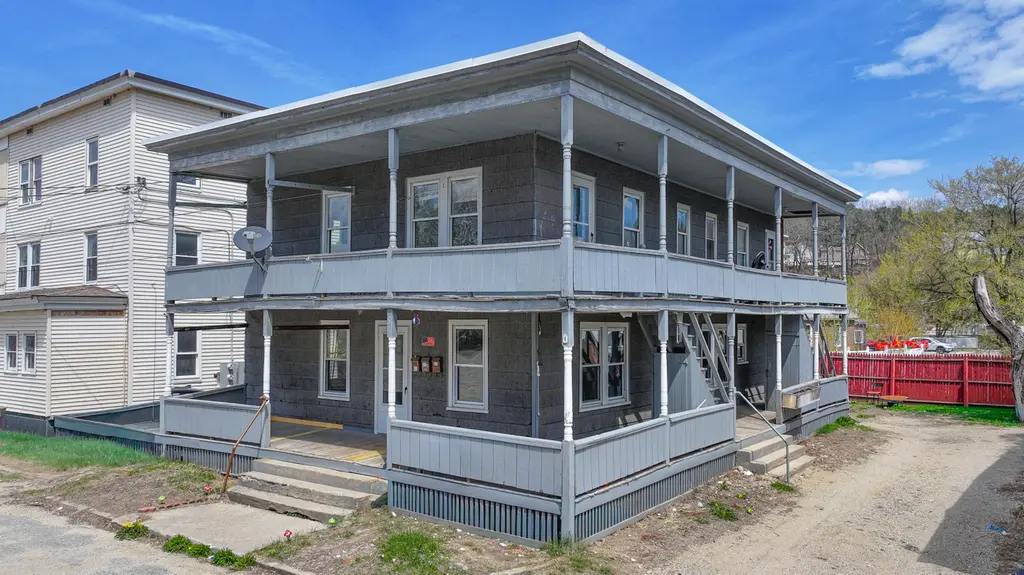
11 Holman Ave · Mexico, ME
Flood risk No data
- FEMA flood zone
- —
- Chance of flooding over 30 yrs
- —
- Est. flood insurance / yr
- —
Fire risk No data
- Est. fire insurance / yr
- —
Heat risk No data
- Hot days now (above threshold)
- —
- Hot days in 30 yrs
- —
Wind risk No data
- Chance of severe wind over 30 yrs
- —
Air-quality risk No data
- Unhealthy air days now
- —
- Unhealthy air days in 30 yrs
- —
Risk factors via First Street. Map © Google.
Why this score? — see what drove the C grade
The composite is a weighted blend of 9 inputs, each scored 0–100. Each bar is that input's sub-score; the figure is the points it added to the 100-point composite (weight × sub-score).
- Cash flow +18.4/30.0
- ARV discount +7.8/15.0
- Schools +6.3/10.0
- DSCR +5.8/10.0
- 1% rule +4.4/10.0
- Appreciation +3.8/10.0
- Livability +3.8/5.0
- Rent growth +2.5/5.0
- Condition / age +2.5/5.0
$174,900
🖨 Deal sheet 📄 Offer letter ✓ Due diligence
Listing remarks MLS
Looking for an affordable investment?! Look no further! This 3 family multi-unit is right in town and convenient to everything. Strong rental history, with all units occupied. Please allow 24 hours for showings. This property is broker owned.
Key facts
- Near schools
- Near shopping
- Near restaurants
Tags
Property features AI
Finance
- Financial info: Total of 3 residential units; Gross annual income reported: $29,400; Operating expenses reported: $12,565; Typical rents listed by unit: two 1-bedroom units at $950, one 1-bedroom unit at $950 (additional 1-bed units shown), and multiple 3-bedroom units at $1,500
Exterior
- Parking: Gravel off-street parking with 1–4 spaces
- Utilities: Public water; Public sewer; Electric service with circuit breakers; Utilities currently on
- Home design: Multi-family property; Two-story building (multi-level); Built in 1934
- Construction: Wood frame construction with shingle siding; Asbestos present in construction materials; Membrane roof; Full, unfinished basement with interior entry
- Exterior features: Front porch; Intown, level lot; Paved road access
Interior
- Kitchen: Refrigerators provided in each unit
- Bedrooms: Multiple units including 1-bedroom and 3-bedroom configurations (units located on first and second levels)
- Flooring: Laminate flooring; Vinyl flooring
- Bathrooms: Three full bathrooms (total for the building)
- Heating & cooling: Baseboard heating
- Interior features: Bathtub; Double-pane windows; Unfurnished
- Laundry & utility: No dedicated water heaters or dedicated electric/gas meters for units; Electric water heater (building)
Neighborhood map
What this means for you Summary
Snapshot
- This is a 15-bed/9.0-bath other listed at $175k.
Deal economics
- At list price, monthly cash flow is $165 ($2k/yr) — positive.
- The deal already cash-flows at list — no discount required.
- To meet the 1% rule (rent ≥ 1% of price), the offer needs to be $165k (5.8% below list).
- Recommended offer: $165k (5.8% below list) — sets the bar for 1% rule.
Location & tenants
- Location reads 76/100 on livability (#35 in ME, #3,803 nationally) — a middle-class / working-renter tenant base. Strengths: crime A+, cost of living A+, health & safety A+; Watch: commute D+, schools D-, amenities F.
- RSU 10 (rural): math 72% / reading 79% proficiency, ranked #107 of 112 in ME (top 96%) — strong family-tenant draw, lease renewals of 3-5y typical.
- Market conditions: 34 active listings in the ZIP; 329 units permitted in Oxford County in 2024 (0 in 5+ unit buildings).
Forward outlook
- Local home prices are declining (-2.4%/yr); year-one equity from $1k of loan paydown is wiped out by about $4k of value loss. Plan a longer hold.
- Oxford County population projected at -21% by 2050 — secular population decline; favor cash flow + early exit over multi-decade hold.
Negotiation context
- It's been on market 34 days — a 3% lower offer ($170k) is reasonable based on typical stale-listing flexibility.
- 9 sale attempts since 19y ago with the ask held roughly flat each time — persistent listings suggest the price (not the market) is what's stuck; bring a comps-based counter.
Risks & watch-outs
- Watch-outs: built in 1934 — expect roof / HVAC / electrical / plumbing capex.
Questions for the listing agent
- It's been on market 34 days. Have you received any prior offers? Is the seller open to a 6% concession, seller financing, or rate buy-down credit?
- Built in 1934 — when were the roof, HVAC, electrical panel, plumbing, and water heater last replaced?
- Is there a deadline driving the sale (1031 exchange, divorce, estate, relocation)? That informs how much negotiation room exists.
- Schools are D-rated, which usually means shorter tenancies and higher turnover. Who's the typical renter profile here, and what's been the actual vacancy rate?
- What's the average days-on-market for RENTAL listings here right now (not sales)? A rising rental-DOM trend means longer vacancies and softer asking-rent achievability than the comps imply.
- What's the recent tenant-quality profile in this submarket — average credit score on applications, eviction rate, late-payment / NSF rate, and stable-employment percentage? A property-management company in the area should have these aggregated.
- How much new for-sale + rental construction is in the pipeline within 1–3 miles? Heavy new supply typically softens prices + rents 12–24 months out; constrained supply supports both.
Investment metrics
- 1% rule
- 0.94% ✗
- Cap rate
- 7.42%
- Cash-on-cash
- 4.03%
- DSCR
- 1.18
- GRM
- 8.8
CMA / ARV
- ARV (median comp)
- $175,886
- List price
- $174,900
- Delta
- -0.56%
- Verdict
- FAIR
- Comps
- 20 within 1.0 mi
Projected returns pro-forma
-2.39% appreciation · 3.0% rent growth · sell at horizon
- IRR
- -7.0%
- Equity multiple
- 0.73×
- Total profit
- $-13,379
- Equity at exit
- $30,860
- IRR
- 1.5%
- Equity multiple
- 1.12×
- Total profit
- $5,703
- Equity at exit
- $23,465
Cash invested: $48,972 (down + closing). Projections, not guarantees.
Landlord ↔ Tenant lean methodology
- Overall (STATE)
- 41 Moderately Tenant-Leaning
- State Maine
- 41 Moderately Tenant-Leaning · D+2
- County
- — inherits STATE
- City
- — inherits STATE
ZIP-level market 04257
- Home prices YoY
- -0.9%
- Active inventory
- 34
- Price-to-rent
- 8.8×
Monthly cashflow live
- Estimated rent
- $1,647 medium interval (Pro) →
- Mortgage (P&I)
- −$917
- Tax from tax record
- −$146 /mo · $1,757/yr
- Insurance
- −$73
- HOA
- −$0
- Vacancy / Maint / Mgmt
- −$346
- Net cashflow
- $165
Break-even live
UW: 25.0% down · 7.5% · 30yr · 1.5% tax · 5.0% vac · 8.0% maint · 8.0% mgmt
Financing live
Cash to close
- Down payment
- $43,725
- Closing costs
- $5,247
- Reserves months
- —
- Total cash needed
- —
Loan-product check · same deal, 3 products live
Conventional
25% down · 7.5% · 30yr
- Down + closing
- —
- Monthly P&I
- —
- Monthly cashflow
- —
- DSCR
- —
- Eligible?
- —
Personal DTI + credit; lowest rate.
DSCR
20% down · 8.5% · 30yr
- Down + closing
- —
- Monthly P&I
- —
- Monthly cashflow
- —
- DSCR
- —
- Eligible?
- —
No personal income docs; deal must DSCR.
Hard money
10% down · 12.0% · 12mo
- Down + closing
- —
- Monthly P&I
- —
- Monthly cashflow
- —
- DSCR
- —
- Eligible?
- —
Short-term bridge; refi at stabilization.
Listing history 22 events
-
2026-06-18days on market $174,900 Active 34 DOM
-
2026-06-17days on market $174,900 Active 33 DOM
-
2026-06-16days on market $174,900 Active 32 DOM
-
2026-06-15days on market $174,900 Active 31 DOM
-
2026-06-13days on market $174,900 Active 29 DOM
-
2026-06-12days on market $174,900 Active 28 DOM
-
2026-06-09days on market $174,900 Active 25 DOM
-
2026-06-08days on market $174,900 Active 24 DOM
-
2026-06-07days on market $174,900 Active 23 DOM
-
2026-06-07days on market $174,900 Active 22 DOM
-
2026-06-04days on market $174,900 Active 19 DOM
-
2026-06-02days on market $174,900 Active 18 DOM
-
2026-06-01days on market $174,900 Active 17 DOM
-
2026-05-31days on market $174,900 Active 16 DOM
-
2026-05-31days on market $174,900 Active 15 DOM
-
2026-05-15status Active 1211-char remark
-
2026-05-14historical 1211-char remark
-
2026-05-14$174,900 Active 1211-char remark
-
2023-09-08soldstatus $165,000 Closed 242-char remark
Show marketing remark (242 chars)
Looking for an affordable investment?! Look no further! This 3 family multi-unit is right in town and convenient to everything. Strong rental history, with all units occupied. Please allow 24 hours for showings. This property is broker owned.
-
2023-08-07status Pending 242-char remark
Show marketing remark (242 chars)
Looking for an affordable investment?! Look no further! This 3 family multi-unit is right in town and convenient to everything. Strong rental history, with all units occupied. Please allow 24 hours for showings. This property is broker owned.
-
2023-07-06price $165,000 242-char remark
Show marketing remark (242 chars)
Looking for an affordable investment?! Look no further! This 3 family multi-unit is right in town and convenient to everything. Strong rental history, with all units occupied. Please allow 24 hours for showings. This property is broker owned.
-
2023-04-01$169,500 Active 242-char remark
Show marketing remark (242 chars)
Looking for an affordable investment?! Look no further! This 3 family multi-unit is right in town and convenient to everything. Strong rental history, with all units occupied. Please allow 24 hours for showings. This property is broker owned.
ⓘ Source: listings_history table (triggers on properties + properties_extension) + one-shot
backfill from property_details.listing_events for pre-trigger history.
Tax reassessment forecast ME · Partial reset (capped growth)
- Current annual tax
- $1,757 · $146/mo
- Projected year-2 tax
- $2,068 · $172/mo
- Expected delta
- +$311/yr (+$26/mo · 17.7%)
ⓘ Screening estimate from a state-policy table — verify with the county assessor before closing.
Nearby sold comps map
Loading sold comps map…
Walkable amenities ~0.75 mi
Loading nearby amenities…
Taxation est. · year 1
- Rental income
- $19,764
- − Mortgage interest
- −$9,797
- − Property taxes
- −$1,757
- − Insurance
- −$874
- − Repairs & maintenance
- −$1,581
- − Management
- −$1,581
- − Depreciation
- −$5,088
- Taxable loss
- −$915
- Est. tax savings @ 24.0%
- +$220
- After-tax cash flow
- $2,195/yr
For passive investors: Depreciation is non-cash, so a rental often shows a tax loss while cash-flowing — sheltering income. Rental losses are passive: they offset passive income freely, and up to $25,000/yr can offset ordinary (W-2) income if you actively participate and your MAGI is under $100k (phasing out to $0 by $150k); unused losses carry forward. On sale, claimed depreciation is recaptured at up to 25%, and gains may owe capital-gains tax (a 1031 exchange can defer both). Figures are a year-1 estimate at your 24.0% rate — not tax advice; consult a CPA.
Schools (NCES district)
- District
- RSU 10
- NCES district ID
- 2314795
- Math proficiency
- 72% ▲ 50.00%
- Reading proficiency
- 79% ▲ 34.00%
- Median HH income
- $37,647
- Composite
- 62.72/100
- National rank
- #671
- State rank
- #107 of 112 in ME
Livability — Mexico
- Score
- 76/100
- State rank
- #35
- US rank
- #3803
Category grades
Schools grade is shown separately in the Schools card above.
Census & demographics
- Census place
- Mexico, ME
- Population (ZIP)
- 2,772
Population outlook (Oxford County) Hauer SSP2
- Today (2025)
- 55,853 people
- By 2030
- 54,190 · -3.0%
- By 2040
- 49,484 · -11.4%
- By 2050
- 43,958 · -21.3%
- By 2075
- 32,308 · -42.2%
- By 2100
- 21,858 · -60.9%
Race, ethnicity, and origin ACS 2023
- Neighborhood character
- Predominantly White (97%)
- Race & ethnicity
- White 97% Two or more races 2%
- Common ancestry
- Lithuanian 22% Italian 3% Slovak 3%
- Foreign-born
- 0% · Canada
- Languages at home
- 98% English-only · French/Haitian/Cajun 2%
Political lean MEDSL · Oxford
- 2024 margin
- R (+12.9) · D 42.7% · R 55.6% · Other 1.7%
- 2008→2024 swing
- -28.9pp toward R · 2008: 16.0pp · 2024: -12.9pp
- All cycles
- 2024: R+12.9 2020: R+8.8 2016: R+13.0 2012: D+14.9 2008: D+16.0
Not yet ingested
- Civics
- —
Market trends
- HPI YoY
- ▼ -2.39%
- Current HPI
- 263.5537
- Rent YoY
- —
- Metro
- —
- State GDP YoY
- —
- F500 in state
- 0
Price history
+113.3% since first listed18 events — show timeline
- 2026-05-15 Relisted — MREIS
- 2026-05-14 Delisted — MREIS
- 2026-05-14 Listed $174,900 MREIS
- 2023-09-08 Sold (MLS) $165,000 MREIS
- 2023-08-07 Pending — MREIS
- 2023-07-06 Price Changed $165,000 MREIS
- 2023-04-01 Listed $169,500 MREIS
- 2018-11-29 Delisted — MREIS
- 2018-06-20 Relisted — MREIS
- 2018-04-29 Delisted — MREIS
- 2017-10-24 Relisted — MREIS
- 2017-05-30 Pending — MREIS
- 2017-05-30 Relisted — MREIS
- 2017-04-29 Delisted — MREIS
- 2016-11-02 Listed $45,900 MREIS
- 2016-04-28 Delisted — MREIS
- 2015-05-09 Listed $45,900 MREIS
- 2007-07-30 Listed $82,000 MREIS
Property tax history
+1.2%/yrLatest (2024): $1,757 · -0.7% YoY. Source: county tax records.
Cash-flow waterfall
monthlySold comps — $/sqft
last 12 mo · ≤1 miLoading sold comps…