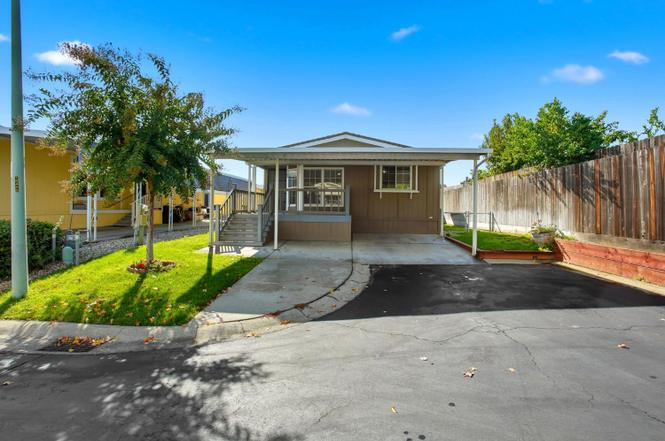
700 2nd St #40 · Galt, CA
Flood risk 1/10 · Minimal
- FEMA flood zone
- X (unshaded)
- Chance of flooding over 30 yrs
- 0.0%
- Est. flood insurance / yr
- $507 – $1,088
Fire risk 6/10 · Moderate
- Est. fire insurance / yr
- $659 – $1,223
Heat risk 7/10 · Major
- Hot days now (above 101°F)
- 7 days/yr
- Hot days in 30 yrs
- 14 days/yr
Wind risk 1/10 · Minimal
- Chance of severe wind over 30 yrs
- —
Air-quality risk 10/10 · Severe
- Unhealthy air days now
- 24 days/yr
- Unhealthy air days in 30 yrs
- 25 days/yr
Risk factors via First Street. Map © Google.
Why this score? — see what drove the B grade
The composite is a weighted blend of 9 inputs, each scored 0–100. Each bar is that input's sub-score; the figure is the points it added to the 100-point composite (weight × sub-score).
- Cash flow +30.0/30.0
- ARV discount +12.3/15.0
- DSCR +10.0/10.0
- 1% rule +8.1/10.0
- Schools +4.4/10.0
- Livability +2.9/5.0
- Rent growth +2.5/5.0
- Condition / age +2.5/5.0
- Appreciation +0.0/10.0
$165,000
🖨 Deal sheet 📄 Offer letter ✓ Due diligence
Listing remarks
Well-maintained 2-bedroom, 2-bath manufactured home offering approximately 1,248 sq. ft. of comfortable living space. Enjoy an open floor plan filled with natural light, a step-in pantry for convenient storage, and a front covered patio perfect for relaxing outdoors. A versatile shed adds extra storage options. Nestled at the end of a quiet cul-de-sac, this home provides privacy and a peaceful setting. Buyer to verify all information to their satisfaction.
Key facts
- Step-in pantry
- Open floor plan
- Quiet cul-de-sac
Tags
Property features AI
Finance
- Other: Directions provided to park location
- Financial info: Land lease: No (listed land lease amount field present but land lease indicated as No)
- HOA & community: No homeowners association; Senior community
Exterior
- Parking: Off-street parking; Attached parking; Covered parking; Boat storage; Guest parking available; No garage
- Utilities: Public water; Public sewer; Cable connected; 220 volts available in laundry
- Home design: Manufactured home in park; Double wide; Single-story (manufactured); Built in 1995; Composition roof; Skirted with wood; Manufacturer/Make: Skyline
- Construction: Composition roof; Wood skirting
- Exterior features: Storage and shed(s); Located on a court/cul-de-sac
Interior
- Kitchen: Free-standing refrigerator; Built-in gas range; Range hood; Dishwasher; Microwave; Garbage disposal; Breakfast area; Pantry closet
- Bedrooms: 2 bedrooms (including master bedroom)
- Flooring: Carpet; Linoleum
- Bathrooms: 2 full bathrooms; Tub with shower over; Shower stall(s)
- Heating & cooling: Central heating; Central air; Ceiling fan(s)
- Interior features: Cathedral ceiling; Covered deck, covered patio and porch; Storage area
- Laundry & utility: Laundry room with inside hookups only; 220V in laundry
Neighborhood map
What this means for you Summary
Snapshot
- This is a 2-bed/2.0-bath manufactured listed at $165k.
Deal economics
- At list price, monthly cash flow is $740 ($9k/yr) — positive.
- The deal already cash-flows at list — no discount required.
- Meets the 1% rule at list price ($2k rent vs $165k).
- Recommended offer: $145k (12.0% below list) — sets the bar for market timing.
- Cap rate 11.7% vs local median 3.3% in Galt — top-decile yield for the area; either an underpriced asset or a hidden risk that comps aren't pricing in. Stress-test before assuming the spread holds.
Location & tenants
- Location reads 57/100 on livability (#733 in CA) — a working-class tenant base; expect higher turnover. Strengths: housing A+, employment B; Watch: crime C-, schools D, amenities F.
- Galt Joint Union High (town): math 75% / reading 25% proficiency, ranked #137 of 517 in CA (top 26%) — acceptable for families but not a draw, mixed tenant base, ~2y average lease.
- Market conditions: 308 active listings in the ZIP; 2 comparable units currently listed for rent nearby; solid renter incomes; 6,825 units permitted in Sacramento County in 2024 (1,752 in 5+ unit buildings).
Forward outlook
- Local home prices are declining (-3.0%/yr); year-one equity from $1k of loan paydown is wiped out by about $5k of value loss. Plan a longer hold.
- Sacramento County population projected at +17% by 2050 — long-run rental-demand tailwind backs the buy-and-hold thesis.
- At projected returns (-3.0% appreciation + 3.0% rent growth), your $46k cash investment doubles in ~7 years — after that, you're playing with house money.
Negotiation context
- It's been on market 146 days — a 12% lower offer ($145k) is reasonable based on typical stale-listing flexibility.
Risks & watch-outs
- Climate carrying-cost: major wildfire risk; extreme-heat days projected 7→14/yr by 2055 (HVAC capex compounding) — expect insurance premiums to compound above CPI over the hold.
Questions for the listing agent
- It's been on market 146 days. Have you received any prior offers? Is the seller open to a 12% concession, seller financing, or rate buy-down credit?
- Why hasn't it sold? Are there any deal-killer items the seller is aware of (foundation, flood, title, zoning, code violations)?
- Is there a deadline driving the sale (1031 exchange, divorce, estate, relocation)? That informs how much negotiation room exists.
- Schools are D-rated, which usually means shorter tenancies and higher turnover. Who's the typical renter profile here, and what's been the actual vacancy rate?
- What's the average days-on-market for RENTAL listings here right now (not sales)? A rising rental-DOM trend means longer vacancies and softer asking-rent achievability than the comps imply.
- What's the recent tenant-quality profile in this submarket — average credit score on applications, eviction rate, late-payment / NSF rate, and stable-employment percentage? A property-management company in the area should have these aggregated.
- How much new for-sale + rental construction is in the pipeline within 1–3 miles? Heavy new supply typically softens prices + rents 12–24 months out; constrained supply supports both.
Investment metrics
- 1% rule
- 1.31% ✓
- Cap rate
- 11.68%
- Cash-on-cash
- 19.23%
- DSCR
- 1.86
- GRM
- 6.4
CMA / ARV
- ARV (on-the-fly)
- $184,704
- Comps found
- 2
Show comp detail 2 sales within ~0.75 mi
| Address | Dist | Beds/Ba | Sqft | Sold | Price | $/sf | Match |
|---|---|---|---|---|---|---|---|
| 700 2nd St #59 | 0.00mi | 2/2.0 | 1,344 (+8%) | 13mo | $154,000 | $115 | 76 |
| 700 2nd St #43 | 0.00mi | 2/2.0 | 1,152 (-8%) | 22mo | $170,000 | $148 | 69 |
Match score weights: distance 35% · size 25% · config 20% · recency 20%. Top-matched comps best support the ARV.
Projected returns pro-forma
-3.0% appreciation · 3.0% rent growth · sell at horizon
- IRR
- 11.1%
- Equity multiple
- 1.44×
- Total profit
- $20,335
- Equity at exit
- $24,602
- IRR
- 20.1%
- Equity multiple
- 2.69×
- Total profit
- $78,110
- Equity at exit
- $14,266
Cash invested: $46,200 (down + closing). Projections, not guarantees.
Landlord ↔ Tenant lean methodology
- Overall (STATE)
- 18 Strongly Tenant-Friendly
- State California
- 18 Strongly Tenant-Friendly · D+13
- County
- — inherits STATE
- City
- — inherits STATE
ZIP-level market 95632
- Active inventory
- 308
- Price-to-rent
- 6.4×
Monthly cashflow live
- Estimated rent
- $2,158 medium interval (Pro) →
- Mortgage (P&I)
- −$865
- Tax from tax record
- −$30 /mo · $364/yr
- Insurance
- −$69
- HOA
- −$0
- Vacancy / Maint / Mgmt
- −$453
- Net cashflow
- $740
Break-even live
UW: 25.0% down · 7.5% · 30yr · 1.5% tax · 5.0% vac · 8.0% maint · 8.0% mgmt
Financing live
Cash to close
- Down payment
- $41,250
- Closing costs
- $4,950
- Reserves months
- —
- Total cash needed
- —
Loan-product check · same deal, 3 products live
Conventional
25% down · 7.5% · 30yr
- Down + closing
- —
- Monthly P&I
- —
- Monthly cashflow
- —
- DSCR
- —
- Eligible?
- —
Personal DTI + credit; lowest rate.
DSCR
20% down · 8.5% · 30yr
- Down + closing
- —
- Monthly P&I
- —
- Monthly cashflow
- —
- DSCR
- —
- Eligible?
- —
No personal income docs; deal must DSCR.
Hard money
10% down · 12.0% · 12mo
- Down + closing
- —
- Monthly P&I
- —
- Monthly cashflow
- —
- DSCR
- —
- Eligible?
- —
Short-term bridge; refi at stabilization.
Rent comps 2 comps
| Address | Beds | Baths | Sqft | Rent | $/sqft | DOM | Units | Dist |
|---|---|---|---|---|---|---|---|---|
| 410 5th St Unit 1 Galt, CA | 2.0 | 1.5 | 900 | $1,895 | $2.11 | 2d | 1 | 0.41mi |
| 228 McFarland St Apt 6 Galt, CA | 2.0 | 1.0 | 700 | $1,640 | $2.34 | 2d | 1 | 0.81mi |
Listing history 13 events
-
2026-06-18days on market $165,000 Active 146 DOM
-
2026-06-17days on market $165,000 Active 145 DOM
-
2026-06-16days on market $165,000 Active 144 DOM
-
2026-06-15days on market $165,000 Active 143 DOM
-
2026-06-13days on market $165,000 Active 141 DOM
-
2026-06-13days on market $165,000 Active 140 DOM
-
2026-06-09days on market $165,000 Active 137 DOM
-
2026-06-08days on market $165,000 Active 136 DOM
-
2026-06-07pricedays on market $165,000 Active 135 DOM
-
2026-06-03days on market $179,000 Active 131 DOM
-
2026-06-02days on market $179,000 Active 130 DOM
-
2026-06-01days on market $179,000 Active 129 DOM
-
2026-05-31days on market $179,000 Active 128 DOM
ⓘ Source: listings_history table (triggers on properties + properties_extension) + one-shot
backfill from property_details.listing_events for pre-trigger history.
Tax reassessment forecast CA · Resets to sale price
- Current annual tax
- $364 · $30/mo
- Projected year-2 tax
- $1,254 · $104/mo
- Expected delta
- +$890/yr (+$74/mo · 244.5%)
ⓘ Screening estimate from a state-policy table — verify with the county assessor before closing.
Climate risk First Street
- Flood 1/10 Low FEMA zone X (unshaded) · 0% chance over 30 yrs
- Wildfire 6/10 Major
- Heat 7/10 Severe 7 d/yr ≥101°F today · 14 d/yr by 30 yrs out
- Wind 1/10 Low
- Air quality 10/10 Extreme 24 unhealthy d/yr today · 25 by 30 yrs out
Nearby sold comps map
Loading sold comps map…
Walkable amenities ~0.75 mi
Loading nearby amenities…
Taxation est. · year 1
- Rental income
- $25,893
- − Mortgage interest
- −$9,243
- − Property taxes
- −$364
- − Insurance
- −$825
- − Repairs & maintenance
- −$2,071
- − Management
- −$2,071
- − Depreciation
- −$4,800
- Taxable income
- $6,519
- Est. tax owed @ 24.0%
- −$1,564
- After-tax cash flow
- $7,319/yr
For passive investors: Depreciation is non-cash, so a rental often shows a tax loss while cash-flowing — sheltering income. Rental losses are passive: they offset passive income freely, and up to $25,000/yr can offset ordinary (W-2) income if you actively participate and your MAGI is under $100k (phasing out to $0 by $150k); unused losses carry forward. On sale, claimed depreciation is recaptured at up to 25%, and gains may owe capital-gains tax (a 1031 exchange can defer both). Figures are a year-1 estimate at your 24.0% rate — not tax advice; consult a CPA.
Schools (NCES district)
- District
- Galt Joint Union High
- NCES district ID
- 0614820
- Math proficiency
- 75% ▲ 48.00%
- Reading proficiency
- 25% ▼ -32.00%
- Median HH income
- $62,916
- Composite
- 44.24/100
- National rank
- #2844
- State rank
- #137 of 517 in CA
Livability — Galt
- Score
- 57/100
- State rank
- #733
- US rank
- #21603
Category grades
Schools grade is shown separately in the Schools card above.
Census & demographics
- Census place
- Galt, CA
- County
- Sacramento County · 1,539,646 people
- City population
- 32,493
- Metro
- Sacramento-Roseville-Folsom, CA
- Population (ZIP)
- 32,493
- Household income
- $102,239
- Rent vs Own
- Severe rent burden
- 476.0
Population outlook (Sacramento County) Hauer SSP2
- Today (2025)
- 1,660,763 people
- By 2030
- 1,732,990 · +4.3%
- By 2040
- 1,855,755 · +11.7%
- By 2050
- 1,941,335 · +16.9%
- By 2075
- 2,046,162 · +23.2%
- By 2100
- 1,961,444 · +18.1%
Race, ethnicity, and origin ACS 2023
- Neighborhood character
- Diverse neighborhood (Simpson 0.60)
- Race & ethnicity
- White 45% Hispanic / Latino 44% Two or more races 16% Asian 5% Native American 2% Black 2%
- Hispanic origin (detail)
- Mexican 42%
- Common ancestry
- Russian 4% Italian 2% Slovak 2%
- Foreign-born
- 19% · Canada, China, Vietnam
- Languages at home
- 63% English-only · Spanish 32% Other Indo-European 2% Other Asian/Pacific 1%
Political lean MEDSL · Sacramento
- 2024 margin
- D (+19.7) · D 58.1% · R 38.4% · Other 3.5%
- 2008→2024 swing
- +0.7pp no change · 2008: 19.0pp · 2024: 19.7pp
- All cycles
- 2024: D+19.7 2020: D+25.3 2016: D+23.7 2012: D+16.3 2008: D+19.0
Not yet ingested
- Civics
- —
Market trends
- HPI YoY
- ▼ -309.48%
- Current HPI
- 309.3197
- Rent YoY
- —
- Metro
- Sacramento-Roseville-Folsom, CA
- State GDP YoY
- ▲ 3.21%
- F500 in state
- 116
Industry mix (Fortune 500 HQ in CA)
| Industry | F500 HQs | Revenue |
|---|---|---|
| Technology | 27 | $1,492B |
|
||
| Financial Services | 3 | $174B |
|
||
| Retail | 3 | $44B |
|
||
| Insurance | 3 | $26B |
|
||
| Media / Entertainment | 2 | $115B |
|
||
| Pharmaceuticals / Biotech | 2 | $62B |
|
||
Property tax history
+1.3%/yrLatest (2025): $364 · +0.0% YoY. Source: county tax records.
Cash-flow waterfall
monthlySold comps — $/sqft
last 12 mo · ≤1 miLoading sold comps…