 Multi-family
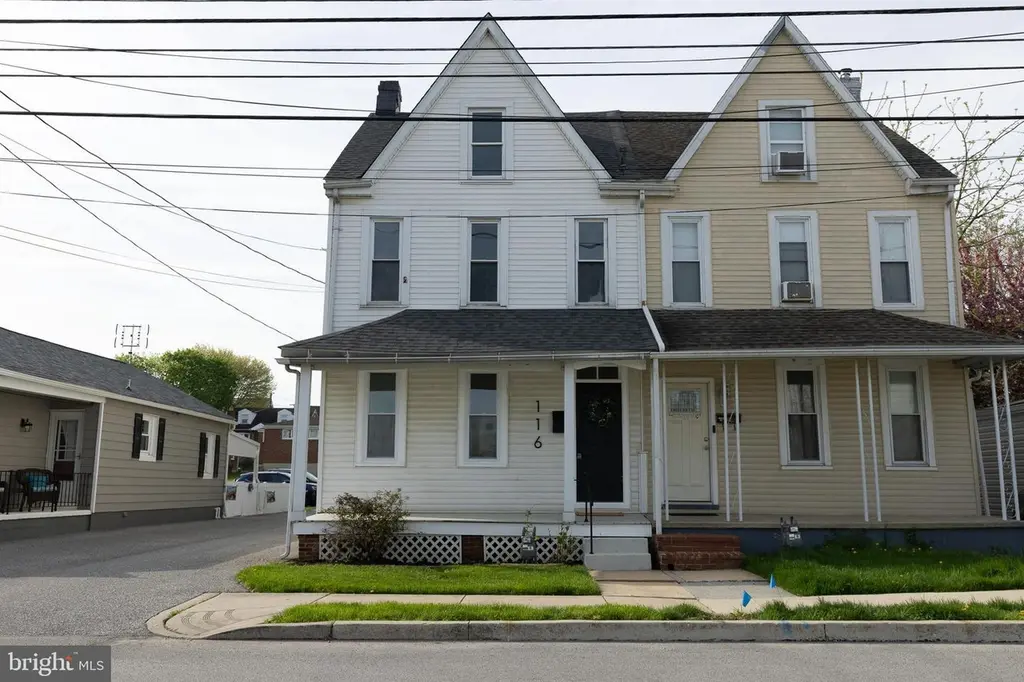
116 E 7th Ave · North York, PA
Flood risk 1/10 · Minimal
- FEMA flood zone
- X (unshaded)
- Chance of flooding over 30 yrs
- 0.0%
- Est. flood insurance / yr
- $473 – $860
Fire risk 1/10 · Minimal
- Est. fire insurance / yr
- $511 – $949
Heat risk 6/10 · Moderate
- Hot days now (above 103°F)
- 7 days/yr
- Hot days in 30 yrs
- 15 days/yr
Wind risk 4/10 · Minor
- Chance of severe wind over 30 yrs
- 10.0%
Air-quality risk 3/10 · Minor
- Unhealthy air days now
- 3 days/yr
- Unhealthy air days in 30 yrs
- 5 days/yr
Risk factors via First Street. Map © Google.
Why this score? — see what drove the C- grade
The composite is a weighted blend of 9 inputs, each scored 0–100. Each bar is that input's sub-score; the figure is the points it added to the 100-point composite (weight × sub-score).
- Cash flow +21.1/30.0
- ARV discount +7.5/15.0
- DSCR +6.7/10.0
- 1% rule +5.1/10.0
- Rent growth +4.1/5.0
- Schools +4.0/10.0
- Livability +3.6/5.0
- Condition / age +2.5/5.0
- Appreciation +0.0/10.0
$219,900
🖨 Deal sheet 📄 Offer letter ✓ Due diligence
Multi-family units
County records classify this as Multi-Family (2-4 Unit). Listing-text estimate: 1 unit. estimate disagrees with records
Listing remarks MLS
1/2 DUPLEX NORTH YORK BORO NEW SOFFIT & EXTERIOR WINDOW FRAMES WRAPPED OFF STREET PARKING FOR TWO CARS FENCED REAR YARD OWNER WILL CONSIDER FHA/VA GAS SPACE HEATER IN KITCHEN AUX. HEAT AHS WARRANTY INCLUDED |
Key facts
- Renovated
- New kitchen
- New heat system
Tags
Neighborhood map
What this means for you Summary
Snapshot
- This is a 3-bed/1.0-bath multifamily listed at $220k.
Deal economics
- At list price, monthly cash flow is $315 ($4k/yr) — positive.
- The deal already cash-flows at list — no discount required.
- Meets the 1% rule at list price ($2k rent vs $220k).
Location & tenants
- Location reads 71/100 on livability (#713 in PA) — a middle-class / working-renter tenant base. Strengths: crime A+, cost of living A+, housing A+; Watch: amenities D+, schools F, commute F.
- Central York SD (suburban): math 33% / reading 57% proficiency, ranked #244 of 539 in PA (top 45%) — families likely to look elsewhere, expect single-tenant / working-renter base with shorter leases.
- Market conditions: Rents rising fast (+6.4%/yr); 249 active listings in the ZIP; 33 comparable units currently listed for rent nearby; rentals leasing fast (median 14d on market — plan ~1-2 weeks tenant-placement turnaround); solid renter incomes; 1,328 units permitted in York County in 2024 (338 in 5+ unit buildings).
- This rent runs 34% of the median local income ($79k/yr) — at the standard rent-burdened threshold; future hikes will face affordability resistance.
Forward outlook
- Local home prices are declining (-3.0%/yr); year-one equity from $2k of loan paydown is wiped out by about $7k of value loss. Plan a longer hold.
- At projected returns (-3.0% appreciation + 6.4% rent growth), your $62k cash investment doubles in ~10 years — after that, you're playing with house money.
Negotiation context
- Only 3 days on market — expect competitive offers; lowballing is unlikely to land.
- 3 sale attempts since 26y ago with the ask held roughly flat each time — persistent listings suggest the price (not the market) is what's stuck; bring a comps-based counter.
- Current owner paid $60k; list at $220k implies a 266% gain — meaningful room to come down on a strong offer.
Risks & watch-outs
- Watch-outs: built in 1900 — expect roof / HVAC / electrical / plumbing capex.
- Climate carrying-cost: extreme-heat days projected 7→15/yr by 2055 (HVAC capex compounding) — expect insurance premiums to compound above CPI over the hold.
Questions for the listing agent
- Built in 1900 — when were the roof, HVAC, electrical panel, plumbing, and water heater last replaced?
- Is there a deadline driving the sale (1031 exchange, divorce, estate, relocation)? That informs how much negotiation room exists.
- Schools are F-rated, which usually means shorter tenancies and higher turnover. Who's the typical renter profile here, and what's been the actual vacancy rate?
- What's the average days-on-market for RENTAL listings here right now (not sales)? A rising rental-DOM trend means longer vacancies and softer asking-rent achievability than the comps imply.
- What's the recent tenant-quality profile in this submarket — average credit score on applications, eviction rate, late-payment / NSF rate, and stable-employment percentage? A property-management company in the area should have these aggregated.
- How much new apartment / multifamily construction is in the pipeline within 1–3 miles? Heavy new supply (>2% of stock underway) typically softens rents 12–24 months out; light construction supports rent growth.
Investment metrics
- 1% rule
- 1.01% ✓
- Cap rate
- 8.01%
- Cash-on-cash
- 6.15%
- DSCR
- 1.27
- GRM
- 8.3
CMA / ARV
No comps found within radius.
Projected returns pro-forma
-3.0% appreciation · 6.38% rent growth · sell at horizon
- IRR
- -3.3%
- Equity multiple
- 0.87×
- Total profit
- $-7,780
- Equity at exit
- $32,788
- IRR
- 9.8%
- Equity multiple
- 1.87×
- Total profit
- $53,271
- Equity at exit
- $19,013
Cash invested: $61,572 (down + closing). Projections, not guarantees.
Landlord ↔ Tenant lean methodology
- Overall (STATE)
- 62 Landlord-Friendly
- State Pennsylvania
- 62 Landlord-Friendly · EVEN
- County
- — inherits STATE
- City
- — inherits STATE
ZIP-level market 17404
- Rents YoY
- 6.4%
- Active inventory
- 249
- Price-to-rent
- 16.5×
Monthly cashflow live
- Estimated rent
- $2,215 high interval (Pro) →
- Mortgage (P&I)
- −$1,153
- Tax from tax record
- −$190 /mo · $2,276/yr
- Insurance
- −$92
- HOA
- −$0
- Vacancy / Maint / Mgmt
- −$465
- Net cashflow
- $315
Break-even live
2-unit breakdown (identical units grouped — click to expand)
| Units | Beds | Baths | Est. rent |
|---|---|---|---|
| 2× units | 2 | 1 | $2,214 |
| #1 | 2 | 1 | $1,107 |
| #2 | 2 | 1 | $1,107 |
| Total (2 units) | $2,215 | ||
UW: 25.0% down · 7.5% · 30yr · 1.5% tax · 5.0% vac · 8.0% maint · 8.0% mgmt
Financing live
Cash to close
- Down payment
- $54,975
- Closing costs
- $6,597
- Reserves months
- —
- Total cash needed
- —
Loan-product check · same deal, 3 products live
Conventional
25% down · 7.5% · 30yr
- Down + closing
- —
- Monthly P&I
- —
- Monthly cashflow
- —
- DSCR
- —
- Eligible?
- —
Personal DTI + credit; lowest rate.
DSCR
20% down · 8.5% · 30yr
- Down + closing
- —
- Monthly P&I
- —
- Monthly cashflow
- —
- DSCR
- —
- Eligible?
- —
No personal income docs; deal must DSCR.
Hard money
10% down · 12.0% · 12mo
- Down + closing
- —
- Monthly P&I
- —
- Monthly cashflow
- —
- DSCR
- —
- Eligible?
- —
Short-term bridge; refi at stabilization.
Rent comps 33 comps
| Address | Beds | Baths | Sqft | Rent | $/sqft | DOM | Units | Dist |
|---|---|---|---|---|---|---|---|---|
| 42 Laurel St York, PA | 3.0 | 1.0 | 1136 | $1,375 | $1.21 | 21d | 1 | 0.06mi |
| 1301 N Duke St York, PA | 2.0 | 1.5 | 1520 | $1,475 | $0.97 | 43d | 1 | 0.19mi |
| 113 Arch St York, PA | 4.0 | 1.0 | 1188 | $1,200 | $1.01 | 13d | 1 | 0.64mi |
| 334 N Beaver St York, PA | 3.0 | 1.0 | 1140 | $1,050 | $0.92 | 13d | 1 | 0.76mi |
| 251 N George St York, PA | 2.0 | 2.0 | 1100 | $1,595 | $1.45 | 13d | 1 | 0.80mi |
| 133 Stevens Ave York, PA | 3.0 | 1.0 | 1200 | $1,300 | $1.08 | 43d | 1 | 0.81mi |
| 428 Smith St York, PA | 3.0 | 1.0 | 1522 | $1,350 | $0.89 | 13d | 1 | 0.82mi |
| 2256 N Point Dr York, PA | 2.0 | 1.5 | 1200 | $1,650 | $1.38 | 43d | 1 | 0.83mi |
| 245 Franklin Way York, PA | 2.0 | 2.0 | 1240 | $1,150 | $0.93 | 13d | 1 | 0.85mi |
| 231 Franklin Way York, PA | 3.0 | 1.0 | 920 | $1,195 | $1.30 | 13d | 1 | 0.86mi |
| 446 Wallace St York, PA | 3.0 | 1.0 | 1092 | $1,295 | $1.19 | 21d | 1 | 0.90mi |
| 175 W Gay Ave York, PA | 1.0–2.0 | 1.0 | 1219 | $1,650 | $1.35 | 13d | 2 | 0.94mi |
| 289 Union St York, PA | 4.0 | 1.0 | 1450 | $1,600 | $1.10 | 43d | 1 | 0.95mi |
| 433 Piedmont Cir York, PA | 1.0–3.0 | 1.0–1.5 | 850 | $1,655 | $1.95 | 13d | 2 | 0.96mi |
| 433 Piedmont Cir York, PA | 3.0 | 1.5 | 1000 | $1,656 | $1.66 | 43d | 1 | 0.96mi |
| 631 Wallace St Unit 631 York, PA | 4.0 | 1.0 | 1545 | $1,325 | $0.86 | 13d | 1 | 0.96mi |
| 720 Chestnut St Apt 2 York, PA | 4.0 | 1.0 | 1400 | $1,300 | $0.93 | 13d | 1 | 1.00mi |
| 28 N George St Unit H York, PA | 2.0 | 2.0 | 1400 | $1,550 | $1.11 | 43d | 1 | 1.03mi |
| 339 E Market St Unit 1 York, PA | 4.0 | 1.5 | 1600 | $1,650 | $1.03 | 21d | 1 | 1.06mi |
| 314 W Gay Ave York, PA | 3.0 | 1.0 | 1060 | $1,250 | $1.18 | 21d | 1 | 1.09mi |
| 450 Madison Ave York, PA | 1.0–2.0 | 1.0 | 862 | $1,250 | $1.45 | 13d | 1 | 1.12mi |
| 720 Elm Ter York, PA | 3.0 | 1.5 | 1200 | $1,950 | $1.62 | 21d | 1 | 1.13mi |
| 30 N Franklin St York, PA | 3.0 | 1.0 | 1400 | $1,395 | $1.00 | 43d | 1 | 1.14mi |
| 216 Park Pl York, PA | 4.0 | 1.0 | 1192 | $1,350 | $1.13 | 13d | 1 | 1.15mi |
| 631 Roosevelt Ave Unit 2 York, PA | 3.0 | 1.0 | 1170 | $1,150 | $0.98 | 13d | 1 | 1.18mi |
| 231 Roosevelt Ave York, PA | 3.0 | 1.5 | 1584 | $1,750 | $1.10 | 13d | 1 | 1.19mi |
| 2220 N Susquehanna Trl York, PA | 1.0–3.0 | 1.0–2.0 | 1073 | $2,325 | $2.17 | 13d | 14 | 1.22mi |
| 40 N Tremont St #2 York, PA | 3.0 | 1.0 | 900 | $1,500 | $1.67 | 43d | 1 | 1.23mi |
| 132 S Beaver St Apt 4 York, PA | 2.0 | 2.0 | 1000 | $1,250 | $1.25 | 43d | 1 | 1.28mi |
| 1027 E Market St Unit 2 York, PA | 2.0 | 1.0 | 1145 | $1,095 | $0.96 | 13d | 1 | 1.37mi |
| 588 Company St York, PA | 3.0 | 1.5 | 1416 | $1,475 | $1.04 | 43d | 1 | 1.41mi |
| 208 Liberty Ct York, PA | 3.0 | 1.0 | 1096 | $1,195 | $1.09 | 43d | 1 | 1.43mi |
| 132 N West St York, PA | 4.0 | 1.0 | 1560 | $1,600 | $1.03 | 13d | 1 | 1.44mi |
Listing history 13 events
-
2026-05-26status Pending
-
2026-05-22soldstatus Closed
-
2026-04-27status Pending
-
2026-04-23historical Active Under Contract
-
2026-04-20$219,900 Active
-
2015-01-02soldstatus $60,000
-
2009-07-09historical
-
2009-01-08$99,900
-
2001-01-10soldstatus $60,000
-
2000-12-20soldstatus $60,000 214-char remark
Show marketing remark (214 chars)
1/2 DUPLEX NORTH YORK BORO NEW SOFFIT & EXTERIOR WINDOW FRAMES WRAPPED OFF STREET PARKING FOR TWO CARS FENCED REAR YARD OWNER WILL CONSIDER FHA/VA GAS SPACE HEATER IN KITCHEN AUX. HEAT AHS WARRANTY INCLUDED |
-
2000-11-08historical 214-char remark
Show marketing remark (214 chars)
1/2 DUPLEX NORTH YORK BORO NEW SOFFIT & EXTERIOR WINDOW FRAMES WRAPPED OFF STREET PARKING FOR TWO CARS FENCED REAR YARD OWNER WILL CONSIDER FHA/VA GAS SPACE HEATER IN KITCHEN AUX. HEAT AHS WARRANTY INCLUDED |
-
2000-10-12$58,900 214-char remark
Show marketing remark (214 chars)
1/2 DUPLEX NORTH YORK BORO NEW SOFFIT & EXTERIOR WINDOW FRAMES WRAPPED OFF STREET PARKING FOR TWO CARS FENCED REAR YARD OWNER WILL CONSIDER FHA/VA GAS SPACE HEATER IN KITCHEN AUX. HEAT AHS WARRANTY INCLUDED |
-
2000-04-10soldstatus $20,000
ⓘ Source: listings_history table (triggers on properties + properties_extension) + one-shot
backfill from property_details.listing_events for pre-trigger history.
Tax reassessment forecast PA · Partial reset (capped growth)
- Current annual tax
- $2,276 · $190/mo
- Projected year-2 tax
- $2,875 · $240/mo
- Expected delta
- +$599/yr (+$50/mo · 26.3%)
ⓘ Screening estimate from a state-policy table — verify with the county assessor before closing.
Climate risk First Street
- Flood 1/10 Low FEMA zone X (unshaded) · 0% chance over 30 yrs
- Wildfire 1/10 Low
- Heat 6/10 Major 7 d/yr ≥103°F today · 15 d/yr by 30 yrs out
- Wind 4/10 Moderate 10% chance of damaging wind over 30 yrs
- Air quality 3/10 Moderate 3 unhealthy d/yr today · 5 by 30 yrs out
Nearby sold comps map
Loading sold comps map…
Walkable amenities ~0.75 mi
Loading nearby amenities…
Taxation est. · year 1
- Rental income
- $26,580
- − Mortgage interest
- −$12,318
- − Property taxes
- −$2,276
- − Insurance
- −$1,100
- − Repairs & maintenance
- −$2,126
- − Management
- −$2,126
- − Depreciation
- −$6,397
- Taxable income
- $236
- Est. tax owed @ 24.0%
- −$57
- After-tax cash flow
- $3,727/yr
For passive investors: Depreciation is non-cash, so a rental often shows a tax loss while cash-flowing — sheltering income. Rental losses are passive: they offset passive income freely, and up to $25,000/yr can offset ordinary (W-2) income if you actively participate and your MAGI is under $100k (phasing out to $0 by $150k); unused losses carry forward. On sale, claimed depreciation is recaptured at up to 25%, and gains may owe capital-gains tax (a 1031 exchange can defer both). Figures are a year-1 estimate at your 24.0% rate — not tax advice; consult a CPA.
Schools (NCES district)
- District
- Central York SD
- NCES district ID
- 4205490
- Math proficiency
- 33% ▼ -2.00%
- Reading proficiency
- 57% ▼ -4.00%
- Median HH income
- $64,385
- Composite
- 39.92/100
- National rank
- #3849
- State rank
- #244 of 539 in PA
Livability — North York
- Score
- 71/100
- State rank
- #713
- US rank
- #7045
Category grades
Schools grade is shown separately in the Schools card above.
Census & demographics
- Census place
- North York, PA
- County
- York County · 278,806 people
- Metro
- York-Hanover, PA
- Population (ZIP)
- 39,374
- Household income
- $78,506
- Rent vs Own
- Severe rent burden
- 722.0
Population outlook (York County) Hauer SSP2
- Today (2025)
- 454,205 people
- By 2030
- 457,407 · +0.7%
- By 2040
- 457,529 · +0.7%
- By 2050
- 448,261 · -1.3%
- By 2075
- 427,388 · -5.9%
- By 2100
- 384,218 · -15.4%
Race, ethnicity, and origin ACS 2023
- Neighborhood character
- Majority White (65%)
- Race & ethnicity
- White 65% Hispanic / Latino 19% Black 12% Two or more races 8%
- Hispanic origin (detail)
- Mexican 2% Puerto Rican 9% Dominican 4%
- Common ancestry
- Romanian 2% Slovak 2% Lithuanian 1%
- Foreign-born
- 6% · Canada, Vietnam
- Languages at home
- 85% English-only · Spanish 12% Russian/Polish/Slavic 1%
Political lean MEDSL · York
- 2024 margin
- Strong R (+25.3) · D 36.9% · R 62.1%
- 2008→2024 swing
- -11.7pp toward R · 2008: -13.6pp · 2024: -25.3pp
- All cycles
- 2024: R+25.3 2020: R+24.6 2016: R+29.3 2012: R+21.2 2008: R+13.6
Not yet ingested
- Civics
- —
Market trends
- HPI YoY
- ▼ -135.44%
- Current HPI
- 237.5683
- Rent YoY
- ▲ 6.38%
- Metro
- York-Hanover, PA
- State GDP YoY
- ▲ 1.68%
- F500 in state
- 34
Industry mix (Fortune 500 HQ in PA)
| Industry | F500 HQs | Revenue |
|---|---|---|
| Healthcare | 2 | $309B |
|
||
| Insurance | 2 | $27B |
|
||
| Telecommunications / Media | 1 | $124B |
|
||
| Industrial Distribution | 1 | $22B |
|
||
| Financial Services | 1 | $20B |
|
||
| Chemicals / Materials | 1 | $18B |
|
||
Price history
+999.5% since first listed13 events — show timeline
- 2026-05-26 Pending — BRIGHT MLS
- 2026-05-22 Sold (MLS) — BRIGHT MLS
- 2026-04-27 Pending — BRIGHT MLS
- 2026-04-23 Contingent — BRIGHT MLS
- 2026-04-20 Listed $219,900 BRIGHT MLS
- 2015-01-02 Sold (Public Records) $60,000 Public Records
- 2009-07-09 Listing Removed — BRIGHT MLS
- 2009-01-08 Listed $99,900 BRIGHT MLS
- 2001-01-10 Sold (Public Records) $60,000 Public Records
- 2000-12-20 Sold (MLS) $60,000 BRIGHT MLS
- 2000-11-08 Listing Removed — BRIGHT MLS
- 2000-10-12 Listed $58,900 BRIGHT MLS
- 2000-04-10 Sold (Public Records) $20,000 Public Records
Property tax history
+2.6%/yrLatest (2025): $2,276 · +2.4% YoY. Source: county tax records.
Cash-flow waterfall
monthlySold comps — $/sqft
last 12 mo · ≤1 miLoading sold comps…