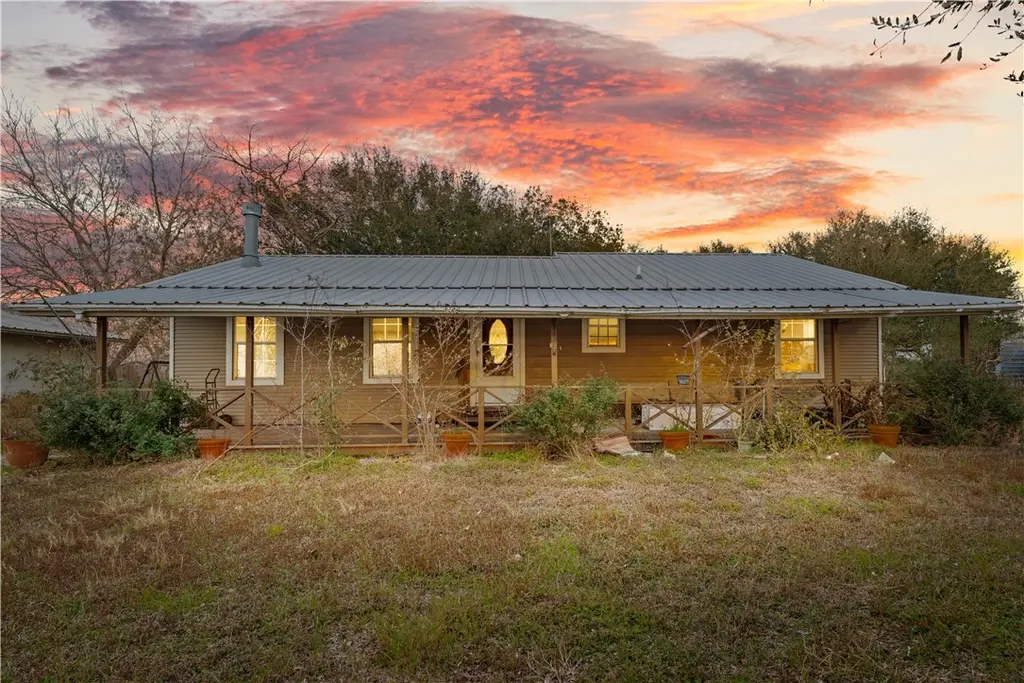
8086 Fm 631 · Taft, TX
Flood risk No data
- FEMA flood zone
- —
- Chance of flooding over 30 yrs
- —
- Est. flood insurance / yr
- —
Fire risk No data
- Est. fire insurance / yr
- —
Heat risk No data
- Hot days now (above threshold)
- —
- Hot days in 30 yrs
- —
Wind risk No data
- Chance of severe wind over 30 yrs
- —
Air-quality risk No data
- Unhealthy air days now
- —
- Unhealthy air days in 30 yrs
- —
Risk factors via First Street. Map © Google.
Why this score? — see what drove the C grade
The composite is a weighted blend of 9 inputs, each scored 0–100. Each bar is that input's sub-score; the figure is the points it added to the 100-point composite (weight × sub-score).
- Cash flow +19.6/30.0
- ARV discount +7.5/15.0
- Appreciation +7.2/10.0
- DSCR +6.2/10.0
- 1% rule +4.9/10.0
- Livability +3.2/5.0
- Rent growth +2.5/5.0
- Condition / age +2.5/5.0
- Schools +2.0/10.0
$174,900
🖨 Deal sheet 📄 Offer letter ✓ Due diligence
Listing remarks
Nestled on 5 acres in Taft, Texas, this 3-bedroom, 2-bathroom home offers 1,568 square feet of space, privacy, and untapped potential. Surrounded by mature trees and open pasture, this property delivers the kind of quiet country setting that’s increasingly hard to find. The home features a durable metal roof, covered front porch, and a practical layout ready for your vision. Inside, you’ll find a functional floor plan with spacious living areas and generously sized bedrooms. While the home will require updates and improvements, it provides a solid starting point for renovation, investment, or customization. The property also includes a detached garage and additional outbuildings
Key facts
- Covered front porch
- Open pasture
- Metal roof
Tags
Property features AI
Exterior
- Parking: Front entry; 2-car garage; Gravel parking
- Security: Smoke detectors
- Utilities: Public water available; Separate meters
- Home design: Single-story; Pillar/post/pier foundation; Metal roof; HardiPlank, vinyl and wood siding
- Construction: Built with HardiPlank, vinyl and wood siding; Metal roof; Pillar/post/pier foundation
- Exterior features: Storage; Partially wooded lot; Landscaped areas; Farm-to-market road frontage; Caliche road surface
Interior
- Kitchen: Dishwasher; Electric cooktop
- Flooring: Carpet; Laminate; Vinyl
- Bathrooms: 2 full bathrooms
- Heating & cooling: Central heating (electric); Central air conditioning
- Interior features: Air filtration; Wood-burning fireplace
- Laundry & utility: Washer hookup; Dryer hookup
Neighborhood map
What this means for you Summary
Snapshot
- This is a 3-bed/2.0-bath single-family listed at $175k.
Deal economics
- At list price, monthly cash flow is $201 ($2k/yr) — positive.
- The deal already cash-flows at list — no discount required.
- To meet the 1% rule (rent ≥ 1% of price), the offer needs to be $173k (1.3% below list).
- Recommended offer: $172k (1.5% below list) — sets the bar for market timing.
Location & tenants
- Location reads 65/100 on livability (#673 in TX) — a middle-class / working-renter tenant base. Strengths: crime A+, cost of living A+, housing A+; Watch: schools F, amenities F, commute F.
- Taft ISD (town): math 24% / reading 24% proficiency, ranked #727 of 826 in TX (top 88%) — low school quality limits family demand, transient renter base, plan for 1-2y turnover; 77% free/reduced lunch — lower-income household profile, screen leases tightly.
- Market conditions: 60 active listings in the ZIP; 344 units permitted in San Patricio County in 2024 (0 in 5+ unit buildings).
Forward outlook
- In year one you build about $9k of equity ($1k loan paydown + $8k appreciation (4.4% local appreciation)).
- San Patricio County population projected at +27% by 2050 — long-run rental-demand tailwind backs the buy-and-hold thesis.
- At projected returns (4.4% appreciation + 3.0% rent growth), your $49k cash investment doubles in ~4 years — after that, you're playing with house money.
- By year 4, paydown + projected appreciation supports a ~$30k cash-out refi (75% LTV) — recoverable capital for the next deal without selling this one.
Negotiation context
- It's been on market 21 days — a 2% lower offer ($172k) is reasonable based on typical stale-listing flexibility.
- 2 sale attempts with the ask held roughly flat each time — persistent listings suggest the price (not the market) is what's stuck; bring a comps-based counter.
Questions for the listing agent
- Is there a deadline driving the sale (1031 exchange, divorce, estate, relocation)? That informs how much negotiation room exists.
- Schools are F-rated, which usually means shorter tenancies and higher turnover. Who's the typical renter profile here, and what's been the actual vacancy rate?
- What's the average days-on-market for RENTAL listings here right now (not sales)? A rising rental-DOM trend means longer vacancies and softer asking-rent achievability than the comps imply.
- What's the recent tenant-quality profile in this submarket — average credit score on applications, eviction rate, late-payment / NSF rate, and stable-employment percentage? A property-management company in the area should have these aggregated.
- How much new for-sale + rental construction is in the pipeline within 1–3 miles? Heavy new supply typically softens prices + rents 12–24 months out; constrained supply supports both.
Investment metrics
- 1% rule
- 0.99% ✗
- Cap rate
- 7.67%
- Cash-on-cash
- 4.93%
- DSCR
- 1.22
- GRM
- 8.4
CMA / ARV
No comps found within radius.
Projected returns pro-forma
4.44% appreciation · 3.0% rent growth · sell at horizon
- IRR
- 15.7%
- Equity multiple
- 1.97×
- Total profit
- $47,564
- Equity at exit
- $93,186
- IRR
- 16.5%
- Equity multiple
- 3.77×
- Total profit
- $135,537
- Equity at exit
- $156,125
Cash invested: $48,972 (down + closing). Projections, not guarantees.
Landlord ↔ Tenant lean methodology
- Overall (STATE)
- 87 Strongly Landlord-Friendly
- State Texas
- 87 Strongly Landlord-Friendly · R+5
- County
- — inherits STATE
- City
- — inherits STATE
ZIP-level market 78390
- Home prices YoY
- 3.7%
- Active inventory
- 60
- Price-to-rent
- 8.4×
Monthly cashflow live
- Estimated rent
- $1,726 medium interval (Pro) →
- Mortgage (P&I)
- −$917
- Tax from tax record
- −$172 /mo · $2,064/yr
- Insurance
- −$73
- HOA
- −$0
- Vacancy / Maint / Mgmt
- −$362
- Net cashflow
- $201
Break-even live
UW: 25.0% down · 7.5% · 30yr · 1.5% tax · 5.0% vac · 8.0% maint · 8.0% mgmt
Financing live
Cash to close
- Down payment
- $43,725
- Closing costs
- $5,247
- Reserves months
- —
- Total cash needed
- —
Loan-product check · same deal, 3 products live
Conventional
25% down · 7.5% · 30yr
- Down + closing
- —
- Monthly P&I
- —
- Monthly cashflow
- —
- DSCR
- —
- Eligible?
- —
Personal DTI + credit; lowest rate.
DSCR
20% down · 8.5% · 30yr
- Down + closing
- —
- Monthly P&I
- —
- Monthly cashflow
- —
- DSCR
- —
- Eligible?
- —
No personal income docs; deal must DSCR.
Hard money
10% down · 12.0% · 12mo
- Down + closing
- —
- Monthly P&I
- —
- Monthly cashflow
- —
- DSCR
- —
- Eligible?
- —
Short-term bridge; refi at stabilization.
Listing history 21 events
-
2026-06-18days on market $174,900 Active 21 DOM
-
2026-06-17days on market $174,900 Active 20 DOM
-
2026-06-16days on market $174,900 Active 19 DOM
-
2026-06-15days on market $174,900 Active 18 DOM
-
2026-06-14days on market $174,900 Active 16 DOM
-
2026-06-13days on market $174,900 Active 15 DOM
-
2026-06-10days on market $174,900 Active 13 DOM
-
2026-06-09days on market $174,900 Active 12 DOM
-
2026-06-08days on market $174,900 Active 11 DOM
-
2026-06-07days on market $174,900 Active 10 DOM
-
2026-06-05days on market $174,900 Active 7 DOM
-
2026-06-03days on market $174,900 Active 6 DOM
-
2026-06-02days on market $174,900 Active 5 DOM
-
2026-06-01days on market $174,900 Active 4 DOM
-
2026-05-31days on market $174,900 Active 3 DOM
-
2026-05-30days on market $174,900 Active 2 DOM
-
2026-05-15status Pending
-
2026-05-05historical
-
2026-05-04$174,900 Active
-
2026-04-08price $174,900
-
2026-03-02$180,000 Active
ⓘ Source: listings_history table (triggers on properties + properties_extension) + one-shot
backfill from property_details.listing_events for pre-trigger history.
Tax reassessment forecast TX · Resets to sale price
- Current annual tax
- $2,064 · $172/mo
- Projected year-2 tax
- $3,201 · $267/mo
- Expected delta
- +$1,137/yr (+$95/mo · 55.1%)
ⓘ Screening estimate from a state-policy table — verify with the county assessor before closing.
Nearby sold comps map
Loading sold comps map…
Walkable amenities ~0.75 mi
Loading nearby amenities…
Taxation est. · year 1
- Rental income
- $20,710
- − Mortgage interest
- −$9,797
- − Property taxes
- −$2,064
- − Insurance
- −$874
- − Repairs & maintenance
- −$1,657
- − Management
- −$1,657
- − Depreciation
- −$5,088
- Taxable loss
- −$427
- Est. tax savings @ 24.0%
- +$102
- After-tax cash flow
- $2,519/yr
For passive investors: Depreciation is non-cash, so a rental often shows a tax loss while cash-flowing — sheltering income. Rental losses are passive: they offset passive income freely, and up to $25,000/yr can offset ordinary (W-2) income if you actively participate and your MAGI is under $100k (phasing out to $0 by $150k); unused losses carry forward. On sale, claimed depreciation is recaptured at up to 25%, and gains may owe capital-gains tax (a 1031 exchange can defer both). Figures are a year-1 estimate at your 24.0% rate — not tax advice; consult a CPA.
Schools (NCES district)
- District
- Taft ISD
- NCES district ID
- 4842060
- Math proficiency
- 24% ▼ -6.00%
- Reading proficiency
- 24% ▲ 2.00%
- Median HH income
- $40,110
- Composite
- 20.29/100
- National rank
- #8618
- State rank
- #727 of 826 in TX
Livability — Taft
- Score
- 65/100
- State rank
- #673
- US rank
- #12651
Category grades
Schools grade is shown separately in the Schools card above.
Census & demographics
- Population (ZIP)
- 5,620
Population outlook (San Patricio County) Hauer SSP2
- Today (2025)
- 75,538 people
- By 2030
- 79,575 · +5.3%
- By 2040
- 87,670 · +16.1%
- By 2050
- 96,107 · +27.2%
- By 2075
- 117,984 · +56.2%
- By 2100
- 130,010 · +72.1%
Race, ethnicity, and origin ACS 2023
- Neighborhood character
- Predominantly Hispanic (78%)
- Race & ethnicity
- Hispanic / Latino 78% Two or more races 52% White 21%
- Hispanic origin (detail)
- Mexican 75%
- Common ancestry
- Slovak 1% Lithuanian 1%
- Foreign-born
- 3% · Canada
- Languages at home
- 61% English-only · Spanish 39%
Political lean MEDSL · San Patricio
- 2024 margin
- Solid R (+36.4) · D 31.4% · R 67.8%
- 2008→2024 swing
- -19.8pp toward R · 2008: -16.6pp · 2024: -36.4pp
- All cycles
- 2024: R+36.4 2020: R+29.1 2016: R+24.1 2012: R+20.6 2008: R+16.6
Not yet ingested
- Civics
- —
Market trends
- HPI YoY
- ▲ 4.44%
- Current HPI
- 123.4461
- Rent YoY
- —
- Metro
- —
- State GDP YoY
- ▲ 3.95%
- F500 in state
- 110
Industry mix (Fortune 500 HQ in TX)
| Industry | F500 HQs | Revenue |
|---|---|---|
| Energy | 16 | $1,198B |
|
||
| Technology | 5 | $198B |
|
||
| Engineering / Construction | 4 | $72B |
|
||
| Energy Services | 3 | $60B |
|
||
| Utilities | 3 | $41B |
|
||
| Healthcare | 2 | $330B |
|
||
Price history
-2.8% since first listed5 events — show timeline
- 2026-05-15 Pending — CBMLS
- 2026-05-05 Delisted — CBMLS
- 2026-05-04 Listed $174,900 CBMLS
- 2026-04-08 Price Changed $174,900 CBMLS
- 2026-03-02 Listed $180,000 CBMLS
Property tax history
-2.2%/yrLatest (2025): $2,064 · -25.0% YoY. Source: county tax records.
Cash-flow waterfall
monthlySold comps — $/sqft
last 12 mo · ≤1 miLoading sold comps…