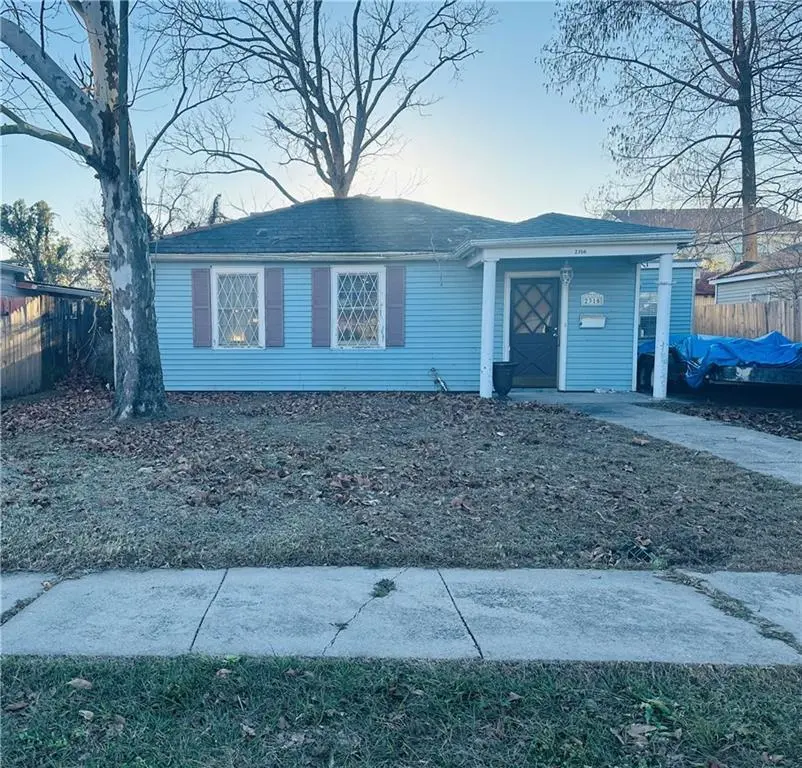
2316 Hero St · Gretna, LA
Flood risk No data
- FEMA flood zone
- —
- Chance of flooding over 30 yrs
- —
- Est. flood insurance / yr
- —
Fire risk No data
- Est. fire insurance / yr
- —
Heat risk No data
- Hot days now (above threshold)
- —
- Hot days in 30 yrs
- —
Wind risk No data
- Chance of severe wind over 30 yrs
- —
Air-quality risk No data
- Unhealthy air days now
- —
- Unhealthy air days in 30 yrs
- —
Risk factors via First Street. Map © Google.
Why this score? — see what drove the B- grade
The composite is a weighted blend of 9 inputs, each scored 0–100. Each bar is that input's sub-score; the figure is the points it added to the 100-point composite (weight × sub-score).
- Cash flow +30.0/30.0
- 1% rule +10.0/10.0
- DSCR +10.0/10.0
- ARV discount +7.5/15.0
- Livability +3.5/5.0
- Rent growth +2.5/5.0
- Schools +2.5/10.0
- Condition / age +2.5/5.0
- Appreciation +0.0/10.0
$50,000
🖨 Deal sheet 📄 Offer letter ✓ Due diligence
Listing remarks MLS
Attention Investors/Renovators: 3Bedroom/1Bath single-family property requiring a full renovation. Electrical, water, and gas are off. Property is being sold as-is; seller will make no repairs. A signed Hold Harmless form (attached) must be submitted to the listing agent prior to showings.
Key facts
- Parking
- Built 1962
- Listed 129 days
Neighborhood map
What this means for you Summary
Snapshot
- This is a 3-bed/1.5-bath single-family listed at $50k.
Deal economics
- At list price, monthly cash flow is $985 ($12k/yr) — positive.
- The deal already cash-flows at list — no discount required.
- Meets the 1% rule at list price ($2k rent vs $50k).
- Recommended offer: $44k (12.0% below list) — sets the bar for market timing.
- Cap rate 29.9% vs local median 5.1% in Gretna — top-decile yield for the area; either an underpriced asset or a hidden risk that comps aren't pricing in. Stress-test before assuming the spread holds.
Location & tenants
- Location reads 70/100 on livability (#58 in LA) — a middle-class / working-renter tenant base. Strengths: cost of living A+, health & safety A+, schools B+; Watch: crime F, employment D-.
- Jefferson Parish (suburban): math 24% / reading 34% proficiency, ranked #44 of 98 in LA (top 45%) — low school quality limits family demand, transient renter base, plan for 1-2y turnover; 70% free/reduced lunch — lower-income household profile, screen leases tightly.
- Market conditions: 113 active listings in the ZIP; 40 comparable units currently listed for rent nearby; rentals at typical pace (median 24d on market — plan ~3-4 weeks tenant-placement turnaround); 40% of comp listings sitting > 30 days — soft ceiling on asking rent; lower-income renter base — watch delinquency; 518 units permitted in Jefferson Parish in 2024 (43 in 5+ unit buildings).
- At $1,677/mo this rent would consume 50% of the median local household income ($40k/yr) (locally 1911% of renters already pay >50% of income on rent) — very limited rent-growth headroom before tenants either downsize or default.
Forward outlook
- Local home prices are declining (-3.0%/yr); year-one equity from $346 of loan paydown is wiped out by about $2k of value loss. Plan a longer hold.
- At projected returns (-3.0% appreciation + 3.0% rent growth), your $14k cash investment doubles in ~2 years — after that, you're playing with house money.
Negotiation context
- It's been on market 129 days — a 12% lower offer ($44k) is reasonable based on typical stale-listing flexibility.
- 4 sale attempts since 4y ago; this cycle's ask has dropped $4k (7%) from the opening price — seller is motivated, your offer sets the floor, not the list.
Questions for the listing agent
- It's been on market 129 days. Have you received any prior offers? Is the seller open to a 12% concession, seller financing, or rate buy-down credit?
- Built in 1962 — when were the roof, HVAC, electrical panel, plumbing, and water heater last replaced?
- Why hasn't it sold? Are there any deal-killer items the seller is aware of (foundation, flood, title, zoning, code violations)?
- Is there a deadline driving the sale (1031 exchange, divorce, estate, relocation)? That informs how much negotiation room exists.
- Schools are B-rated — typically a magnet for longer-tenancy family renters. What's the average tenant stay here, and is there a school-zone premium baked into asking?
- Crime grade is F in this area — have there been break-ins, vandalism, or insurance claims at this property in the last 3 years? What carrier currently insures it and at what premium?
- What's the average days-on-market for RENTAL listings here right now (not sales)? A rising rental-DOM trend means longer vacancies and softer asking-rent achievability than the comps imply.
- What's the recent tenant-quality profile in this submarket — average credit score on applications, eviction rate, late-payment / NSF rate, and stable-employment percentage? A property-management company in the area should have these aggregated.
- How much new for-sale + rental construction is in the pipeline within 1–3 miles? Heavy new supply typically softens prices + rents 12–24 months out; constrained supply supports both.
Investment metrics
- 1% rule
- 3.35% ✓
- Cap rate
- 29.94%
- Cash-on-cash
- 84.44%
- DSCR
- 4.76
- GRM
- 2.5
CMA / ARV
- ARV (median comp)
- $197,546
- List price
- $50,000
- Delta
- -74.69%
- Verdict
- UNDERPRICED
- Comps
- 20 within 1.0 mi
Show comp detail 12 sales within ~0.75 mi
| Address | Dist | Beds/Ba | Sqft | Sold | Price | $/sf | Match |
|---|---|---|---|---|---|---|---|
| 2444 Huey P. Long Ave | 0.26mi | 3/2.0 | 1,266 (-1%) | 1mo | $239,000 | $189 | 83 |
| 2035 Huey P. Long Ave | 0.34mi | 3/2.0 | 1,266 (-1%) | 1mo | $235,000 | $186 | 79 |
| 2442 Huey P Long Ave | 0.26mi | 3/2.0 | 1,266 (-1%) | 8mo | $195,000 | $154 | 78 |
| 1061 Price Dr | 0.64mi | 3/1.5 | 1,312 (+2%) | 6mo | $170,000 | $130 | 61 |
| 1105 Beechwood Dr | 0.51mi | 3/2.0 | 1,370 (+7%) | 3mo | $229,000 | $167 | 60 |
| 1020 Beechwood Dr | 0.60mi | 3/2.0 | 1,212 (-5%) | 3mo | $150,000 | $124 | 59 |
| 1077 Marvin Ct | 0.69mi | 3/1.5 | 1,320 (+3%) | 6mo | $199,900 | $151 | 58 |
| 3144 Claire Ave | 0.71mi | 3/1.0 | 1,323 (+3%) | 4mo | $134,830 | $102 | 56 |
| 1048 Price Dr | 0.66mi | 3/1.5 | 1,372 (+7%) | 12mo | $182,000 | $133 | 47 |
| 1312 Maplewood Dr | 0.68mi | 4/1.5 (+1) | 1,331 (+4%) | 13mo | $199,000 | $150 | 46 |
| 1309 Dogwood Dr | 0.70mi | 3/2.0 | 1,377 (+8%) | 13mo | $183,000 | $133 | 42 |
| 3037 Hero Dr | 0.57mi | 3/1.0 | 1,097 (-14%) | 13mo | $167,000 | $152 | 37 |
Match score weights: distance 35% · size 25% · config 20% · recency 20%. Top-matched comps best support the ARV.
Projected returns pro-forma
-3.0% appreciation · 3.0% rent growth · sell at horizon
- IRR
- 84.9%
- Equity multiple
- 4.90×
- Total profit
- $54,666
- Equity at exit
- $7,455
- IRR
- 88.1%
- Equity multiple
- 10.18×
- Total profit
- $128,486
- Equity at exit
- $4,323
Cash invested: $14,000 (down + closing). Projections, not guarantees.
Landlord ↔ Tenant lean methodology
- Overall (STATE)
- 90 Strongly Landlord-Friendly
- State Louisiana
- 90 Strongly Landlord-Friendly · R+12
- County
- — inherits STATE
- City
- — inherits STATE
ZIP-level market 70053
- Active inventory
- 113
- Price-to-rent
- 2.5×
Monthly cashflow live
- Estimated rent
- $1,677 high interval (Pro) →
- Mortgage (P&I)
- −$262
- Tax from tax record
- −$57 /mo · $679/yr
- Insurance
- −$21
- HOA
- −$0
- Vacancy / Maint / Mgmt
- −$352
- Net cashflow
- $985
Break-even live
UW: 25.0% down · 7.5% · 30yr · 1.5% tax · 5.0% vac · 8.0% maint · 8.0% mgmt
Financing live
Cash to close
- Down payment
- $12,500
- Closing costs
- $1,500
- Reserves months
- —
- Total cash needed
- —
Loan-product check · same deal, 3 products live
Conventional
25% down · 7.5% · 30yr
- Down + closing
- —
- Monthly P&I
- —
- Monthly cashflow
- —
- DSCR
- —
- Eligible?
- —
Personal DTI + credit; lowest rate.
DSCR
20% down · 8.5% · 30yr
- Down + closing
- —
- Monthly P&I
- —
- Monthly cashflow
- —
- DSCR
- —
- Eligible?
- —
No personal income docs; deal must DSCR.
Hard money
10% down · 12.0% · 12mo
- Down + closing
- —
- Monthly P&I
- —
- Monthly cashflow
- —
- DSCR
- —
- Eligible?
- —
Short-term bridge; refi at stabilization.
Rent comps 40 comps
| Address | Beds | Baths | Sqft | Rent | $/sqft | DOM | Units | Dist |
|---|---|---|---|---|---|---|---|---|
| 2504 Claire Ave Gretna, LA | 2.0 | 2.0 | 1032 | $1,600 | $1.55 | 43d | 1 | 0.13mi |
| 2310 Stafford St Gretna, LA | 4.0 | 2.0 | 1530 | $2,050 | $1.34 | 23d | 1 | 0.16mi |
| 9 Gerard Ct Gretna, LA | 3.0 | 1.5 | 1550 | $1,600 | $1.03 | 43d | 1 | 0.19mi |
| 1124 Tallow Tree Ln #20 Harvey, LA | 2.0 | 1.5 | 1020 | $1,150 | $1.13 | 3d | 1 | 0.20mi |
| 1013 Manhattan Blvd Harvey, LA | 1.0–2.0 | 1.0–1.5 | 837 | $1,789 | $2.14 | 1d | 10 | 0.35mi |
| 1157 Beechwood Dr Harvey, LA | 2.0 | 2.0 | 1219 | $1,600 | $1.31 | 23d | 1 | 0.47mi |
| 1145 Warren Dr Harvey, LA | 4.0 | 2.0 | 1315 | $1,750 | $1.33 | 4d | 1 | 0.57mi |
| 2205 Argyll St Harvey, LA | 3.0 | 2.0 | 1100 | $1,750 | $1.59 | 21d | 1 | 0.81mi |
| 1104 Huey P Long Ave Gretna, LA | 2.0 | 1.0 | 1140 | $1,800 | $1.58 | 23d | 1 | 0.84mi |
| 1029 Dolhonde St Gretna, LA | 2.0 | 1.0 | 1100 | $1,600 | $1.45 | 43d | 1 | 0.85mi |
| 1122 10th St Gretna, LA | 2.0 | 1.0 | 973 | $1,700 | $1.75 | 4d | 1 | 0.86mi |
| 1840 Mathis Ave Harvey, LA | 3.0 | 2.0 | 1200 | $1,800 | $1.50 | 43d | 1 | 0.92mi |
| 2407 Florence St Harvey, LA | 2.0 | 2.0 | 945 | $1,700 | $1.80 | 23d | 1 | 0.92mi |
| 1204 Amelia St Gretna, LA | 2.0 | 1.0 | 950 | $1,250 | $1.32 | 14d | 1 | 0.93mi |
| 822 Gulf Dr Gretna, LA | 2.0 | 1.0 | 900 | $1,300 | $1.44 | 14d | 1 | 0.96mi |
| 1499 Central Park Blvd Harvey, LA | 1.0–3.0 | 1.0–2.0 | 1002 | $2,195 | $2.19 | 3d | 18 | 0.98mi |
| 1117 Whitney Ave Gretna, LA | 1.0–3.0 | 1.0–2.0 | 951 | $1,489 | $1.57 | 2d | 16 | 1.03mi |
| 532 Chalmette St Harvey, LA | 3.0 | 1.0 | 1224 | $1,450 | $1.18 | 3d | 1 | 1.06mi |
| 700 Derbigny St Gretna, LA | 2.0 | 1.5 | 1064 | $1,300 | $1.22 | 23d | 1 | 1.07mi |
| 1784 Carol Sue Ave Gretna, LA | 1.0–3.0 | 1.0–1.5 | 850 | $1,035 | $1.22 | 43d | 1 | 1.09mi |
| 1625 Cooper Rd Unit D Terrytown, LA | 2.0 | 1.5 | 1200 | $1,300 | $1.08 | 43d | 1 | 1.13mi |
| 2201 Manhattan Blvd Harvey, LA | 1.0–2.0 | 1.0–2.0 | 780 | $1,349 | $1.73 | 1d | 27 | 1.13mi |
| 1629 Cooper Rd Unit B Terrytown, LA | 2.0 | 1.5 | 1200 | $1,300 | $1.08 | 43d | 1 | 1.13mi |
| 1629 Gary Ct Unit B Terrytown, LA | 2.0 | 1.5 | 1200 | $1,300 | $1.08 | 43d | 1 | 1.16mi |
| 1645 Dogwood Dr Harvey, LA | 4.0 | 1.0 | 1185 | $1,800 | $1.52 | 23d | 1 | 1.19mi |
| 23 New England Ct Gretna, LA | 3.0 | 1.5 | 1200 | $1,600 | $1.33 | 23d | 1 | 1.21mi |
| 1511a Kings Rd Harvey, LA | 2.0 | 1.5 | 1000 | $1,600 | $1.60 | 43d | 1 | 1.21mi |
| 2110 Willow St Unit C Harvey, LA | 2.0 | 1.0 | 975 | $1,155 | $1.18 | 43d | 1 | 1.22mi |
| 433 Olive Ave Harvey, LA | 3.0 | 1.0 | 1104 | $1,600 | $1.45 | 23d | 1 | 1.23mi |
| 429 Olive Ave Harvey, LA | 3.0 | 1.0 | 1067 | $1,500 | $1.41 | 23d | 1 | 1.23mi |
| 1661 Alexander Ct Gretna, LA | 2.0 | 1.5 | 1350 | $1,295 | $0.96 | 43d | 1 | 1.24mi |
| 1665 Alexander Ct Gretna, LA | 2.0 | 1.5 | 1350 | $1,295 | $0.96 | 43d | 1 | 1.25mi |
| 1849 Redwood Dr Harvey, LA | 3.0 | 2.0 | 1600 | $1,900 | $1.19 | 23d | 1 | 1.26mi |
| 1849 Redwood Dr Harvey, LA | 3.0 | 2.0 | 1600 | $1,900 | $1.19 | 43d | 1 | 1.26mi |
| 612 Fried St Gretna, LA | 3.0 | 2.0 | 1250 | $1,600 | $1.28 | 43d | 1 | 1.30mi |
| 2331 Justin Ln Unit Justin Harvey, LA | 2.0 | 1.5 | 1384 | $1,552 | $1.12 | 43d | 1 | 1.30mi |
| 1805 Redwood Dr Harvey, LA | 3.0 | 2.0 | 1270 | $1,850 | $1.46 | 21d | 1 | 1.30mi |
| 601 4th St Unit D Gretna, LA | 2.0 | 1.0 | 987 | $1,250 | $1.27 | 43d | 1 | 1.31mi |
| 526 Brown Ave Harvey, LA | 2.0 | 1.0 | 903 | $1,350 | $1.50 | 23d | 1 | 1.33mi |
| 2700 Whitney Ave Harvey, LA | 3.0 | 1.0–2.0 | 844 | $1,538 | $1.82 | 2d | 11 | 1.40mi |
Listing history 22 events
-
2026-06-18days on market $50,000 Active 129 DOM
-
2026-06-17days on market $50,000 Active 128 DOM
-
2026-06-16days on market $50,000 Active 127 DOM
-
2026-06-15days on market $50,000 Active 126 DOM
-
2026-06-13days on market $50,000 Active 124 DOM
-
2026-06-10days on market $50,000 Active 121 DOM
-
2026-06-09days on market $50,000 Active 120 DOM
-
2026-06-08days on market $50,000 Active 119 DOM
-
2026-06-07days on market $50,000 Active 118 DOM
-
2026-06-03days on market $50,000 Active 114 DOM
-
2026-06-02days on market $50,000 Active 113 DOM
-
2026-06-01pricedays on market $50,000 Active 112 DOM
-
2026-05-31days on market $54,000 Active 111 DOM
-
2026-02-08$54,000 Active 290-char remark
Show marketing remark (290 chars)
Attention Investors/Renovators: 3Bedroom/1Bath single-family property requiring a full renovation. Electrical, water, and gas are off. Property is being sold as-is; seller will make no repairs. A signed Hold Harmless form (attached) must be submitted to the listing agent prior to showings.
-
2023-01-27soldstatus $52,000
-
2022-04-06soldstatus $50,000
-
2022-04-05soldstatus $50,000 Closed
-
2022-03-14status Pending
-
2022-03-08$60,000 Active
-
2022-03-08$60,000
-
1995-11-01soldstatus
ⓘ Source: listings_history table (triggers on properties + properties_extension) + one-shot
backfill from property_details.listing_events for pre-trigger history.
Tax reassessment forecast LA · Resets to sale price
- Current annual tax
- $679 · $57/mo
- Projected year-2 tax
- $679 · $57/mo
- Expected delta
- $0/yr ($0/mo · 0.0%)
ⓘ Screening estimate from a state-policy table — verify with the county assessor before closing.
Nearby sold comps map
Loading sold comps map…
Walkable amenities ~0.75 mi
Loading nearby amenities…
Taxation est. · year 1
- Rental income
- $20,123
- − Mortgage interest
- −$2,801
- − Property taxes
- −$679
- − Insurance
- −$250
- − Repairs & maintenance
- −$1,610
- − Management
- −$1,610
- − Depreciation
- −$1,455
- Taxable income
- $11,719
- Est. tax owed @ 24.0%
- −$2,813
- After-tax cash flow
- $9,009/yr
For passive investors: Depreciation is non-cash, so a rental often shows a tax loss while cash-flowing — sheltering income. Rental losses are passive: they offset passive income freely, and up to $25,000/yr can offset ordinary (W-2) income if you actively participate and your MAGI is under $100k (phasing out to $0 by $150k); unused losses carry forward. On sale, claimed depreciation is recaptured at up to 25%, and gains may owe capital-gains tax (a 1031 exchange can defer both). Figures are a year-1 estimate at your 24.0% rate — not tax advice; consult a CPA.
Schools (NCES district)
- District
- Jefferson Parish
- NCES district ID
- 2200840
- Math proficiency
- 24% ▼ -36.00%
- Reading proficiency
- 34% ▼ -30.00%
- Median HH income
- $48,421
- Composite
- 25.19/100
- National rank
- #7511
- State rank
- #44 of 98 in LA
Livability — Gretna
- Score
- 70/100
- State rank
- #58
- US rank
- #7679
Category grades
Schools grade is shown separately in the Schools card above.
Census & demographics
- Census place
- Gretna, LA
- County
- Jefferson Parish · 426,999 people
- City population
- 56,969
- Metro
- New Orleans-Metairie, LA
- Population (ZIP)
- 16,621
- Household income
- $39,950
- Rent vs Own
- Severe rent burden
- 1911.0
Population outlook (Jefferson County) Hauer SSP2
- Today (2025)
- 451,696 people
- By 2030
- 455,451 · +0.8%
- By 2040
- 458,308 · +1.5%
- By 2050
- 461,031 · +2.1%
- By 2075
- 476,351 · +5.5%
- By 2100
- 499,377 · +10.6%
Race, ethnicity, and origin ACS 2023
- Neighborhood character
- Diverse neighborhood (Simpson 0.70)
- Race & ethnicity
- White 36% Black 34% Hispanic / Latino 23% Two or more races 15% Asian 2%
- Hispanic origin (detail)
- Mexican 4% Cuban 2%
- Common ancestry
- Lithuanian 7% Iranian 1% Slovak 1%
- Foreign-born
- 19% · Canada, Vietnam, China
- Languages at home
- 76% English-only · Spanish 20% Vietnamese 1% German/W. Germanic 1%
Political lean MEDSL · Jefferson
- 2024 margin
- R (+12.9) · D 42.5% · R 55.5% · Other 2.1%
- 2008→2024 swing
- +13.6pp toward D · 2008: -26.6pp · 2024: -12.9pp
- All cycles
- 2024: R+12.9 2020: R+11.1 2016: R+14.8 2012: R+18.4 2008: R+26.6
Not yet ingested
- Civics
- —
Market trends
- HPI YoY
- ▼ -115.90%
- Current HPI
- 121.765
- Rent YoY
- —
- Metro
- New Orleans-Metairie, LA
- State GDP YoY
- ▲ 3.29%
- F500 in state
- 10
Industry mix (Fortune 500 HQ in LA)
| Industry | F500 HQs | Revenue |
|---|---|---|
| Telecommunications | 2 | $23B |
|
||
| Utilities | 1 | $12B |
|
||
| Wholesale / Distribution | 1 | $5B |
|
||
| Advertising | 1 | $2B |
|
||
Price history
-10.0% since first listed9 events — show timeline
- 2026-02-08 Listed $54,000 AcadianaMLS
- 2026-02-08 Listed $54,000 GSREIN
- 2023-01-27 Sold (Public Records) $52,000 Public Records
- 2022-04-06 Sold (Public Records) $50,000 Public Records
- 2022-04-05 Sold (MLS) $50,000 GSREIN
- 2022-03-14 Pending — GSREIN
- 2022-03-08 Listed $60,000 AcadianaMLS
- 2022-03-08 Listed $60,000 GSREIN
- 1995-11-01 Sold (Public Records) — Public Records
Property tax history
-4.5%/yrLatest (2025): $679 · -0.2% YoY. Source: county tax records.
Cash-flow waterfall
monthlySold comps — $/sqft
last 12 mo · ≤1 miLoading sold comps…