17050 NE 14th Ave #110 · North Miami Beach, FL
Flood risk 7/10 · Major
- FEMA flood zone
- X (shaded)
- Chance of flooding over 30 yrs
- 0.74%
- Est. flood insurance / yr
- $507 – $1,088
Fire risk 1/10 · Minimal
- Est. fire insurance / yr
- $947 – $1,759
Heat risk 10/10 · Severe
- Hot days now (above 104°F)
- 7 days/yr
- Hot days in 30 yrs
- 29 days/yr
Wind risk 10/10 · Severe
- Chance of severe wind over 30 yrs
- 99.0%
Air-quality risk 2/10 · Minimal
- Unhealthy air days now
- 1 days/yr
- Unhealthy air days in 30 yrs
- 2 days/yr
Risk factors via First Street. Map © Google.
Why this score? — see what drove the D+ grade
The composite is a weighted blend of 9 inputs, each scored 0–100. Each bar is that input's sub-score; the figure is the points it added to the 100-point composite (weight × sub-score).
- Cash flow +15.0/30.0
- ARV discount +7.5/15.0
- 1% rule +5.0/10.0
- DSCR +5.0/10.0
- Schools +4.2/10.0
- Livability +4.1/5.0
- Condition / age +2.5/5.0
- Rent growth +2.1/5.0
- Appreciation +0.0/10.0
$65,000
🖨 Deal sheet 📄 Offer letter ✓ Due diligence
Listing remarks
Welcome to this well-maintained first-floor condo located in a convenient and centrally located community in Miami. This inviting unit offers a comfortable layout with easy access and a relaxed South Florida lifestyle. Step inside to find a bright living and dining area with a functional flow, perfect for everyday living. The kitchen provides ample cabinet and counter space, making meal preparation simple and efficient. The bedroom is generously sized with good closet space, while the bathroom is well-appointed for convenience. Being on the first floor, this unit offers added accessibility and ease, along with quick access to parking and community amenities. Enjoy a peaceful setting with ne
Key facts
- $675 HOA
- 2 parking spots
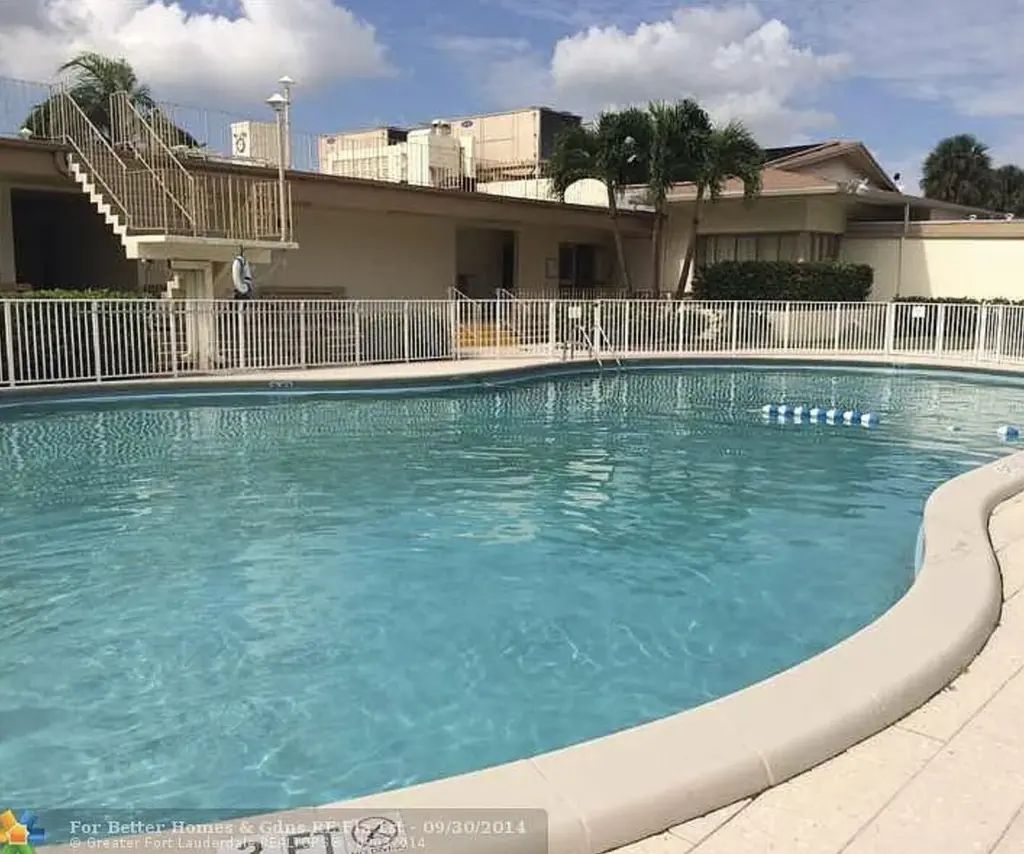
- Community pool
Property features AI
Finance
- Other: Senior community
- Financial info: Not a land lease community; Allows pets (restrictions may apply)
- HOA & community: Community pool; Clubhouse; Fitness center; Billiard room; Picnic area; Community room; Maintenance provided; Monthly association fee (HOA) of 675
Exterior
- Parking: Assigned parking plus guest parking (2 total spaces)
- Security: Security fence; Entry phone/intercom
- Utilities: Public water; Public sewer; Electricity connected; Water connected; Sewer connected; Cable available
- Home design: Stock cooperative; One-level living; First-floor entry; Faces west; Three-story building total
- Construction: Block construction; Other roof
- Exterior features: Screened porch; Open porch; Fenced
Interior
- Kitchen: Electric range; Refrigerator; Electric water heater
- Bedrooms: One bedroom on the main level
- Flooring: Carpet; Laminate; Tile
- Bathrooms: One full bathroom on the main level
- Heating & cooling: Heating available (window/wall units and other); Ceiling fan(s); Wall/window unit(s) for cooling
- Interior features: Updated/remodeled resale unit; Unfurnished; Security fence and entry intercom system
- Laundry & utility: Common area laundry
Neighborhood map
What this means for you Summary
Snapshot
- This is a 1-bed/1.0-bath condo listed at $65k.
Deal economics
- At list price, monthly cash flow is $1k ($16k/yr) — positive.
- The deal already cash-flows at list — no discount required.
- Meets the 1% rule at list price ($3k rent vs $65k).
- Recommended offer: $63k (3.0% below list) — sets the bar for market timing.
- Cap rate 32.0% vs local median 5.2% in North Miami Beach — top-decile yield for the area; either an underpriced asset or a hidden risk that comps aren't pricing in. Stress-test before assuming the spread holds.
Location & tenants
- Location reads 82/100 on livability (#71 in FL, #1,177 nationally) — a professional / high-income tenant draw. Strengths: commute A+, housing A+, health & safety A+; Watch: employment D+, crime F.
- Miami-Dade (suburban): math 45% / reading 54% proficiency, ranked #40 of 73 in FL (top 55%) — families likely to look elsewhere, expect single-tenant / working-renter base with shorter leases; 64% free/reduced lunch — lower-income household profile, screen leases tightly.
- Zoned schools: Greynolds Park Elementary School (math 39% / reading 40%, grade F, #1,513 of 2,144 statewide, top 73%, 527 students, 74% FRL); John F. Kennedy Middle School (math 47% / reading 55%, grade C, #237 of 571 statewide, top 43%, 1,074 students, 67% FRL); North Miami Beach Senior High (math 13% / reading 24%, grade F, #568 of 667 statewide, top 85%, 1,149 students, 66% FRL).
- Zoned-school proficiency averages 36% at this address vs 50% district-wide (-13 pts) — the specific schools serving this property underperform the Miami-Dade average; the district grade overstates school quality for this exact location.
- Market conditions: Rents soft (-1.6%/yr); 284 active listings in the ZIP; 10,051 units permitted in Miami-Dade County in 2024 (7,758 in 5+ unit buildings).
Forward outlook
- Local home prices are declining (-3.0%/yr); year-one equity from $449 of loan paydown is wiped out by about $2k of value loss. Plan a longer hold.
- Miami-Dade County population projected at +28% by 2050 — long-run rental-demand tailwind backs the buy-and-hold thesis.
- At projected returns (-3.0% appreciation + 0.0% rent growth), your $18k cash investment doubles in ~2 years — after that, you're playing with house money.
Negotiation context
- It's been on market 49 days — a 3% lower offer ($63k) is reasonable based on typical stale-listing flexibility.
- 7 sale attempts since 12y ago with the ask held roughly flat each time — persistent listings suggest the price (not the market) is what's stuck; bring a comps-based counter.
Risks & watch-outs
- Watch-outs: flood insurance adds $66/mo; HOA is 21% of rent.
- Climate carrying-cost: major flood risk; severe wind risk, 99% chance of damaging wind over 30y; extreme-heat days projected 7→29/yr by 2055 (HVAC capex compounding) — expect insurance premiums to compound above CPI over the hold.
Questions for the listing agent
- It's been on market 49 days. Have you received any prior offers? Is the seller open to a 3% concession, seller financing, or rate buy-down credit?
- Built in 1964 — when were the roof, HVAC, electrical panel, plumbing, and water heater last replaced?
- What's the actual annual flood-insurance premium (NFIP or private), and is the property in a SFHA with mandatory coverage?
- What does the HOA fee cover, when was the last increase, and are there any pending special assessments or reserve-fund shortfalls?
- Any open or pending special assessments — roof, HVAC, plumbing, elevator, façade? What's the per-unit balance and payoff schedule, and is the seller paying it off at close or rolling it to the buyer?
- Is there a deadline driving the sale (1031 exchange, divorce, estate, relocation)? That informs how much negotiation room exists.
- Crime grade is F in this area — have there been break-ins, vandalism, or insurance claims at this property in the last 3 years? What carrier currently insures it and at what premium?
- The area grade is low — what's the realistic commute time and amenity access for the typical tenant pool here? Any planned neighborhood developments (good or bad) we should know about?
- What's the average days-on-market for RENTAL listings here right now (not sales)? A rising rental-DOM trend means longer vacancies and softer asking-rent achievability than the comps imply.
- What's the recent tenant-quality profile in this submarket — average credit score on applications, eviction rate, late-payment / NSF rate, and stable-employment percentage? A property-management company in the area should have these aggregated.
- How much new apartment / multifamily construction is in the pipeline within 1–3 miles? Heavy new supply (>2% of stock underway) typically softens rents 12–24 months out; light construction supports rent growth.
Investment metrics
- 1% rule
- 4.90% ✓
- Cap rate
- 31.99%
- Cash-on-cash
- 91.79%
- DSCR
- 5.08
- GRM
- 1.7
CMA / ARV
No comps found within radius.
Projected returns pro-forma
-3.0% appreciation · 0.0% rent growth · sell at horizon
- IRR
- 83.3%
- Equity multiple
- 4.58×
- Total profit
- $65,067
- Equity at exit
- $9,692
- IRR
- 85.6%
- Equity multiple
- 8.22×
- Total profit
- $131,350
- Equity at exit
- $5,620
Cash invested: $18,200 (down + closing). Projections, not guarantees.
Landlord ↔ Tenant lean methodology
- Overall (STATE)
- 87 Strongly Landlord-Friendly
- State Florida
- 87 Strongly Landlord-Friendly · R+3
- County
- — inherits STATE
- City
- — inherits STATE
ZIP-level market 33162
- Rents YoY
- -1.6%
- Active inventory
- 284
- Price-to-rent
- 1.7×
Monthly cashflow live
- Estimated rent
- $3,185 medium interval (Pro) →
- Mortgage (P&I)
- −$341
- Tax est. 1.5%
- −$81 /mo · $975/yr
- Insurance
- −$27
- Flood insurance flood zone
- −$66 /mo · $798/yr
- HOA
- −$675
- Vacancy / Maint / Mgmt
- −$669
- Net cashflow
- $1,326
Break-even live
UW: 25.0% down · 7.5% · 30yr · 1.5% tax · 5.0% vac · 8.0% maint · 8.0% mgmt
Financing live
Cash to close
- Down payment
- $16,250
- Closing costs
- $1,950
- Reserves months
- —
- Total cash needed
- —
Loan-product check · same deal, 3 products live
Conventional
25% down · 7.5% · 30yr
- Down + closing
- —
- Monthly P&I
- —
- Monthly cashflow
- —
- DSCR
- —
- Eligible?
- —
Personal DTI + credit; lowest rate.
DSCR
20% down · 8.5% · 30yr
- Down + closing
- —
- Monthly P&I
- —
- Monthly cashflow
- —
- DSCR
- —
- Eligible?
- —
No personal income docs; deal must DSCR.
Hard money
10% down · 12.0% · 12mo
- Down + closing
- —
- Monthly P&I
- —
- Monthly cashflow
- —
- DSCR
- —
- Eligible?
- —
Short-term bridge; refi at stabilization.
HOA detail condo
- Monthly dues
- $675 · $8,100/yr
- Assessments
- None detected in remarks — confirm with the listing agent.
Listing history 28 events
-
2026-06-18days on market $65,000 Active 49 DOM
-
2026-06-17days on market $65,000 Active 48 DOM
-
2026-06-16days on market $65,000 Active 47 DOM
-
2026-06-15days on market $65,000 Active 46 DOM
-
2026-06-13days on market $65,000 Active 44 DOM
-
2026-06-09days on market $65,000 Active 40 DOM
-
2026-06-08days on market $65,000 Active 39 DOM
-
2026-06-07days on market $65,000 Active 38 DOM
-
2026-06-04days on market $65,000 Active 35 DOM
-
2026-06-03days on market $65,000 Active 34 DOM
-
2026-06-02days on market $65,000 Active 33 DOM
-
2026-06-01days on market $65,000 Active 32 DOM
-
2026-05-31days on market $65,000 Active 31 DOM
-
2026-04-30$65,000 Active
-
2026-03-24historical
-
2025-10-16$67,000 Active
-
2025-10-16historical
-
2025-04-30$100,000
-
2021-10-18soldstatus $69,000 Closed
-
2021-09-17historical Active Under Contract
-
2021-08-17price $71,500
-
2021-07-07status Active
-
2021-06-02status Pending
-
2021-05-18$72,000 Active
-
2016-02-10soldstatus $50,000
-
2015-12-28$55,000
-
2015-09-15soldstatus $46,000
-
2014-03-25$50,000
ⓘ Source: listings_history table (triggers on properties + properties_extension) + one-shot
backfill from property_details.listing_events for pre-trigger history.
Climate risk First Street
- Flood 7/10 Severe FEMA zone X (shaded) · 74% chance over 30 yrs
- Wildfire 1/10 Low
- Heat 10/10 Extreme 7 d/yr ≥104°F today · 29 d/yr by 30 yrs out
- Wind 10/10 Extreme 99% chance of damaging wind over 30 yrs
- Air quality 2/10 Low 1 unhealthy d/yr today · 2 by 30 yrs out
Nearby sold comps map
Loading sold comps map…
Walkable amenities ~0.75 mi
Loading nearby amenities…
Taxation est. · year 1
- Rental income
- $38,222
- − Mortgage interest
- −$3,641
- − Property taxes
- −$975
- − Insurance
- −$1,122
- − Repairs & maintenance
- −$3,058
- − Management
- −$3,058
- − HOA
- −$8,100
- − Depreciation
- −$1,891
- Taxable income
- $16,377
- Est. tax owed @ 24.0%
- −$3,931
- After-tax cash flow
- $11,977/yr
For passive investors: Depreciation is non-cash, so a rental often shows a tax loss while cash-flowing — sheltering income. Rental losses are passive: they offset passive income freely, and up to $25,000/yr can offset ordinary (W-2) income if you actively participate and your MAGI is under $100k (phasing out to $0 by $150k); unused losses carry forward. On sale, claimed depreciation is recaptured at up to 25%, and gains may owe capital-gains tax (a 1031 exchange can defer both). Figures are a year-1 estimate at your 24.0% rate — not tax advice; consult a CPA.
Schools (NCES district)
- District
- Miami-Dade
- NCES district ID
- 1200390
- Math proficiency
- 45% ▼ -16.00%
- Reading proficiency
- 54% ▼ -5.00%
- Median HH income
- $43,928
- Composite
- 41.76/100
- National rank
- #3397
- State rank
- #40 of 73 in FL
Livability — North Miami Beach
- Score
- 82/100
- State rank
- #71
- US rank
- #1177
Category grades
Schools grade is shown separately in the Schools card above.
Census & demographics
- County
- Miami-Dade County · 2,697,751 people
- City population
- 90,324
- Metro
- Miami-Fort Lauderdale-Pompano Beach, FL
- Population (ZIP)
- 46,606
- Household income
- $60,692
- Rent vs Own
- Severe rent burden
- 2509.0
Population outlook (Miami-Dade County) Hauer SSP2
- Today (2025)
- 3,126,439 people
- By 2030
- 3,325,765 · +6.4%
- By 2040
- 3,697,561 · +18.3%
- By 2050
- 4,012,134 · +28.3%
- By 2075
- 4,605,612 · +47.3%
- By 2100
- 4,866,598 · +55.7%
Race, ethnicity, and origin ACS 2023
- Neighborhood character
- Diverse neighborhood (Simpson 0.62)
- Race & ethnicity
- Black 53% Hispanic / Latino 30% Two or more races 15% White 12% Asian 2%
- Hispanic origin (detail)
- Puerto Rican 4% Cuban 7% Dominican 3%
- Common ancestry
- Hispanic 31% Romanian 1% Scotch-Irish 1%
- Foreign-born
- 52% · Canada, Jamaica, Dominican Republic
- Languages at home
- 29% English-only · French/Haitian/Cajun 35% Spanish 30% Other Indo-European 2%
Political lean MEDSL · Miami-Dade
- 2024 margin
- R (+11.4) · D 43.9% · R 55.4%
- 2008→2024 swing
- -27.6pp toward R · 2008: 16.1pp · 2024: -11.4pp
- All cycles
- 2024: R+11.4 2020: D+7.3 2016: D+29.6 2012: D+23.7 2008: D+16.1
Not yet ingested
- Civics
- —
Market trends
- HPI YoY
- ▼ -445.57%
- Current HPI
- 596.6178
- Rent YoY
- ▼ -1.59%
- Metro
- Miami-Fort Lauderdale-Pompano Beach, FL
- State GDP YoY
- ▲ 3.28%
- F500 in state
- 36
Industry mix (Fortune 500 HQ in FL)
| Industry | F500 HQs | Revenue |
|---|---|---|
| Industrial Technology | 2 | $29B |
|
||
| Insurance | 2 | $17B |
|
||
| Retail | 1 | $60B |
|
||
| Technology Distribution | 1 | $58B |
|
||
| Homebuilding | 1 | $35B |
|
||
| Technology Manufacturing | 1 | $35B |
|
||
Price history
+30.0% since first listed15 events — show timeline
- 2026-04-30 Listed $65,000 Beaches MLS
- 2026-03-24 Listing Removed — Beaches MLS
- 2025-10-16 Listing Removed — Beaches MLS
- 2025-10-16 Listed $67,000 Beaches MLS
- 2025-04-30 Listed $100,000 Beaches MLS
- 2021-10-18 Sold (MLS) $69,000 MARMLS
- 2021-09-17 Contingent — MARMLS
- 2021-08-17 Price Changed $71,500 MARMLS
- 2021-07-07 Relisted — MARMLS
- 2021-06-02 Pending — MARMLS
- 2021-05-18 Listed $72,000 MARMLS
- 2016-02-10 Sold (MLS) $50,000 Beaches MLS
- 2015-12-28 Listed $55,000 Beaches MLS
- 2015-09-15 Sold (MLS) $46,000 Beaches MLS
- 2014-03-25 Listed $50,000 Beaches MLS
Property tax history
-30.4%/yrLatest (2025): $5 · +0.0% YoY. Source: county tax records.
Cash-flow waterfall
monthlySold comps — $/sqft
last 12 mo · ≤1 miLoading sold comps…