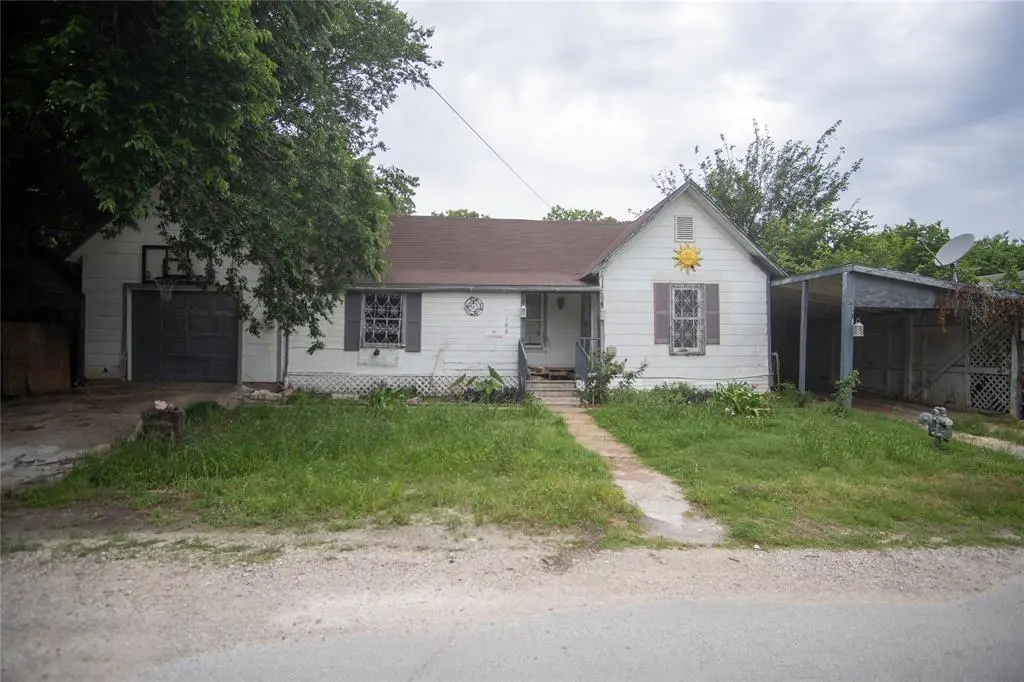
106 S Watson St · Alvarado, TX
Flood risk 1/10 · Minimal
- FEMA flood zone
- X (unshaded)
- Chance of flooding over 30 yrs
- 0.0%
- Est. flood insurance / yr
- $507 – $1,088
Fire risk 4/10 · Minor
- Est. fire insurance / yr
- $1,222 – $2,270
Heat risk 7/10 · Major
- Hot days now (above 110°F)
- 7 days/yr
- Hot days in 30 yrs
- 24 days/yr
Wind risk 6/10 · Moderate
- Chance of severe wind over 30 yrs
- 27.0%
Air-quality risk 2/10 · Minimal
- Unhealthy air days now
- 1 days/yr
- Unhealthy air days in 30 yrs
- 2 days/yr
Risk factors via First Street. Map © Google.
Why this score? — see what drove the B- grade
The composite is a weighted blend of 9 inputs, each scored 0–100. Each bar is that input's sub-score; the figure is the points it added to the 100-point composite (weight × sub-score).
- Cash flow +25.1/30.0
- ARV discount +15.0/15.0
- DSCR +8.2/10.0
- 1% rule +6.3/10.0
- Livability +3.7/5.0
- Schools +3.4/10.0
- Rent growth +2.5/5.0
- Condition / age +2.5/5.0
- Appreciation +0.0/10.0
$155,000
🖨 Deal sheet (PDF) 📄 Offer letter ✓ Due diligence
Listing remarks
Investment Opportunity in the Heart of Downtown Alvarado! Don’t miss this incredible chance to own a piece of prime real estate right in the heart of downtown Alvarado! This 3-bedroom, 1-bathroom home offers 1,130 square feet of living space sitting on a generous 0.205 acre lot giving you plenty of room to work with inside and out. Built in 1948, this charming property is full of potential and is perfectly positioned for the savvy investor looking for a rewarding fix-and-flip project or a long-term rental opportunity. The downtown location means walkability, visibility, and strong resale value once the work is done. Whether you’re a seasoned flipper, a first-time investor, or l
Key facts
- Generous lot
- Strong resale value
- Visibility
Tags
Property features AI
Finance
- Other: Property is in Johnson County, United States; Subdivision: Spt College Hill 01
- Financial info: Listing accepts cash and conventional financing
- HOA & community: No association
Exterior
- Parking: Driveway; Carport (1 space); Covered parking (1 space); Attached garage (1 car)
- Utilities: City sewer; Not in a municipal utility district
- Home design: Single-family residence; Residential property; One story
- Construction: Built in 1948; Siding construction; Shingle roof
- Exterior features: Lot less than 0.5 acre; Will subdivide (seller indicates yes)
Interior
- Kitchen: No appliances listed
- Bedrooms: 3 bedrooms (all on the main level)
- Bathrooms: 1 full bathroom
- Heating & cooling: Wall unit(s) for cooling
- Interior features: Cable TV available; One living area; One dining area; Total rooms: 4; One-level layout
- Laundry & utility: Washer hookup
Neighborhood map
What this means for you Summary
Snapshot
- This is a 3-bed/1.0-bath single-family listed at $155k.
Deal economics
- At list price, monthly cash flow is $342 ($4k/yr) — positive.
- The deal already cash-flows at list — no discount required.
- Meets the 1% rule at list price ($2k rent vs $155k).
- Recommended offer: $153k (1.5% below list) — sets the bar for market timing.
- Cap rate 8.9% vs local median 3.9% in Alvarado — top-decile yield for the area; either an underpriced asset or a hidden risk that comps aren't pricing in. Stress-test before assuming the spread holds.
Location & tenants
- Location reads 73/100 on livability (#228 in TX) — a middle-class / working-renter tenant base. Strengths: cost of living A+, housing A+, health & safety A+; Watch: amenities F, commute F.
- Alvarado ISD (rural): math 41% / reading 37% proficiency, ranked #416 of 826 in TX (top 50%) — families likely to look elsewhere, expect single-tenant / working-renter base with shorter leases.
- Zoned schools: Alvarado Int (math 49% / reading 35%, grade F, #1,335 of 4,322 statewide, top 33%, 799 students, 73% FRL); Alvarado J H (math 35% / reading 33%, grade F, #892 of 1,662 statewide, top 55%, 845 students, 67% FRL) — zoned schools average 70% FRL vs 52% district-wide (18 pts higher); higher-poverty schools than district average — tighter screening recommended.
- Market conditions: 360 active listings in the ZIP; 9 comparable units currently listed for rent nearby; rentals at typical pace (median 21d on market — plan ~3-4 weeks tenant-placement turnaround); solid renter incomes; 2,152 units permitted in Johnson County in 2024 (76 in 5+ unit buildings).
Forward outlook
- Local home prices are declining (-3.0%/yr); year-one equity from $1k of loan paydown is wiped out by about $5k of value loss. Plan a longer hold.
- Johnson County population projected at +24% by 2050 — long-run rental-demand tailwind backs the buy-and-hold thesis.
Negotiation context
- It's been on market 24 days — a 2% lower offer ($153k) is reasonable based on typical stale-listing flexibility.
Risks & watch-outs
- Watch-outs: built in 1948 — expect roof / HVAC / electrical / plumbing capex.
- Climate carrying-cost: major wind risk, 27% chance of damaging wind over 30y; extreme-heat days projected 7→24/yr by 2055 (HVAC capex compounding) — expect insurance premiums to compound above CPI over the hold.
Questions for the listing agent
- Built in 1948 — when were the roof, HVAC, electrical panel, plumbing, and water heater last replaced?
- Is there a deadline driving the sale (1031 exchange, divorce, estate, relocation)? That informs how much negotiation room exists.
- Schools are D-rated, which usually means shorter tenancies and higher turnover. Who's the typical renter profile here, and what's been the actual vacancy rate?
- What's the average days-on-market for RENTAL listings here right now (not sales)? A rising rental-DOM trend means longer vacancies and softer asking-rent achievability than the comps imply.
- What's the recent tenant-quality profile in this submarket — average credit score on applications, eviction rate, late-payment / NSF rate, and stable-employment percentage? A property-management company in the area should have these aggregated.
- How much new for-sale + rental construction is in the pipeline within 1–3 miles? Heavy new supply typically softens prices + rents 12–24 months out; constrained supply supports both.
Investment metrics
- 1% rule
- 1.13% ✓
- Cap rate
- 8.94%
- Cash-on-cash
- 9.45%
- DSCR
- 1.42
- GRM
- 7.4
CMA / ARV
- ARV (on-the-fly)
- $198,880
- Comps found
- 12
Show comp detail 12 sales within ~0.75 mi
| Address | Dist | Beds/Ba | Sqft | Sold | Price | $/sf | Match |
|---|---|---|---|---|---|---|---|
| 200 Bill Jackson Dr | 0.11mi | 3/2.0 | 1,097 (-3%) | 7mo | $219,900 | $200 | 80 |
| 311 S Watson St | 0.24mi | 3/1.0 | 1,218 (+8%) | 1mo | $131,750 | $108 | 75 |
| 716 N Cummings Dr | 0.60mi | 3/1.0 | 1,200 (+6%) | 1mo | $175,000 | $146 | 60 |
| 111 Chris Ct | 0.70mi | 3/2.0 | 1,158 (+2%) | 2mo | $239,000 | $206 | 58 |
| 110 S 5th St | 0.69mi | 3/1.5 | 1,182 (+5%) | 3mo | $200,000 | $169 | 55 |
| 705 N Ray St | 0.58mi | 3/1.0 | 1,247 (+10%) | 5mo | $220,000 | $176 | 52 |
| 307 E Patton Ave | 0.64mi | 2/1.5 (-1) | 1,063 (-6%) | 6mo | $199,000 | $187 | 48 |
| 205 Bishop St | 0.66mi | 2/2.0 (-1) | 1,168 (+3%) | 7mo | $184,900 | $158 | 48 |
| 213 S Baugh St | 0.67mi | 3/2.0 | 996 (-12%) | 1mo | $234,990 | $236 | 45 |
| 402 E Davis Ave | 0.69mi | 3/1.0 | 976 (-14%) | 7mo | $164,900 | $169 | 40 |
| 306 E Cotter Ave | 0.66mi | 3/2.0 | 1,290 (+14%) | 7mo | $275,000 | $213 | 36 |
| 102 Lorie St | 0.73mi | 2/1.0 (-1) | 1,008 (-11%) | 9mo | $169,900 | $169 | 35 |
Match score weights: distance 35% · size 25% · config 20% · recency 20%. Top-matched comps best support the ARV.
Projected returns pro-forma
-3.0% appreciation · 3.0% rent growth · sell at horizon
- IRR
- -2.0%
- Equity multiple
- 0.92×
- Total profit
- $-3,345
- Equity at exit
- $23,111
- IRR
- 7.7%
- Equity multiple
- 1.58×
- Total profit
- $25,136
- Equity at exit
- $13,402
Cash invested: $43,400 (down + closing). Projections, not guarantees.
Landlord ↔ Tenant lean methodology
- Overall (STATE)
- 87 Strongly Landlord-Friendly
- State Texas
- 87 Strongly Landlord-Friendly · R+5
- County
- — inherits STATE
- City
- — inherits STATE
ZIP-level market 76009
- Home prices YoY
- -25.7%
- Active inventory
- 360
- Price-to-rent
- 7.4×
Monthly cashflow live
- Estimated rent
- $1,745 high interval (Pro) →
- Mortgage (P&I)
- −$813
- Tax from tax record
- −$159 /mo · $1,909/yr
- Insurance
- −$65
- HOA
- −$0
- Vacancy / Maint / Mgmt
- −$366
- Net cashflow
- $342
Break-even live
Sensitivity live
| Price | -10% $430 | -5% $386 | +0% $342 | +5% $298 | +10% $254 |
|---|---|---|---|---|---|
| Rent | -10% $204 | -5% $273 | +0% $342 | +5% $411 | +10% $480 |
| Rate | -1.0pp $420 | -0.5pp $381 | base $342 | +0.5pp $302 | +1.0pp $261 |
UW: 25.0% down · 7.5% · 30yr · 1.5% tax · 5.0% vac · 8.0% maint · 8.0% mgmt
Financing live
Cash to close
- Down payment
- $38,750
- Closing costs
- $4,650
- Reserves months
- —
- Total cash needed
- —
Loan-product check · same deal, 3 products live
Conventional
25% down · 7.5% · 30yr
- Down + closing
- —
- Monthly P&I
- —
- Monthly cashflow
- —
- DSCR
- —
- Eligible?
- —
Personal DTI + credit; lowest rate.
DSCR
20% down · 8.5% · 30yr
- Down + closing
- —
- Monthly P&I
- —
- Monthly cashflow
- —
- DSCR
- —
- Eligible?
- —
No personal income docs; deal must DSCR.
Hard money
10% down · 12.0% · 12mo
- Down + closing
- —
- Monthly P&I
- —
- Monthly cashflow
- —
- DSCR
- —
- Eligible?
- —
Short-term bridge; refi at stabilization.
Rent comps 9 comps
| Address | Beds | Baths | Sqft | Rent | $/sqft | DOM | Units | Dist |
|---|---|---|---|---|---|---|---|---|
| 108 Sunset Cir Alvarado, TX | 3.0 | 2.0 | 1127 | $1,725 | $1.53 | 45d | 1 | 0.16mi |
| 108 Sunset Cir Alvarado, TX | 3.0 | 2.0 | 1127 | $1,725 | $1.53 | 26d | 1 | 0.16mi |
| 106 Austin St Alvarado, TX | 3.0 | 2.0 | 1178 | $1,900 | $1.61 | 26d | 1 | 0.65mi |
| 1109 S Spears St Alvarado, TX | 3.0 | 2.0 | 1090 | $1,700 | $1.56 | 0d | 1 | 0.68mi |
| 811 N Spears St Unit 102 Alvarado, TX | 2.0 | 1.5 | 1000 | $1,195 | $1.20 | 3d | 1 | 0.76mi |
| 811 N Spears St Unit 102 Alvarado, TX | 2.0 | 1.5 | 1000 | $1,195 | $1.20 | 22d | 1 | 0.76mi |
| 811 N Spears St Alvarado, TX | 2.0 | 2.0 | 1000 | $1,195 | $1.20 | 17d | 1 | 0.76mi |
| 1020 Burnett Blvd Unit B Alvarado, TX | 3.0 | 2.0 | 1329 | $1,750 | $1.32 | 20d | 1 | 1.25mi |
| 310 Shirley Dr Alvarado, TX | 3.0 | 2.0 | 1065 | $1,750 | $1.64 | 14d | 1 | 1.34mi |
Listing history 17 events
-
2026-06-21days on market $155,000 Active 24 DOM
-
2026-06-18days on market $155,000 Active 21 DOM
-
2026-06-17days on market $155,000 Active 20 DOM
-
2026-06-16days on market $155,000 Active 19 DOM
-
2026-06-15days on market $155,000 Active 18 DOM
-
2026-06-13days on market $155,000 Active 16 DOM
-
2026-06-09days on market $155,000 Active 12 DOM
-
2026-06-08days on market $155,000 Active 11 DOM
-
2026-06-07days on market $155,000 Active 10 DOM
-
2026-06-04days on market $155,000 Active 7 DOM
-
2026-06-03days on market $155,000 Active 6 DOM
-
2026-06-02days on market $155,000 Active 5 DOM
-
2026-06-01days on market $155,000 Active 4 DOM
-
2026-05-31days on market $155,000 Active 3 DOM
-
2026-05-28$155,000 Active
-
2016-06-21soldstatus
-
2001-12-27soldstatus
ⓘ Source: listings_history table (triggers on properties + properties_extension) + one-shot
backfill from property_details.listing_events for pre-trigger history.
Tax reassessment forecast TX · Resets to sale price
- Current annual tax
- $1,909 · $159/mo
- Projected year-2 tax
- $2,836 · $236/mo
- Expected delta
- +$928/yr (+$77/mo · 48.6%)
ⓘ Screening estimate from a state-policy table — verify with the county assessor before closing.
Climate risk First Street
- Flood 1/10 Low FEMA zone X (unshaded) · 0% chance over 30 yrs
- Wildfire 4/10 Moderate
- Heat 7/10 Severe 7 d/yr ≥110°F today · 24 d/yr by 30 yrs out
- Wind 6/10 Major 27% chance of damaging wind over 30 yrs
- Air quality 2/10 Low 1 unhealthy d/yr today · 2 by 30 yrs out
Nearby sold comps map
Loading sold comps map…
Walkable amenities ~0.75 mi
Loading nearby amenities…
Taxation est. · year 1
- Rental income
- $20,936
- − Mortgage interest
- −$8,682
- − Property taxes
- −$1,909
- − Insurance
- −$775
- − Repairs & maintenance
- −$1,675
- − Management
- −$1,675
- − Depreciation
- −$4,509
- Taxable income
- $1,710
- Est. tax owed @ 24.0%
- −$411
- After-tax cash flow
- $3,691/yr
For passive investors: Depreciation is non-cash, so a rental often shows a tax loss while cash-flowing — sheltering income. Rental losses are passive: they offset passive income freely, and up to $25,000/yr can offset ordinary (W-2) income if you actively participate and your MAGI is under $100k (phasing out to $0 by $150k); unused losses carry forward. On sale, claimed depreciation is recaptured at up to 25%, and gains may owe capital-gains tax (a 1031 exchange can defer both). Figures are a year-1 estimate at your 24.0% rate — not tax advice; consult a CPA.
Schools (NCES district)
- District
- Alvarado ISD
- NCES district ID
- 4800011
- Math proficiency
- 41% ▲ 4.00%
- Reading proficiency
- 37% ▼ -2.00%
- Median HH income
- $53,485
- Composite
- 34.02/100
- National rank
- #5312
- State rank
- #416 of 826 in TX
Livability — Alvarado
- Score
- 73/100
- State rank
- #228
- US rank
- #5544
Category grades
Schools grade is shown separately in the Schools card above.
Census & demographics
- Census place
- Alvarado, TX
- County
- Johnson County · 147,987 people
- City population
- 22,803
- Metro
- Dallas-Fort Worth-Arlington, TX
- Population (ZIP)
- 22,803
- Household income
- $79,755
- Rent vs Own
- Severe rent burden
- 298.0
Population outlook (Johnson County) Hauer SSP2
- Today (2025)
- 179,678 people
- By 2030
- 189,208 · +5.3%
- By 2040
- 207,261 · +15.4%
- By 2050
- 223,064 · +24.1%
- By 2075
- 259,979 · +44.7%
- By 2100
- 275,395 · +53.3%
Race, ethnicity, and origin ACS 2023
- Neighborhood character
- Majority White (56%)
- Race & ethnicity
- White 56% Hispanic / Latino 39% Two or more races 17% Black 3%
- Hispanic origin (detail)
- Mexican 37%
- Common ancestry
- Serbian 1% Romanian 1% Italian 1%
- Foreign-born
- 10% · Canada
- Languages at home
- 73% English-only · Spanish 27%
Political lean MEDSL · Johnson
- 2024 margin
- Solid R (+51.4) · D 23.9% · R 75.3%
- 2008→2024 swing
- -3.9pp toward R · 2008: -47.5pp · 2024: -51.4pp
- All cycles
- 2024: R+51.4 2020: R+53.0 2016: R+58.3 2012: R+55.6 2008: R+47.5
Not yet ingested
- Civics
- —
Market trends
- HPI YoY
- ▼ -86.74%
- Current HPI
- 251.2624
- Rent YoY
- —
- Metro
- Dallas-Fort Worth-Arlington, TX
- State GDP YoY
- ▲ 3.95%
- F500 in state
- 110
Industry mix (Fortune 500 HQ in TX)
| Industry | F500 HQs | Revenue |
|---|---|---|
| Energy | 16 | $1,198B |
|
||
| Technology | 5 | $198B |
|
||
| Engineering / Construction | 4 | $72B |
|
||
| Energy Services | 3 | $60B |
|
||
| Utilities | 3 | $41B |
|
||
| Healthcare | 2 | $330B |
|
||
Price history
3 events — show timeline
- 2026-05-28 Listed $155,000 NTREIS
- 2016-06-21 Sold (Public Records) — Public Records
- 2001-12-27 Sold (Public Records) — Public Records
Property tax history
+3.4%/yrLatest (2025): $1,909 · +6.3% YoY. Source: county tax records.
Cash-flow waterfall
monthlySold comps — $/sqft
last 12 mo · ≤1 miLoading sold comps…