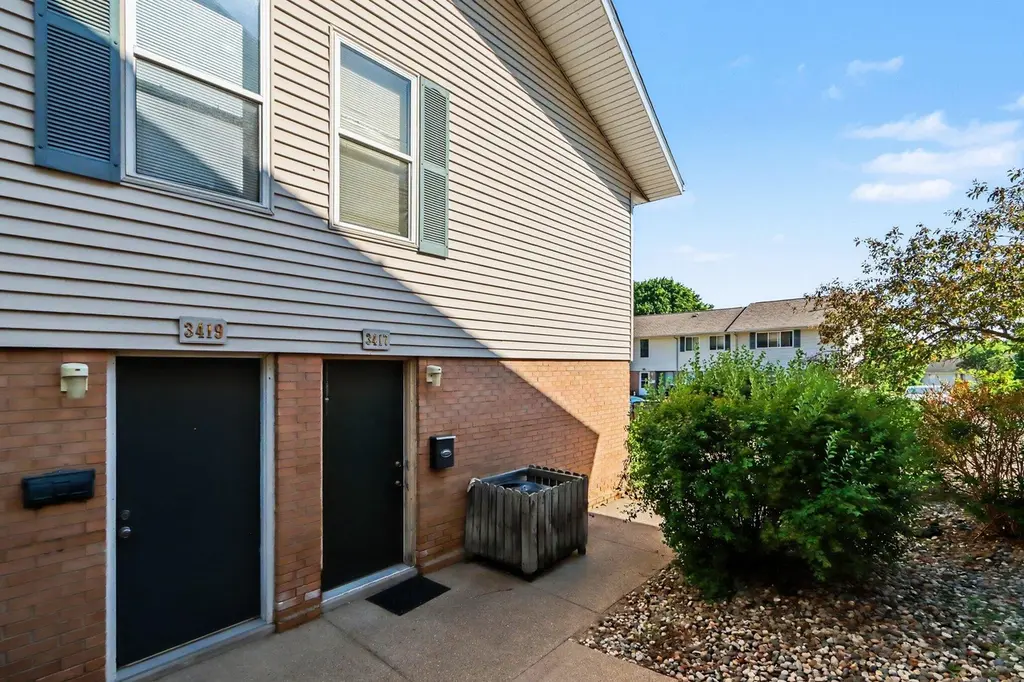
3417 Kenbrooke Ct · Kalamazoo, MI
Flood risk 1/10 · Minimal
- FEMA flood zone
- X (unshaded)
- Chance of flooding over 30 yrs
- 0.0%
- Est. flood insurance / yr
- $507 – $1,088
Fire risk 1/10 · Minimal
- Est. fire insurance / yr
- $784 – $1,456
Heat risk 2/10 · Minimal
- Hot days now (above 100°F)
- 7 days/yr
- Hot days in 30 yrs
- 16 days/yr
Wind risk 2/10 · Minimal
- Chance of severe wind over 30 yrs
- —
Air-quality risk 2/10 · Minimal
- Unhealthy air days now
- 1 days/yr
- Unhealthy air days in 30 yrs
- 2 days/yr
Risk factors via First Street. Map © Google.
Why this score? — see what drove the D- grade
The composite is a weighted blend of 9 inputs, each scored 0–100. Each bar is that input's sub-score; the figure is the points it added to the 100-point composite (weight × sub-score).
- Cash flow +8.7/30.0
- ARV discount +7.5/15.0
- 1% rule +5.8/10.0
- Schools +4.7/10.0
- Livability +3.8/5.0
- Rent growth +3.3/5.0
- Condition / age +2.5/5.0
- DSCR +2.4/10.0
- Appreciation +0.0/10.0
$89,900
🖨 Deal sheet (PDF) 📄 Offer letter ✓ Due diligence
Listing remarks MLS
Close to WMU and K-College this condo is a great investment. End unit that features a great room space on the main floor and large upstairs bedroom with 2 closets upstairs. Sliders off the living room to a private patio. The building does have laundry facilities. Ample parking . Clubhouse and pool available to condo. Great rental or owner occupied. Walk to campus and the bus line. Open floor plan with beautiful kitchen including updated cabinets Upstairs you will find a huge bedroom with 2 closets that have organizers and a full bath. This is an end unit with private patio. This would make a great home for your college student to live close to campus and is on the bus line. Currently rented for $900 per month, Tenant has leased signed until 7-31-2028 but could vacate if buyer wants for their own living space. There is coin laundry in the basement and a private storage space.
Key facts
- Laundry facilities
- Clubhouse and pool
- End unit
Tags
Property features AI
Finance
- HOA & community: Monthly association fee ($242); Association includes water, trash, sewer, snow removal, and lawn/yard care; Association amenities include pool, storage, and pets allowed
Exterior
- Utilities: Public water
- Home design: Residential condominium; Other architectural style; Built in 1960
- Construction: Brick and vinyl siding construction
- Exterior features: Public water
Interior
- Kitchen: Dishwasher; Range
- Bathrooms: 1 full bathroom
- Heating & cooling: Forced air heating; Has cooling
- Interior features: Two total rooms; Basement (other)
Neighborhood map
What this means for you Summary
Snapshot
- This is a 1-bed/1.0-bath condo listed at $90k.
Deal economics
- At list price, monthly cash flow is $-76 ($-912/yr) — negative.
- To cash-flow at today's rent, offer at most $76k (14.9% below list).
- Meets the 1% rule at list price ($975 rent vs $90k).
- Recommended offer: $76k (14.9% below list) — sets the bar for cash-flow.
- Cap rate 5.3% vs local median 4.1% in Kalamazoo — meaningfully above typical; check what's discounted (condition, days-on-market, listing class) to confirm the premium yield is real.
Location & tenants
- Location reads 76/100 on livability (#141 in MI, #3,492 nationally) — a middle-class / working-renter tenant base. Strengths: commute A+, cost of living A+, housing A+; Watch: crime F, employment D-.
- Kalamazoo Public Schools (urban): math 43% / reading 72% proficiency, ranked #71 of 540 in MI (top 13%) — acceptable for families but not a draw, mixed tenant base, ~2y average lease; 66% free/reduced lunch — lower-income household profile, screen leases tightly.
- Zoned schools: Arcadia Elementary School (354 students, 83% FRL); Maple Street Magnet School For The Arts (math 75% / reading 75%, grade A, #8 of 493 statewide, top 3%, 860 students, 59% FRL); Loy Norrix High School (math 47% / reading 82%, grade B-, #46 of 713 statewide, top 7%, 1,771 students, 68% FRL) — zoned schools at 70% FRL track the district average.
- Zoned-school proficiency averages 70% at this address vs 58% district-wide (+12 pts) — the actual schools serving this property are materially stronger than the Kalamazoo Public Schools average implies; a family-tenant draw the district grade alone would hide.
- Market conditions: Rents rising (+3.4%/yr); 106 active listings in the ZIP; 11 comparable units currently listed for rent nearby; rentals at typical pace (median 16d on market — plan ~3-4 weeks tenant-placement turnaround); lower-income renter base — watch delinquency; 339 units permitted in Kalamazoo County in 2024 (22 in 5+ unit buildings).
Forward outlook
- Local home prices are declining (-3.0%/yr); year-one equity from $622 of loan paydown is wiped out by about $3k of value loss. Plan a longer hold.
- Kalamazoo County population projected at +18% by 2050 — long-run rental-demand tailwind backs the buy-and-hold thesis.
Negotiation context
- It's been on market 18 days — a 2% lower offer ($89k) is reasonable based on typical stale-listing flexibility.
- 7 sale attempts since 30y ago with the ask held roughly flat each time — persistent listings suggest the price (not the market) is what's stuck; bring a comps-based counter.
- Current owner paid $30k; list at $90k implies a 195% gain — meaningful room to come down on a strong offer.
Risks & watch-outs
- Watch-outs: HOA is 25% of rent.
Questions for the listing agent
- What do current leases actually rent for vs. the listed asking? Can we see a recent rent roll and the last 12 months of T-12 income?
- Built in 1960 — when were the roof, HVAC, electrical panel, plumbing, and water heater last replaced?
- What does the HOA fee cover, when was the last increase, and are there any pending special assessments or reserve-fund shortfalls?
- Any open or pending special assessments — roof, HVAC, plumbing, elevator, façade? What's the per-unit balance and payoff schedule, and is the seller paying it off at close or rolling it to the buyer?
- Is there a deadline driving the sale (1031 exchange, divorce, estate, relocation)? That informs how much negotiation room exists.
- Crime grade is F in this area — have there been break-ins, vandalism, or insurance claims at this property in the last 3 years? What carrier currently insures it and at what premium?
- The area grade is low — what's the realistic commute time and amenity access for the typical tenant pool here? Any planned neighborhood developments (good or bad) we should know about?
- What's the average days-on-market for RENTAL listings here right now (not sales)? A rising rental-DOM trend means longer vacancies and softer asking-rent achievability than the comps imply.
- What's the recent tenant-quality profile in this submarket — average credit score on applications, eviction rate, late-payment / NSF rate, and stable-employment percentage? A property-management company in the area should have these aggregated.
- How much new apartment / multifamily construction is in the pipeline within 1–3 miles? Heavy new supply (>2% of stock underway) typically softens rents 12–24 months out; light construction supports rent growth.
Investment metrics
- 1% rule
- 1.08% ✓
- Cap rate
- 5.28%
- Cash-on-cash
- -3.62%
- DSCR
- 0.84
- GRM
- 7.7
CMA / ARV
No comps found within radius.
Projected returns pro-forma
-3.0% appreciation · 3.39% rent growth · sell at horizon
- IRR
- -21.5%
- Equity multiple
- 0.25×
- Total profit
- $-18,870
- Equity at exit
- $13,404
- IRR
- -13.5%
- Equity multiple
- 0.19×
- Total profit
- $-20,454
- Equity at exit
- $7,773
Cash invested: $25,172 (down + closing). Projections, not guarantees.
Landlord ↔ Tenant lean methodology
- Overall (STATE)
- 62 Landlord-Friendly
- State Michigan
- 62 Landlord-Friendly · EVEN
- County
- — inherits STATE
- City
- — inherits STATE
ZIP-level market 49006
- Rents YoY
- 3.4%
- Active inventory
- 106
- Price-to-rent
- 7.7×
Monthly cashflow live
- Estimated rent
- $975 high interval (Pro) →
- Mortgage (P&I)
- −$471
- Tax from tax record
- −$95 /mo · $1,144/yr
- Insurance
- −$37
- HOA
- −$242
- Vacancy / Maint / Mgmt
- −$205
- Net cashflow
- $-76
Break-even live
Sensitivity live
| Price | -10% $-25 | -5% $-51 | +0% $-76 | +5% $-101 | +10% $-127 |
|---|---|---|---|---|---|
| Rent | -10% $-153 | -5% $-115 | +0% $-76 | +5% $-37 | +10% $1 |
| Rate | -1.0pp $-31 | -0.5pp $-53 | base $-76 | +0.5pp $-99 | +1.0pp $-123 |
UW: 25.0% down · 7.5% · 30yr · 1.5% tax · 5.0% vac · 8.0% maint · 8.0% mgmt
Financing live
Cash to close
- Down payment
- $22,475
- Closing costs
- $2,697
- Reserves months
- —
- Total cash needed
- —
Loan-product check · same deal, 3 products live
Conventional
25% down · 7.5% · 30yr
- Down + closing
- —
- Monthly P&I
- —
- Monthly cashflow
- —
- DSCR
- —
- Eligible?
- —
Personal DTI + credit; lowest rate.
DSCR
20% down · 8.5% · 30yr
- Down + closing
- —
- Monthly P&I
- —
- Monthly cashflow
- —
- DSCR
- —
- Eligible?
- —
No personal income docs; deal must DSCR.
Hard money
10% down · 12.0% · 12mo
- Down + closing
- —
- Monthly P&I
- —
- Monthly cashflow
- —
- DSCR
- —
- Eligible?
- —
Short-term bridge; refi at stabilization.
Rent comps 11 comps
| Address | Beds | Baths | Sqft | Rent | $/sqft | DOM | Units | Dist |
|---|---|---|---|---|---|---|---|---|
| 3614 Stadium Dr Kalamazoo, MI | 1.0–3.0 | 1.0–2.0 | 928 | $1,099 | $1.18 | 15d | 1 | 0.26mi |
| 4130 W Michigan Ave Kalamazoo, MI | 1.0–2.0 | 1.0–2.0 | 625 | $610 | $0.98 | 15d | 4 | 0.45mi |
| 4346 N Hills Dr Kalamazoo, MI | 2.0–4.0 | 2.0–4.0 | 1093 | $440 | $0.40 | 23d | 1 | 0.56mi |
| 332 S Kendall Ave Kalamazoo, MI | 1.0–2.0 | 1.0–2.0 | 780 | $975 | $1.25 | 23d | 4 | 0.96mi |
| 704 S Drake Rd Kalamazoo, MI | 1.0–3.0 | 1.0–1.5 | 887 | $870 | $0.98 | 15d | 16 | 1.07mi |
| 125 S Kendall Ave Kalamazoo, MI | 1.0–2.0 | 1.0–1.5 | 735 | $875 | $1.19 | 23d | 6 | 1.11mi |
| 1400 Concord Pl Dr Kalamazoo, MI | 2.0 | 1.0 | 557 | $876 | $1.57 | 15d | 46 | 1.24mi |
| 1800 S 11th St Kalamazoo, MI | 1.0–2.0 | 1.0 | 635 | $799 | $1.26 | 23d | 9 | 1.39mi |
| 1842 S 11th St Kalamazoo, MI | 1.0 | 1.0 | 547 | $975 | $1.78 | 15d | 1 | 1.40mi |
| 318 N Sage St Kalamazoo, MI | 1.0–2.0 | 1.0 | 824 | $1,025 | $1.24 | 15d | 3 | 1.42mi |
| 5500 W KL Ave Kalamazoo, MI | 1.0–3.0 | 1.0–2.0 | 836 | $999 | $1.19 | 15d | 1 | 1.43mi |
HOA detail condo
- Monthly dues
- $242 · $2,904/yr
- Likely covers
- pool
- Assessments
- None detected in remarks — confirm with the listing agent.
Listing history 13 events
-
2026-06-21days on market $89,900 Active 18 DOM
-
2026-06-18days on market $89,900 Active 15 DOM
-
2026-06-17days on market $89,900 Active 14 DOM
-
2026-06-16days on market $89,900 Active 13 DOM
-
2026-06-15days on market $89,900 Active 12 DOM
-
2026-06-14days on market $89,900 Active 10 DOM
-
2026-06-13days on market $89,900 Active 9 DOM
-
2026-06-10days on market $89,900 Active 7 DOM
-
2026-06-09days on market $89,900 Active 6 DOM
-
2026-06-08days on market $89,900 Active 5 DOM
-
2026-06-07days on market $89,900 Active 4 DOM
-
2026-06-05remarks 699-char remark
-
2026-06-05$89,900 Active 1 DOM
ⓘ Source: listings_history table (triggers on properties + properties_extension) + one-shot
backfill from property_details.listing_events for pre-trigger history.
Tax reassessment forecast MI · Partial reset (capped growth)
- Current annual tax
- $1,144 · $95/mo
- Projected year-2 tax
- $1,264 · $105/mo
- Expected delta
- +$120/yr (+$10/mo · 10.5%)
ⓘ Screening estimate from a state-policy table — verify with the county assessor before closing.
Climate risk First Street
- Flood 1/10 Low FEMA zone X (unshaded) · 0% chance over 30 yrs
- Wildfire 1/10 Low
- Heat 2/10 Low 7 d/yr ≥100°F today · 16 d/yr by 30 yrs out
- Wind 2/10 Low
- Air quality 2/10 Low 1 unhealthy d/yr today · 2 by 30 yrs out
Nearby sold comps map
Loading sold comps map…
Walkable amenities ~0.75 mi
Loading nearby amenities…
Taxation est. · year 1
- Rental income
- $11,700
- − Mortgage interest
- −$5,036
- − Property taxes
- −$1,144
- − Insurance
- −$450
- − Repairs & maintenance
- −$936
- − Management
- −$936
- − HOA
- −$2,904
- − Depreciation
- −$2,615
- Taxable loss
- −$2,321
- Est. tax savings @ 24.0%
- +$557
- After-tax cash flow
- $-355/yr
For passive investors: Depreciation is non-cash, so a rental often shows a tax loss while cash-flowing — sheltering income. Rental losses are passive: they offset passive income freely, and up to $25,000/yr can offset ordinary (W-2) income if you actively participate and your MAGI is under $100k (phasing out to $0 by $150k); unused losses carry forward. On sale, claimed depreciation is recaptured at up to 25%, and gains may owe capital-gains tax (a 1031 exchange can defer both). Figures are a year-1 estimate at your 24.0% rate — not tax advice; consult a CPA.
Schools (NCES district)
- District
- Kalamazoo Public Schools
- NCES district ID
- 2619950
- Math proficiency
- 43% ▲ 13.00%
- Reading proficiency
- 72% ▲ 33.00%
- Median HH income
- $35,291
- Composite
- 47.48/100
- National rank
- #2275
- State rank
- #71 of 540 in MI
Livability — Kalamazoo
- Score
- 76/100
- State rank
- #141
- US rank
- #3492
Category grades
Schools grade is shown separately in the Schools card above.
Census & demographics
- Census place
- Kalamazoo, MI
- County
- Kalamazoo County · 224,317 people
- City population
- 121,397
- Metro
- Kalamazoo-Portage, MI
- Population (ZIP)
- 26,507
- Household income
- $43,639
- Rent vs Own
- Severe rent burden
- 2581.0
Population outlook (Kalamazoo County) Hauer SSP2
- Today (2025)
- 280,982 people
- By 2030
- 292,068 · +3.9%
- By 2040
- 312,191 · +11.1%
- By 2050
- 331,196 · +17.9%
- By 2075
- 379,021 · +34.9%
- By 2100
- 396,579 · +41.1%
Race, ethnicity, and origin ACS 2023
- Neighborhood character
- Diverse neighborhood (Simpson 0.55)
- Race & ethnicity
- White 65% Black 14% Two or more races 10% Hispanic / Latino 9% Asian 4%
- Hispanic origin (detail)
- Mexican 6%
- Common ancestry
- Iranian 6% Romanian 4% Italian 3%
- Foreign-born
- 9% · Canada, South Korea, China
- Languages at home
- 89% English-only · Spanish 5% Other Indo-European 2% French/Haitian/Cajun 2%
Political lean MEDSL · Kalamazoo
- 2024 margin
- D (+17.7) · D 58.0% · R 40.3% · Other 1.7%
- 2008→2024 swing
- -1.8pp toward R · 2008: 19.5pp · 2024: 17.7pp
- All cycles
- 2024: D+17.7 2020: D+18.7 2016: D+12.8 2012: D+13.3 2008: D+19.5
Not yet ingested
- Civics
- —
Market trends
- HPI YoY
- ▼ -235.52%
- Current HPI
- 243.4367
- Rent YoY
- ▲ 3.39%
- Metro
- Kalamazoo-Portage, MI
- State GDP YoY
- ▲ 1.37%
- F500 in state
- 28
Industry mix (Fortune 500 HQ in MI)
| Industry | F500 HQs | Revenue |
|---|---|---|
| Automotive Parts | 3 | $48B |
|
||
| Automotive | 2 | $372B |
|
||
| Chemicals | 1 | $45B |
|
||
| Automotive Retail | 1 | $29B |
|
||
| Healthcare / Medical Devices | 1 | $23B |
|
||
| Automotive Technology | 1 | $20B |
|
||
Price history
+245.8% since first listed13 events — show timeline
- 2026-06-03 Listed $89,900 REALCOMP
- 2026-06-03 Listed $89,900 SW Michigan MLS
- 2026-06-03 Listed $89,900 MiRealSource-MiMLS
- 2014-04-17 Sold (Public Records) $30,500 Public Records
- 2014-03-28 Sold (MLS) $30,500 REALCOMP
- 2014-03-28 Sold (MLS) $30,500 SW Michigan MLS
- 2014-02-25 Listed $32,500 REALCOMP
- 2014-02-25 Listed $32,500 SW Michigan MLS
- 2012-07-20 Sold (Public Records) $24,000 Public Records
- 1996-06-27 Sold (MLS) $23,500 REALCOMP
- 1996-06-27 Sold (MLS) $23,500 SW Michigan MLS
- 1996-05-16 Listed $26,000 REALCOMP
- 1996-05-16 Listed $26,000 SW Michigan MLS
Property tax history
+3.7%/yrLatest (2025): $1,144 · +3.0% YoY. Source: county tax records.
Cash-flow waterfall
monthlySold comps — $/sqft
last 12 mo · ≤1 miLoading sold comps…