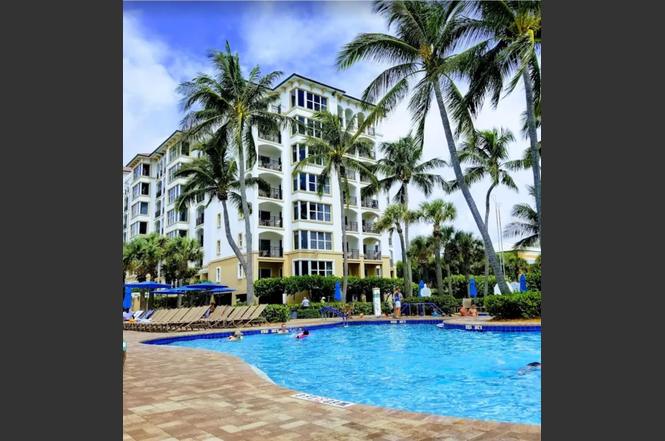
71 S Ocean Ave #8708 · Palm Beach Shores, FL
Flood risk 6/10 · Moderate
- FEMA flood zone
- X (unshaded)
- Chance of flooding over 30 yrs
- 0.52%
- Est. flood insurance / yr
- $507 – $1,088
Fire risk 1/10 · Minimal
- Est. fire insurance / yr
- $947 – $1,759
Heat risk 10/10 · Severe
- Hot days now (above 105°F)
- 7 days/yr
- Hot days in 30 yrs
- 24 days/yr
Wind risk 10/10 · Severe
- Chance of severe wind over 30 yrs
- 99.0%
Air-quality risk 2/10 · Minimal
- Unhealthy air days now
- 2 days/yr
- Unhealthy air days in 30 yrs
- 2 days/yr
Risk factors via First Street. Map © Google.
Why this score? — see what drove the D+ grade
The composite is a weighted blend of 9 inputs, each scored 0–100. Each bar is that input's sub-score; the figure is the points it added to the 100-point composite (weight × sub-score).
- Cash flow +15.0/30.0
- ARV discount +7.5/15.0
- 1% rule +5.0/10.0
- DSCR +5.0/10.0
- Schools +4.3/10.0
- Livability +3.6/5.0
- Condition / age +2.5/5.0
- Rent growth +2.3/5.0
- Appreciation +0.0/10.0
$5,800
🖨 Deal sheet 📄 Offer letter ✓ Due diligence
Listing remarks
Fractional Ownership, enjoy one week on Paradice in the Marriott's vacation club at Palm Beach Shores FL Resort, the owner will own week 34 whit full warranty Deed. The maintenance is provided by the Marriott's. Beautiful Ocean front, Two Bedrooms, Two Bathrooms, 1300 Square Feet Sleep Capacity 8, Spacious Living Room Ocean Side Balcony and a full gourmet kitchen and Ocean Side Balcony Start having a memorable and most enjoyable vacation, amenities include Pools, whirlpool Spas, Beach Ocean, Fitness Center, Tennis, Pickleball, Bocce Ball, Miniature Golf, Bolli Ball, Outdoor Fireplace, Beach Cabanas, Chairs and Umbrellas, Barbecue Picnic area, Playground, Onsite Dinner and more. Weeks are s
Key facts
- $220 HOA
- Community pool
- Built 1998
Property features AI
Finance
- Other: Furnished; Living area reported as 1,200 (owner); Building area reported as 1,300 (owner); Total lot about 1 acre (land recorded as 1 to less than 2 acres)
- HOA & community: Monthly condo fee: $129 (annual fees shown as $1,551); Association covers cable TV, pool, electricity, internet, building and grounds maintenance, pest control, sewer, trash and water; Community amenities include fitness center, park, playground, pool and tennis courts; Total monthly fees listed as $220 and total annual fees $2,640
Exterior
- Parking: Directions available to property (I-95 to Blue Heron Blvd East, right on Park Ave, left on Bamboo Rd, right on S Ocean Ave)
- Utilities: Public water; Private sewer; Cable connected; Electricity connected
- Home design: Condominium; One level; Faces west; Located on 7th floor
- Construction: Concrete construction; Other roof; Block foundation; Building identified as SAILFISH/8708; Built as part of a 7-story building
- Exterior features: Balcony; Outdoor grill; Playground; Tennis courts; Private heated in-ground pool; On waterfront with full gulf/ocean view and direct gulf/ocean access
Interior
- Kitchen: Cooktop; Dishwasher; Disposal; Microwave; Trash compactor
- Bedrooms: 2 bedrooms
- Flooring: Ceramic tile
- Bathrooms: 2 full bathrooms
- Heating & cooling: Central heating; Central air conditioning
- Interior features: Ceiling fans; Elevator; Window treatments; 3 total rooms
- Laundry & utility: Washer and dryer inside; Electric water heater
Neighborhood map
What this means for you Summary
Snapshot
- This is a 2-bed/2.0-bath condo listed at $6k.
Deal economics
- At list price, monthly cash flow is $3k ($34k/yr) — positive.
- The deal already cash-flows at list — no discount required.
- Meets the 1% rule at list price ($4k rent vs $6k).
- Recommended offer: $6k (3.0% below list) — sets the bar for market timing.
Location & tenants
- Location reads 72/100 on livability (#326 in FL) — a middle-class / working-renter tenant base. Strengths: employment A+, health & safety A+, crime A-; Watch: schools D, amenities F, cost of living F.
- Palm Beach (suburban): math 46% / reading 53% proficiency, ranked #34 of 73 in FL (top 47%) — families likely to look elsewhere, expect single-tenant / working-renter base with shorter leases.
- Market conditions: Rents soft (-0.7%/yr); 506 active listings in the ZIP; 40 comparable units currently listed for rent nearby; rentals at typical pace (median 22d on market — plan ~3-4 weeks tenant-placement turnaround); 3,974 units permitted in Palm Beach County in 2024 (1,012 in 5+ unit buildings).
- At $3,929/mo this rent would consume 72% of the median local household income ($65k/yr) (locally 1838% of renters already pay >50% of income on rent) — very limited rent-growth headroom before tenants either downsize or default.
Forward outlook
- Local home prices are declining (-3.0%/yr); year-one equity from $40 of loan paydown is wiped out by about $174 of value loss. Plan a longer hold.
- Palm Beach County population projected at +30% by 2050 — long-run rental-demand tailwind backs the buy-and-hold thesis.
- At projected returns (-3.0% appreciation + 0.0% rent growth), your $2k cash investment doubles in ~1 year — after that, you're playing with house money.
Negotiation context
- It's been on market 54 days — a 3% lower offer ($6k) is reasonable based on typical stale-listing flexibility.
- 2 sale attempts; this cycle's ask has dropped $1k (15%) from the opening price — seller is motivated, your offer sets the floor, not the list.
Risks & watch-outs
- Climate carrying-cost: major flood risk; severe wind risk, 99% chance of damaging wind over 30y; extreme-heat days projected 7→24/yr by 2055 (HVAC capex compounding) — expect insurance premiums to compound above CPI over the hold.
Questions for the listing agent
- It's been on market 54 days. Have you received any prior offers? Is the seller open to a 3% concession, seller financing, or rate buy-down credit?
- What does the HOA fee cover, when was the last increase, and are there any pending special assessments or reserve-fund shortfalls?
- Any open or pending special assessments — roof, HVAC, plumbing, elevator, façade? What's the per-unit balance and payoff schedule, and is the seller paying it off at close or rolling it to the buyer?
- Is there a deadline driving the sale (1031 exchange, divorce, estate, relocation)? That informs how much negotiation room exists.
- Schools are D-rated, which usually means shorter tenancies and higher turnover. Who's the typical renter profile here, and what's been the actual vacancy rate?
- The area grade is low — what's the realistic commute time and amenity access for the typical tenant pool here? Any planned neighborhood developments (good or bad) we should know about?
- What's the average days-on-market for RENTAL listings here right now (not sales)? A rising rental-DOM trend means longer vacancies and softer asking-rent achievability than the comps imply.
- What's the recent tenant-quality profile in this submarket — average credit score on applications, eviction rate, late-payment / NSF rate, and stable-employment percentage? A property-management company in the area should have these aggregated.
- How much new apartment / multifamily construction is in the pipeline within 1–3 miles? Heavy new supply (>2% of stock underway) typically softens rents 12–24 months out; light construction supports rent growth.
Investment metrics
- 1% rule
- 67.75% ✓
- Cap rate
- 594.75%
- Cash-on-cash
- 2101.64%
- DSCR
- 94.51
- GRM
- 0.1
CMA / ARV
No comps found within radius.
Projected returns pro-forma
-3.0% appreciation · 0.0% rent growth · sell at horizon
- IRR
- —
- Equity multiple
- 105.00×
- Total profit
- $168,888
- Equity at exit
- $865
- IRR
- —
- Equity multiple
- 208.27×
- Total profit
- $336,610
- Equity at exit
- $501
Cash invested: $1,624 (down + closing). Projections, not guarantees.
Landlord ↔ Tenant lean methodology
- Overall (STATE)
- 87 Strongly Landlord-Friendly
- State Florida
- 87 Strongly Landlord-Friendly · R+3
- County
- — inherits STATE
- City
- — inherits STATE
ZIP-level market 33404
- Home prices YoY
- -31.1%
- Rents YoY
- -0.7%
- Active inventory
- 506
- Price-to-rent
- 0.1×
Monthly cashflow live
- Estimated rent
- $3,929 high interval (Pro) →
- Mortgage (P&I)
- −$30
- Tax est. 1.5%
- −$7 /mo · $87/yr
- Insurance
- −$2
- HOA
- −$220
- Vacancy / Maint / Mgmt
- −$825
- Net cashflow
- $2,844
Break-even live
UW: 25.0% down · 7.5% · 30yr · 1.5% tax · 5.0% vac · 8.0% maint · 8.0% mgmt
Financing live
Cash to close
- Down payment
- $1,450
- Closing costs
- $174
- Reserves months
- —
- Total cash needed
- —
Loan-product check · same deal, 3 products live
Conventional
25% down · 7.5% · 30yr
- Down + closing
- —
- Monthly P&I
- —
- Monthly cashflow
- —
- DSCR
- —
- Eligible?
- —
Personal DTI + credit; lowest rate.
DSCR
20% down · 8.5% · 30yr
- Down + closing
- —
- Monthly P&I
- —
- Monthly cashflow
- —
- DSCR
- —
- Eligible?
- —
No personal income docs; deal must DSCR.
Hard money
10% down · 12.0% · 12mo
- Down + closing
- —
- Monthly P&I
- —
- Monthly cashflow
- —
- DSCR
- —
- Eligible?
- —
Short-term bridge; refi at stabilization.
Rent comps 40 comps
| Address | Beds | Baths | Sqft | Rent | $/sqft | DOM | Units | Dist |
|---|---|---|---|---|---|---|---|---|
| 106 Linda Ln #4 Palm Beach Shores, FL | 2.0 | 2.5 | 1118 | $3,500 | $3.13 | 24d | 1 | 0.13mi |
| 125 Ocean Ave Palm Beach Shores, FL | 2.0 | 2.0 | 1082 | $3,248 | $3.00 | 4d | 2 | 0.15mi |
| 125 Ocean Ave #506 Palm Beach Shores, FL | 2.0 | 2.0 | 1064 | $3,500 | $3.29 | 3d | 1 | 0.15mi |
| 145 Ocean Ave #208 Palm Beach Shores, FL | 2.0 | 2.0 | 1191 | $3,400 | $2.85 | 7d | 1 | 0.19mi |
| 145 Ocean Ave #808 Palm Beach Shores, FL | 2.0 | 2.0 | 1191 | $6,000 | $5.04 | 24d | 1 | 0.19mi |
| 120 Inlet Way #204 Palm Beach Shores, FL | 2.0 | 2.0 | 1345 | $10,000 | $7.43 | 24d | 1 | 0.21mi |
| 300 Inlet Way #2 Palm Beach Shores, FL | 1.0 | 1.0 | 729 | $4,000 | $5.49 | 24d | 1 | 0.33mi |
| 1279 Beach Rd Unit 3 West Palm Beach, FL | 3.0 | 2.0 | 1250 | $3,250 | $2.60 | 7d | 1 | 0.38mi |
| 1236 Beach Rd Unit 3 Riviera Beach, FL | 2.0 | 1.5 | 912 | $2,950 | $3.23 | 24d | 1 | 0.42mi |
| 1236 Beach Rd Unit 4 Riviera Beach, FL | 2.0 | 1.5 | 912 | $3,170 | $3.48 | 24d | 1 | 0.42mi |
| 220 Lake Dr #206 Palm Beach Shores, FL | 2.0 | 2.0 | 1241 | $4,000 | $3.22 | 12d | 1 | 0.51mi |
| 3000 N Ocean Ave Riviera Beach, FL | 2.0 | 2.0 | 1491 | $8,250 | $5.53 | 2d | 1 | 0.54mi |
| 2800 N Ocean Dr Unit B-23c Riviera Beach, FL | 2.0 | 2.0 | 1219 | $3,500 | $2.87 | 16d | 1 | 0.62mi |
| 2800 N Ocean Dr Unit A-24d Riviera Beach, FL | 2.0 | 2.0 | 1219 | $3,000 | $2.46 | 21d | 1 | 0.62mi |
| 2800 N Ocean Dr Unit A-16D Riviera Beach, FL | 2.0 | 2.0 | 1219 | $3,200 | $2.63 | 2d | 1 | 0.62mi |
| 2800 N Ocean Dr Unit A-17C Riviera Beach, FL | 2.0 | 2.0 | 1219 | $2,950 | $2.42 | 24d | 1 | 0.62mi |
| 2800 N Ocean Dr Unit A-24d Riviera Beach, FL | 2.0 | 2.0 | 1219 | $3,000 | $2.46 | 17d | 1 | 0.62mi |
| 2800 N Ocean Dr Unit B-9D Riviera Beach, FL | 2.0 | 2.0 | 1219 | $5,000 | $4.10 | 24d | 1 | 0.62mi |
| 2800 N Ocean Dr Unit B-14d Riviera Beach, FL | 2.0 | 2.0 | 1219 | $7,500 | $6.15 | 24d | 1 | 0.62mi |
| 2800 N Ocean Dr Unit B-5c Riviera Beach, FL | 2.0 | 2.0 | 1219 | $3,500 | $2.87 | 24d | 1 | 0.62mi |
| 2800 N Ocean Dr West Palm Beach, FL | 2.0 | 2.0 | 1219 | $7,500 | $6.15 | 21d | 1 | 0.62mi |
| 2800 N Ocean Dr Unit B-12c Singer Island, FL | 2.0 | 2.0 | 1219 | $3,100 | $2.54 | 2d | 1 | 0.62mi |
| 3000 N Ocean Dr Riviera Beach, FL | 1.0–2.0 | 1.5–2.0 | 1300 | $8,500 | $6.54 | 14d | 7 | 0.68mi |
| 3000 N Ocean Dr Riviera Beach, FL | 1.0–2.0 | 1.5–2.0 | 1300 | $8,500 | $6.54 | 24d | 6 | 0.68mi |
| 3100 N Ocean Dr Unit 1002 Riviera Beach, FL | 2.0 | 2.0 | 1341 | $16,500 | $12.30 | 24d | 1 | 0.75mi |
| 3100 N Ocean Dr Unit 1210 H Riviera Beach, FL | 2.0 | 2.5 | 1457 | $13,000 | $8.92 | 7d | 1 | 0.77mi |
| 3100 N Ocean Dr #606 Riviera Beach, FL | 2.0 | 2.0 | 1456 | $9,500 | $6.52 | 24d | 1 | 0.77mi |
| 1216 Surf Rd Riviera Beach, FL | 3.0 | 2.5 | 1444 | $3,900 | $2.70 | 24d | 1 | 0.81mi |
| 3400 N Ocean Dr Riviera Beach, FL | 2.0 | 2.0–2.5 | 1597 | $7,125 | $4.46 | 2d | 7 | 0.85mi |
| 1050 Sugar Sands Blvd #174 Riviera Beach, FL | 3.0 | 2.0 | 1490 | $5,500 | $3.69 | 24d | 1 | 1.01mi |
| 1025 Sugar Sands Blvd #159 Riviera Beach, FL | 1.0 | 1.0 | 987 | $4,200 | $4.26 | 24d | 1 | 1.02mi |
| 1260 Manor Dr Riviera Beach, FL | 2.0 | 2.0 | 1230 | $4,500 | $3.66 | 20d | 1 | 1.04mi |
| 1030 Sugar Sands Blvd #171 Riviera Beach, FL | 2.0 | 2.0 | 1143 | $5,000 | $4.37 | 24d | 1 | 1.05mi |
| 400 Wilma Cir #309 Riviera Beach, FL | 1.0 | 1.0 | 818 | $4,000 | $4.89 | 5d | 1 | 1.23mi |
| 158 E 23rd St Riviera Beach, FL | 2.0 | 2.0 | 1110 | $2,900 | $2.61 | 21d | 1 | 1.24mi |
| 158 E 23rd St Riviera Beach, FL | 2.0 | 2.0 | 1110 | $2,900 | $2.61 | 24d | 1 | 1.24mi |
| 410 Wilma Cir #103 Riviera Beach, FL | 2.0 | 2.0 | 1056 | $4,000 | $3.79 | 14d | 1 | 1.27mi |
| 4200 N Ocean Dr Unit 2-101 Riviera Beach, FL | 2.0 | 2.0 | 1400 | $3,000 | $2.14 | 14d | 1 | 1.38mi |
| 4200 N Ocean Dr Unit 2-1104 Riviera Beach, FL | 2.0 | 2.0 | 1432 | $3,500 | $2.44 | 24d | 1 | 1.38mi |
| 4200 N Ocean Dr Unit 1-203 1 Riviera Beach, FL | 2.0 | 2.0 | 1400 | $3,425 | $2.45 | 5d | 1 | 1.38mi |
HOA detail condo
- Monthly dues
- $220 · $2,640/yr
- Likely covers
- poolgym
- Assessments
- None detected in remarks — confirm with the listing agent.
Listing history 16 events
-
2026-06-18days on market $5,800 Active 54 DOM
-
2026-06-17days on market $5,800 Active 53 DOM
-
2026-06-16days on market $5,800 Active 52 DOM
-
2026-06-15days on market $5,800 Active 51 DOM
-
2026-06-13days on market $5,800 Active 49 DOM
-
2026-06-09days on market $5,800 Active 45 DOM
-
2026-06-08days on market $5,800 Active 44 DOM
-
2026-06-07days on market $5,800 Active 43 DOM
-
2026-06-04days on market $5,800 Active 40 DOM
-
2026-06-03days on market $5,800 Active 39 DOM
-
2026-06-02days on market $5,800 Active 38 DOM
-
2026-06-01days on market $5,800 Active 37 DOM
-
2026-05-31days on market $5,800 Active 36 DOM
-
2026-05-26price $5,800
-
2026-05-26status Active
-
2026-01-17$6,800 Active
ⓘ Source: listings_history table (triggers on properties + properties_extension) + one-shot
backfill from property_details.listing_events for pre-trigger history.
Climate risk First Street
- Flood 6/10 Major FEMA zone X (unshaded) · 52% chance over 30 yrs
- Wildfire 1/10 Low
- Heat 10/10 Extreme 7 d/yr ≥105°F today · 24 d/yr by 30 yrs out
- Wind 10/10 Extreme 99% chance of damaging wind over 30 yrs
- Air quality 2/10 Low 2 unhealthy d/yr today · 2 by 30 yrs out
Nearby sold comps map
Loading sold comps map…
Walkable amenities ~0.75 mi
Loading nearby amenities…
Taxation est. · year 1
- Rental income
- $47,154
- − Mortgage interest
- −$325
- − Property taxes
- −$87
- − Insurance
- −$29
- − Repairs & maintenance
- −$3,772
- − Management
- −$3,772
- − HOA
- −$2,640
- − Depreciation
- −$169
- Taxable income
- $36,360
- Est. tax owed @ 24.0%
- −$8,726
- After-tax cash flow
- $25,404/yr
For passive investors: Depreciation is non-cash, so a rental often shows a tax loss while cash-flowing — sheltering income. Rental losses are passive: they offset passive income freely, and up to $25,000/yr can offset ordinary (W-2) income if you actively participate and your MAGI is under $100k (phasing out to $0 by $150k); unused losses carry forward. On sale, claimed depreciation is recaptured at up to 25%, and gains may owe capital-gains tax (a 1031 exchange can defer both). Figures are a year-1 estimate at your 24.0% rate — not tax advice; consult a CPA.
Schools (NCES district)
- District
- Palm Beach
- NCES district ID
- 1201500
- Math proficiency
- 46% ▼ -16.00%
- Reading proficiency
- 53% ▼ -4.00%
- Median HH income
- $53,943
- Composite
- 42.72/100
- National rank
- #3160
- State rank
- #34 of 73 in FL
Livability — Palm Beach Shores
- Score
- 72/100
- State rank
- #326
- US rank
- #5738
Category grades
Schools grade is shown separately in the Schools card above.
Census & demographics
- Census place
- Palm Beach Shores, FL
- County
- Palm Beach County · 1,438,312 people
- Metro
- Miami-Fort Lauderdale-Pompano Beach, FL
- Population (ZIP)
- 30,912
- Household income
- $65,063
- Rent vs Own
- Severe rent burden
- 1838.0
Population outlook (Palm Beach County) Hauer SSP2
- Today (2025)
- 1,637,487 people
- By 2030
- 1,743,255 · +6.5%
- By 2040
- 1,948,712 · +19.0%
- By 2050
- 2,132,979 · +30.3%
- By 2075
- 2,530,027 · +54.5%
- By 2100
- 2,706,979 · +65.3%
Race, ethnicity, and origin ACS 2023
- Neighborhood character
- Majority Black (64%)
- Race & ethnicity
- Black 64% White 22% Hispanic / Latino 9% Two or more races 8%
- Hispanic origin (detail)
- Mexican 1% Puerto Rican 1%
- Common ancestry
- Hispanic 8% Romanian 1% Italian 1%
- Foreign-born
- 21% · Canada, Jamaica
- Languages at home
- 82% English-only · Spanish 8% French/Haitian/Cajun 7% Other Indo-European 1%
Political lean MEDSL · Palm Beach
- 2024 margin
- Toss-up / Even · D 50.0% · R 49.2%
- 2008→2024 swing
- -22.1pp toward R · 2008: 22.9pp · 2024: 0.8pp
- All cycles
- 2024: D+0.8 2020: D+12.8 2016: D+15.3 2012: D+17.0 2008: D+22.9
Not yet ingested
- Civics
- —
Market trends
- HPI YoY
- ▼ -153.74%
- Current HPI
- 341.1761
- Rent YoY
- ▼ -0.72%
- Metro
- Miami-Fort Lauderdale-Pompano Beach, FL
- State GDP YoY
- ▲ 3.28%
- F500 in state
- 36
Industry mix (Fortune 500 HQ in FL)
| Industry | F500 HQs | Revenue |
|---|---|---|
| Industrial Technology | 2 | $29B |
|
||
| Insurance | 2 | $17B |
|
||
| Retail | 1 | $60B |
|
||
| Technology Distribution | 1 | $58B |
|
||
| Homebuilding | 1 | $35B |
|
||
| Technology Manufacturing | 1 | $35B |
|
||
Price history
-14.7% since first listed3 events — show timeline
- 2026-05-26 Price Changed $5,800 Stellar MLS as Distributed by MLS Grid
- 2026-05-26 Relisted — Stellar MLS as Distributed by MLS Grid
- 2026-01-17 Listed $6,800 Stellar MLS as Distributed by MLS Grid
Cash-flow waterfall
monthlySold comps — $/sqft
last 12 mo · ≤1 miLoading sold comps…