 Multi-family
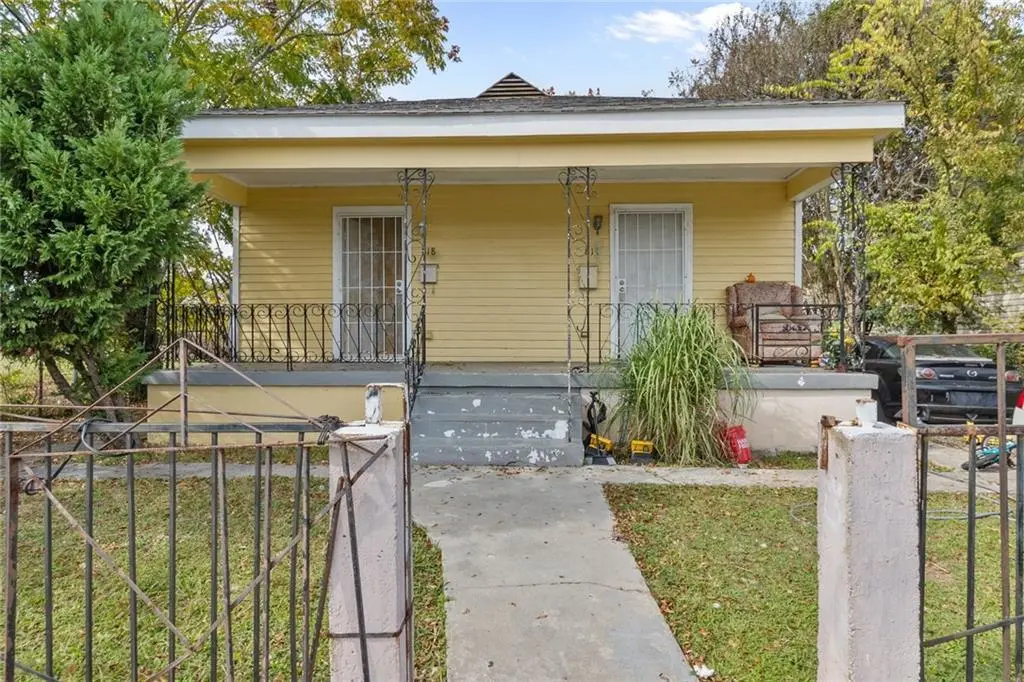
816 18 Gordon St · New Orleans, LA
Flood risk 8/10 · Major
- FEMA flood zone
- X (shaded)
- Chance of flooding over 30 yrs
- 0.6%
- Est. flood insurance / yr
- $507 – $1,088
Fire risk 1/10 · Minimal
- Est. fire insurance / yr
- $1,269 – $2,357
Heat risk 10/10 · Severe
- Hot days now (above 108°F)
- 7 days/yr
- Hot days in 30 yrs
- 22 days/yr
Wind risk 10/10 · Severe
- Chance of severe wind over 30 yrs
- 99.0%
Air-quality risk 3/10 · Minor
- Unhealthy air days now
- 3 days/yr
- Unhealthy air days in 30 yrs
- 3 days/yr
Risk factors via First Street. Map © Google.
Why this score? — see what drove the B grade
The composite is a weighted blend of 9 inputs, each scored 0–100. Each bar is that input's sub-score; the figure is the points it added to the 100-point composite (weight × sub-score).
- Cash flow +30.0/30.0
- ARV discount +10.2/15.0
- 1% rule +10.0/10.0
- DSCR +10.0/10.0
- Livability +4.0/5.0
- Rent growth +3.1/5.0
- Condition / age +2.5/5.0
- Schools +1.6/10.0
- Appreciation +0.0/10.0
$149,000
🖨 Deal sheet 📄 Offer letter ✓ Due diligence
Multi-family units
County records classify this as Multi-Family (2-4 Unit). Listing-text estimate: 1 unit. estimate disagrees with records
Listing remarks MLS
Investor Alert! Just steps from the Mississippi River in the sought-after Holy Cross neighborhood, this charming double presents a rare opportunity for both owner-occupants and investors. Each unit offers 1 generously sized bedroom and 1 full bath, blending historic character with functional living spaces. Additional highlights include convenient off-street parking and a flexible layout ideal for living in one unit while generating rental income from the other--or adding a solid asset to your investment portfolio. Located in one of the city's most picturesque riverfront communities, this property is brimming with potential. Price reflects condition, offering the perfect chance to add value and make it your own. Measurements are approximate and should be verified by the buyer and/or buyer's agent. Property is being sold As Is.
Key facts
- Mississippi river
- Flexible layout
- Off-street parking
Tags
Neighborhood map
What this means for you Summary
Snapshot
- This is a 2-bed/2.0-bath multifamily listed at $149k.
Deal economics
- At list price, monthly cash flow is $859 ($10k/yr) — positive.
- The deal already cash-flows at list — no discount required.
- Meets the 1% rule at list price ($2k rent vs $149k).
- Recommended offer: $131k (12.0% below list) — sets the bar for market timing.
- Cap rate 13.7% vs local median 4.4% in New Orleans — top-decile yield for the area; either an underpriced asset or a hidden risk that comps aren't pricing in. Stress-test before assuming the spread holds.
Location & tenants
- Location reads 81/100 on livability (#3 in LA, #1,383 nationally) — a professional / high-income tenant draw. Strengths: amenities A+, commute A+, health & safety A+; Watch: crime C-, employment D.
- Orleans Parish (urban): math 11% / reading 27% proficiency, ranked #69 of 98 in LA (top 70%) — low school quality limits family demand, transient renter base, plan for 1-2y turnover; 68% free/reduced lunch — lower-income household profile, screen leases tightly.
- Market conditions: Rents rising (+2.5%/yr); 581 active listings in the ZIP; 40 comparable units currently listed for rent nearby; rentals at typical pace (median 24d on market — plan ~3-4 weeks tenant-placement turnaround); 710 units permitted in Orleans Parish in 2024 (244 in 5+ unit buildings).
- At $2,376/mo this rent would consume 62% of the median local household income ($46k/yr) (locally 1988% of renters already pay >50% of income on rent) — very limited rent-growth headroom before tenants either downsize or default.
Forward outlook
- Local home prices are declining (-3.0%/yr); year-one equity from $1k of loan paydown is wiped out by about $4k of value loss. Plan a longer hold.
- Orleans County population projected at +61% by 2050 — long-run rental-demand tailwind backs the buy-and-hold thesis.
- At projected returns (-3.0% appreciation + 2.5% rent growth), your $42k cash investment doubles in ~6 years — after that, you're playing with house money.
Negotiation context
- It's been on market 187 days — a 12% lower offer ($131k) is reasonable based on typical stale-listing flexibility.
- 6 sale attempts since 15y ago with the ask held roughly flat each time — persistent listings suggest the price (not the market) is what's stuck; bring a comps-based counter.
- Current owner paid $18k; list at $149k implies a 742% gain — meaningful room to come down on a strong offer.
Risks & watch-outs
- Watch-outs: flood insurance adds $66/mo.
- Climate carrying-cost: severe flood risk; severe wind risk, 99% chance of damaging wind over 30y; extreme-heat days projected 7→22/yr by 2055 (HVAC capex compounding) — expect insurance premiums to compound above CPI over the hold.
Questions for the listing agent
- It's been on market 187 days. Have you received any prior offers? Is the seller open to a 12% concession, seller financing, or rate buy-down credit?
- Built in 1960 — when were the roof, HVAC, electrical panel, plumbing, and water heater last replaced?
- What's the actual annual flood-insurance premium (NFIP or private), and is the property in a SFHA with mandatory coverage?
- Why hasn't it sold? Are there any deal-killer items the seller is aware of (foundation, flood, title, zoning, code violations)?
- Is there a deadline driving the sale (1031 exchange, divorce, estate, relocation)? That informs how much negotiation room exists.
- What's the average days-on-market for RENTAL listings here right now (not sales)? A rising rental-DOM trend means longer vacancies and softer asking-rent achievability than the comps imply.
- What's the recent tenant-quality profile in this submarket — average credit score on applications, eviction rate, late-payment / NSF rate, and stable-employment percentage? A property-management company in the area should have these aggregated.
- How much new apartment / multifamily construction is in the pipeline within 1–3 miles? Heavy new supply (>2% of stock underway) typically softens rents 12–24 months out; light construction supports rent growth.
Investment metrics
- 1% rule
- 1.59% ✓
- Cap rate
- 13.75%
- Cash-on-cash
- 26.62%
- DSCR
- 2.18
- GRM
- 5.2
CMA / ARV
- ARV (median comp)
- $158,364
- List price
- $149,000
- Delta
- -5.91%
- Verdict
- FAIR
- Comps
- 20 within 1.0 mi
Show comp detail 2 sales within ~0.75 mi
| Address | Dist | Beds/Ba | Sqft | Sold | Price | $/sf | Match |
|---|---|---|---|---|---|---|---|
| 705 Charbonnet St | 0.10mi | 2/2.0 | 1,300 (+4%) | 12mo | $80,000 | $62 | 78 |
| 301 03 Tricou St | 0.41mi | 2/2.0 | 1,377 (+10%) | 10mo | $66,500 | $48 | 55 |
Match score weights: distance 35% · size 25% · config 20% · recency 20%. Top-matched comps best support the ARV.
Projected returns pro-forma
-3.0% appreciation · 2.49% rent growth · sell at horizon
- IRR
- 17.5%
- Equity multiple
- 1.70×
- Total profit
- $29,375
- Equity at exit
- $22,216
- IRR
- 25.6%
- Equity multiple
- 3.19×
- Total profit
- $91,208
- Equity at exit
- $12,883
Cash invested: $41,720 (down + closing). Projections, not guarantees.
Landlord ↔ Tenant lean methodology
- Overall (STATE)
- 90 Strongly Landlord-Friendly
- State Louisiana
- 90 Strongly Landlord-Friendly · R+12
- County
- — inherits STATE
- City
- — inherits STATE
ZIP-level market 70117
- Rents YoY
- 2.5%
- Active inventory
- 581
- Price-to-rent
- 10.4×
Monthly cashflow live
- Estimated rent
- $2,376 high interval (Pro) →
- Mortgage (P&I)
- −$781
- Tax from tax record
- −$108 /mo · $1,299/yr
- Insurance
- −$62
- Flood insurance flood zone
- −$66 /mo · $798/yr
- HOA
- −$0
- Vacancy / Maint / Mgmt
- −$499
- Net cashflow
- $859
Break-even live
2-unit breakdown (identical units grouped — click to expand)
| Units | Beds | Baths | Est. rent |
|---|---|---|---|
| 2× units | 1 | 1 | $2,376 |
| #1 | 1 | 1 | $1,188 |
| #2 | 1 | 1 | $1,188 |
| Total (2 units) | $2,376 | ||
UW: 25.0% down · 7.5% · 30yr · 1.5% tax · 5.0% vac · 8.0% maint · 8.0% mgmt
Financing live
Cash to close
- Down payment
- $37,250
- Closing costs
- $4,470
- Reserves months
- —
- Total cash needed
- —
Loan-product check · same deal, 3 products live
Conventional
25% down · 7.5% · 30yr
- Down + closing
- —
- Monthly P&I
- —
- Monthly cashflow
- —
- DSCR
- —
- Eligible?
- —
Personal DTI + credit; lowest rate.
DSCR
20% down · 8.5% · 30yr
- Down + closing
- —
- Monthly P&I
- —
- Monthly cashflow
- —
- DSCR
- —
- Eligible?
- —
No personal income docs; deal must DSCR.
Hard money
10% down · 12.0% · 12mo
- Down + closing
- —
- Monthly P&I
- —
- Monthly cashflow
- —
- DSCR
- —
- Eligible?
- —
Short-term bridge; refi at stabilization.
Rent comps 40 comps
| Address | Beds | Baths | Sqft | Rent | $/sqft | DOM | Units | Dist |
|---|---|---|---|---|---|---|---|---|
| 6019 Royal St New Orleans, LA | 2.0 | 1.0 | 790 | $1,200 | $1.52 | 24d | 1 | 0.12mi |
| 6038 N Rampart St New Orleans, LA | 3.0 | 2.0 | 1080 | $1,795 | $1.66 | 24d | 1 | 0.13mi |
| 6002 Saint Claude Ave New Orleans, LA | 2.0 | 2.0 | 965 | $1,275 | $1.32 | 21d | 1 | 0.18mi |
| 5805 Saint Claude Ave New Orleans, LA | 2.0 | 1.0 | 800 | $1,200 | $1.50 | 24d | 1 | 0.21mi |
| 906 Flood St New Orleans, LA | 3.0 | 3.0 | 1174 | $1,700 | $1.45 | 2d | 1 | 0.25mi |
| 5450 Burgundy St New Orleans, LA | 2.0 | 1.0 | 1474 | $1,250 | $0.85 | 24d | 1 | 0.26mi |
| 1201 Gordon St New Orleans, LA | 3.0 | 2.5 | 1367 | $1,900 | $1.39 | 17d | 1 | 0.26mi |
| 716 Delery St Unit 716 New Orleans, LA | 2.0 | 1.0 | 900 | $1,200 | $1.33 | 24d | 1 | 0.30mi |
| 18 Saint Claude Ct New Orleans, LA | 3.0 | 1.0 | 864 | $1,200 | $1.39 | 12d | 1 | 0.30mi |
| 1301 Lamanche St New Orleans, LA | 3.0 | 2.0 | 1090 | $1,600 | $1.47 | 3d | 1 | 0.34mi |
| 1301 Lamanche St New Orleans, LA | 3.0 | 2.0 | 1178 | $1,600 | $1.36 | 24d | 1 | 0.34mi |
| 1301 Lamanche St New Orleans, LA | 3.0 | 2.0 | 1090 | $1,600 | $1.47 | 3d | 1 | 0.34mi |
| 5434 Chartres St New Orleans, LA | 2.0 | 1.0 | 800 | $1,150 | $1.44 | 24d | 1 | 0.34mi |
| 1327 Fats Domino Ave Unit A New Orleans, LA | 3.0 | 2.0 | 1200 | $1,900 | $1.58 | 3d | 1 | 0.40mi |
| 1334 Tricou St New Orleans, LA | 2.0 | 1.0 | 1117 | $1,500 | $1.34 | 21d | 1 | 0.44mi |
| 6530 Royal St Arabi, LA | 2.0 | 2.0 | 860 | $1,550 | $1.80 | 44d | 1 | 0.45mi |
| 1015 Government St Unit 11 Arabi, LA | 2.0 | 1.0 | 720 | $999 | $1.39 | 44d | 1 | 0.46mi |
| 6608 Dauphine St Arabi, LA | 2.0 | 1.0 | 989 | $1,395 | $1.41 | 10d | 1 | 0.48mi |
| 6608 Dauphine St Unit 6608 Arabi, LA | 2.0 | 1.0 | 989 | $1,325 | $1.34 | 3d | 1 | 0.48mi |
| 5109 Burgundy St New Orleans, LA | 2.0 | 1.0 | 1122 | $1,474 | $1.31 | 17d | 1 | 0.50mi |
| 1420 Delery St New Orleans, LA | 2.0 | 1.0 | 900 | $1,250 | $1.39 | 12d | 1 | 0.52mi |
| 617 Forstall St New Orleans, LA | 3.0 | 2.0 | 1262 | $2,200 | $1.74 | 3d | 1 | 0.52mi |
| 816 Forstall St New Orleans, LA | 3.0 | 1.0 | 850 | $1,600 | $1.88 | 24d | 1 | 0.53mi |
| 918 Forstall St New Orleans, LA | 2.0 | 1.0 | 800 | $2,290 | $2.86 | 24d | 1 | 0.53mi |
| 920 Forstall St New Orleans, LA | 2.0 | 1.0 | 800 | $1,600 | $2.00 | 24d | 1 | 0.53mi |
| 1422 Andry St New Orleans, LA | 3.0 | 2.0 | 1100 | $1,400 | $1.27 | 3d | 1 | 0.55mi |
| 1449 Andry St New Orleans, LA | 2.0 | 1.0 | 833 | $1,300 | $1.56 | 24d | 1 | 0.56mi |
| 619 Reynes St New Orleans, LA | 3.0 | 2.0 | 1318 | $2,100 | $1.59 | 16d | 1 | 0.58mi |
| 5900 N Derbigny St Unit 1 New Orleans, LA | 3.0 | 2.0 | 1000 | $1,950 | $1.95 | 3d | 1 | 0.60mi |
| 1333 Angela Ave Arabi, LA | 3.0 | 2.0 | 1090 | $1,850 | $1.70 | 3d | 1 | 0.61mi |
| 4950 Dauphine St New Orleans, LA | 1.0 | 1.0 | 612 | $1,750 | $2.86 | 10d | 16 | 0.63mi |
| 1714 Tricou St New Orleans, LA | 3.0 | 2.0 | 1271 | $1,900 | $1.49 | 24d | 1 | 0.68mi |
| 4826 N Rampart St Unit 4826 New Orleans, LA | 2.0 | 1.0 | 850 | $1,200 | $1.41 | 24d | 1 | 0.70mi |
| 1137 Deslonde St New Orleans, LA | 2.0 | 1.0 | 1017 | $1,500 | $1.47 | 24d | 1 | 0.71mi |
| 4801 Dauphine St Unit B New Orleans, LA | 2.0 | 1.0 | 875 | $1,100 | $1.26 | 24d | 1 | 0.74mi |
| 1810 Fats Domino Ave New Orleans, LA | 2.0 | 2.0 | 975 | $916 | $0.94 | 24d | 1 | 0.74mi |
| 438 Friscoville Ave Arabi, LA | 3.0 | 2.0 | 1500 | $3,200 | $2.13 | 3d | 1 | 0.74mi |
| 616 Lebeau St Unit A Arabi, LA | 2.0 | 1.0 | 1205 | $1,650 | $1.37 | 44d | 1 | 0.77mi |
| 1925 Alabo St Unit A New Orleans, LA | 3.0 | 2.0 | 1199 | $1,500 | $1.25 | 21d | 1 | 0.78mi |
| 1835 Andry St New Orleans, LA | 3.0 | 2.0 | 918 | $1,800 | $1.96 | 24d | 1 | 0.80mi |
Listing history 21 events
-
2026-06-18days on market $149,000 Active 187 DOM
-
2026-06-17days on market $149,000 Active 186 DOM
-
2026-06-16days on market $149,000 Active 185 DOM
-
2026-06-15days on market $149,000 Active 184 DOM
-
2026-06-13days on market $149,000 Active 182 DOM
-
2026-06-10days on market $149,000 Active 179 DOM
-
2026-06-09days on market $149,000 Active 178 DOM
-
2026-06-08days on market $149,000 Active 177 DOM
-
2026-06-07days on market $149,000 Active 176 DOM
-
2026-06-05days on market $149,000 Active 173 DOM
-
2026-06-03days on market $149,000 Active 172 DOM
-
2026-06-02days on market $149,000 Active 171 DOM
-
2026-06-01days on market $149,000 Active 170 DOM
-
2026-05-31days on market $149,000 Active 169 DOM
-
2025-12-13$149,000 Active 837-char remark
Show marketing remark (854 chars)
Investor Alert! Just steps from the Mississippi River in the sought-after Holy Cross neighborhood, this charming double presents a rare opportunity for both owner-occupants and investors. Each unit offers 1 generously sized bedroom and 1 full bath, blending historic character with functional living spaces. Additional highlights include convenient off-street parking and a flexible layout ideal for living in one unit while generating rental income from the other—or adding a solid asset to your investment portfolio. Located in one of the city’s most picturesque riverfront communities, this property is brimming with potential. Price reflects condition, offering the perfect chance to add value and make it your own. Measurements are approximate and should be verified by the buyer and/or buyer’s agent. Property is being sold As Is.
-
2025-12-13$149,000 Active 854-char remark
Show marketing remark (854 chars)
Investor Alert! Just steps from the Mississippi River in the sought-after Holy Cross neighborhood, this charming double presents a rare opportunity for both owner-occupants and investors. Each unit offers 1 generously sized bedroom and 1 full bath, blending historic character with functional living spaces. Additional highlights include convenient off-street parking and a flexible layout ideal for living in one unit while generating rental income from the other—or adding a solid asset to your investment portfolio. Located in one of the city’s most picturesque riverfront communities, this property is brimming with potential. Price reflects condition, offering the perfect chance to add value and make it your own. Measurements are approximate and should be verified by the buyer and/or buyer’s agent. Property is being sold As Is.
-
2011-11-19$89,000
-
2011-11-19$89,000
-
2011-05-19$89,000
-
2011-05-19$89,000
-
1977-06-23soldstatus $17,700
ⓘ Source: listings_history table (triggers on properties + properties_extension) + one-shot
backfill from property_details.listing_events for pre-trigger history.
Tax reassessment forecast LA · Resets to sale price
- Current annual tax
- $1,299 · $108/mo
- Projected year-2 tax
- $1,299 · $108/mo
- Expected delta
- $0/yr ($0/mo · 0.0%)
ⓘ Screening estimate from a state-policy table — verify with the county assessor before closing.
Climate risk First Street
- Flood 8/10 Severe FEMA zone X (shaded) · 60% chance over 30 yrs
- Wildfire 1/10 Low
- Heat 10/10 Extreme 7 d/yr ≥108°F today · 22 d/yr by 30 yrs out
- Wind 10/10 Extreme 99% chance of damaging wind over 30 yrs
- Air quality 3/10 Moderate 3 unhealthy d/yr today · 3 by 30 yrs out
Nearby sold comps map
Loading sold comps map…
Walkable amenities ~0.75 mi
Loading nearby amenities…
Taxation est. · year 1
- Rental income
- $28,512
- − Mortgage interest
- −$8,346
- − Property taxes
- −$1,299
- − Insurance
- −$1,542
- − Repairs & maintenance
- −$2,281
- − Management
- −$2,281
- − Depreciation
- −$4,335
- Taxable income
- $8,428
- Est. tax owed @ 24.0%
- −$2,023
- After-tax cash flow
- $8,284/yr
For passive investors: Depreciation is non-cash, so a rental often shows a tax loss while cash-flowing — sheltering income. Rental losses are passive: they offset passive income freely, and up to $25,000/yr can offset ordinary (W-2) income if you actively participate and your MAGI is under $100k (phasing out to $0 by $150k); unused losses carry forward. On sale, claimed depreciation is recaptured at up to 25%, and gains may owe capital-gains tax (a 1031 exchange can defer both). Figures are a year-1 estimate at your 24.0% rate — not tax advice; consult a CPA.
Schools (NCES district)
- District
- Orleans Parish
- NCES district ID
- 2201170
- Math proficiency
- 11% ▼ -52.00%
- Reading proficiency
- 27% ▼ -46.00%
- Median HH income
- $37,011
- Composite
- 15.78/100
- National rank
- #9271
- State rank
- #69 of 98 in LA
Livability — New Orleans
- Score
- 81/100
- State rank
- #3
- US rank
- #1383
Category grades
Schools grade is shown separately in the Schools card above.
Census & demographics
- Census place
- New Orleans, LA
- County
- Orleans Parish · 338,817 people
- City population
- 338,817
- Metro
- New Orleans-Metairie, LA
- Population (ZIP)
- 25,652
- Household income
- $45,764
- Rent vs Own
- Severe rent burden
- 1988.0
Population outlook (Orleans County) Hauer SSP2
- Today (2025)
- 513,025 people
- By 2030
- 575,781 · +12.2%
- By 2040
- 700,174 · +36.5%
- By 2050
- 826,541 · +61.1%
- By 2075
- 1,123,374 · +119.0%
- By 2100
- 1,355,609 · +164.2%
Race, ethnicity, and origin ACS 2023
- Neighborhood character
- Majority Black (60%)
- Race & ethnicity
- Black 60% White 30% Two or more races 6% Hispanic / Latino 5%
- Common ancestry
- Lithuanian 5% Italian 1% Romanian 1%
- Foreign-born
- 5% · Canada, South Korea
- Languages at home
- 93% English-only · Spanish 3% Other Indo-European 1% French/Haitian/Cajun 1%
Political lean MEDSL · Orleans
- 2024 margin
- Solid D (+67.0) · D 82.2% · R 15.2% · Other 2.7%
- 2008→2024 swing
- +6.7pp toward D · 2008: 60.3pp · 2024: 67.0pp
- All cycles
- 2024: D+67.0 2020: D+68.2 2016: D+66.2 2012: D+62.5 2008: D+60.3
Not yet ingested
- Civics
- —
Market trends
- HPI YoY
- ▼ -177.22%
- Current HPI
- 184.6061
- Rent YoY
- ▲ 2.49%
- Metro
- New Orleans-Metairie, LA
- State GDP YoY
- ▲ 3.29%
- F500 in state
- 10
Industry mix (Fortune 500 HQ in LA)
| Industry | F500 HQs | Revenue |
|---|---|---|
| Telecommunications | 2 | $23B |
|
||
| Utilities | 1 | $12B |
|
||
| Wholesale / Distribution | 1 | $5B |
|
||
| Advertising | 1 | $2B |
|
||
Price history
+741.8% since first listed7 events — show timeline
- 2025-12-13 Listed $149,000 GSREIN
- 2025-12-13 Listed $149,000 AcadianaMLS
- 2011-11-19 Listed $89,000 GSREIN
- 2011-11-19 Listed $89,000 AcadianaMLS
- 2011-05-19 Listed $89,000 GSREIN
- 2011-05-19 Listed $89,000 AcadianaMLS
- 1977-06-23 Sold (Public Records) $17,700 Public Records
Property tax history
-0.0%/yrLatest (2026): $1,299 · +1.1% YoY. Source: county tax records.
Cash-flow waterfall
monthlySold comps — $/sqft
last 12 mo · ≤1 miLoading sold comps…