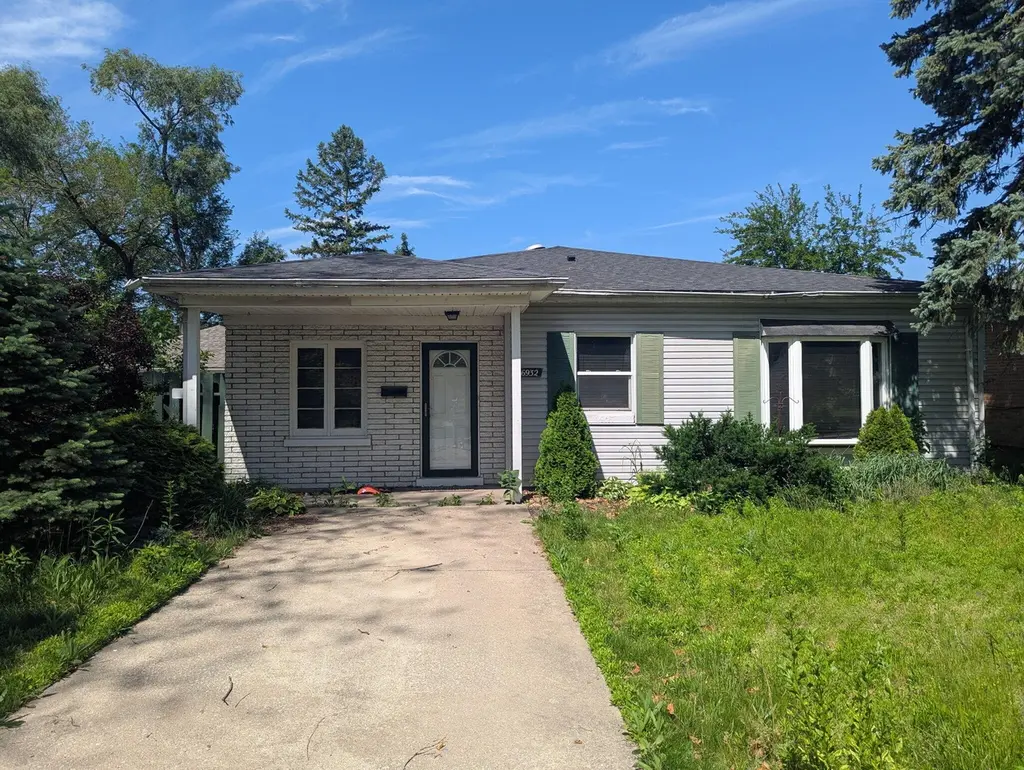
6932 Schneider Ave · Hammond, IN
Flood risk 1/10 · Minimal
- FEMA flood zone
- X (unshaded)
- Chance of flooding over 30 yrs
- 0.0%
- Est. flood insurance / yr
- $473 – $860
Fire risk 1/10 · Minimal
- Est. fire insurance / yr
- $717 – $1,331
Heat risk 3/10 · Minor
- Hot days now (above 102°F)
- 7 days/yr
- Hot days in 30 yrs
- 15 days/yr
Wind risk 2/10 · Minimal
- Chance of severe wind over 30 yrs
- 1.0%
Air-quality risk 4/10 · Minor
- Unhealthy air days now
- 5 days/yr
- Unhealthy air days in 30 yrs
- 6 days/yr
Risk factors via First Street. Map © Google.
Why this score? — see what drove the C+ grade
The composite is a weighted blend of 9 inputs, each scored 0–100. Each bar is that input's sub-score; the figure is the points it added to the 100-point composite (weight × sub-score).
- Cash flow +25.0/30.0
- ARV discount +15.0/15.0
- DSCR +8.2/10.0
- 1% rule +6.6/10.0
- Livability +3.5/5.0
- Rent growth +2.5/5.0
- Condition / age +2.5/5.0
- Schools +1.1/10.0
- Appreciation +0.0/10.0
$150,000
🖨 Deal sheet 📄 Offer letter ✓ Due diligence
Listing remarks MLS
MOTIVATED SELLER!!! This 3 bedroom/1 bathroom home awaits its new owner. Located minutes away from Purdue Calumet, this home has a large living room, nicely sized eat-in kitchen with plenty of cupboards and cabinets throughout, and a dining area. The master bedroom hosts 2 closet areas with an office or an extra room that can be easily converted into additional walk-in closet. The bathroom updates feature a tempered glass vanity sink bowl with a waterproof stained hardwood countertop and extra cabinetry. The oversized 2 car garage is wide and deep and has a large overhead heater BUT it's unknown if it currently works, since it has never been used. Conveniently minutes from restaurants, convenient stores, parks, and the expressway. LOW TAXES!! A must see to appreciate.
Key facts
- 6,804 sq ft lot
- 2 garage spots
- Built 1953
Neighborhood map
What this means for you Summary
Snapshot
- This is a 2-bed/1.0-bath single-family listed at $150k.
Deal economics
- At list price, monthly cash flow is $328 ($4k/yr) — positive.
- The deal already cash-flows at list — no discount required.
- Meets the 1% rule at list price ($2k rent vs $150k).
- Cap rate 8.9% vs local median 5.8% in Hammond — top-decile yield for the area; either an underpriced asset or a hidden risk that comps aren't pricing in. Stress-test before assuming the spread holds.
Location & tenants
- Location reads 70/100 on livability (#143 in IN) — a middle-class / working-renter tenant base. Strengths: cost of living A+, housing A+, commute A; Watch: health & safety D+, employment D, schools F.
- School City Of Hammond (suburban): math 8% / reading 18% proficiency, ranked #289 of 301 in IN (top 96%) — low school quality limits family demand, transient renter base, plan for 1-2y turnover; 74% free/reduced lunch — lower-income household profile, screen leases tightly.
- Market conditions: 59 active listings in the ZIP; 3 comparable units currently listed for rent nearby; rentals leasing fast (median 4d on market — plan ~1-2 weeks tenant-placement turnaround); 1,642 units permitted in Lake County in 2024 (14 in 5+ unit buildings).
- This rent runs 35% of the median local income ($60k/yr) — at the standard rent-burdened threshold; future hikes will face affordability resistance.
Forward outlook
- Local home prices are declining (-3.0%/yr); year-one equity from $1k of loan paydown is wiped out by about $4k of value loss. Plan a longer hold.
- Lake County population projected to shrink 7% by 2050 — rents likely to lag national; underwrite the cash flow, not the appreciation.
Negotiation context
- Only 0 days on market — expect competitive offers; lowballing is unlikely to land.
- 5 sale attempts since 26y ago with the ask held roughly flat each time — persistent listings suggest the price (not the market) is what's stuck; bring a comps-based counter.
Risks & watch-outs
- Watch-outs: built in 1953 — expect roof / HVAC / electrical / plumbing capex.
Questions for the listing agent
- Built in 1953 — when were the roof, HVAC, electrical panel, plumbing, and water heater last replaced?
- Is there a deadline driving the sale (1031 exchange, divorce, estate, relocation)? That informs how much negotiation room exists.
- Schools are F-rated, which usually means shorter tenancies and higher turnover. Who's the typical renter profile here, and what's been the actual vacancy rate?
- Crime grade is F in this area — have there been break-ins, vandalism, or insurance claims at this property in the last 3 years? What carrier currently insures it and at what premium?
- What's the average days-on-market for RENTAL listings here right now (not sales)? A rising rental-DOM trend means longer vacancies and softer asking-rent achievability than the comps imply.
- What's the recent tenant-quality profile in this submarket — average credit score on applications, eviction rate, late-payment / NSF rate, and stable-employment percentage? A property-management company in the area should have these aggregated.
- How much new for-sale + rental construction is in the pipeline within 1–3 miles? Heavy new supply typically softens prices + rents 12–24 months out; constrained supply supports both.
Investment metrics
- 1% rule
- 1.16% ✓
- Cap rate
- 8.92%
- Cash-on-cash
- 9.38%
- DSCR
- 1.42
- GRM
- 7.2
CMA / ARV
- ARV (on-the-fly)
- $233,168
- Comps found
- 12
Show comp detail 12 sales within ~0.75 mi
| Address | Dist | Beds/Ba | Sqft | Sold | Price | $/sf | Match |
|---|---|---|---|---|---|---|---|
| 6739 Ontario Ave | 0.26mi | 3/2.0 (+1) | 1,560 (+2%) | 1mo | $312,000 | $200 | 75 |
| 6824 Ontario Ave | 0.20mi | 3/2.0 (+1) | 1,537 (+0%) | 9mo | $143,000 | $93 | 74 |
| 7149 Ontario Ave | 0.30mi | 3/2.0 (+1) | 1,488 (-3%) | 0mo | $250,000 | $168 | 72 |
| 7141 Ontario Ave | 0.28mi | 3/1.0 (+1) | 1,584 (+3%) | 8mo | $240,000 | $152 | 70 |
| 6628 Alexander Ave | 0.50mi | 3/2.0 (+1) | 1,536 (+0%) | 3mo | $162,000 | $105 | 64 |
| 7345 Woodmar Ave | 0.60mi | 3/1.5 (+1) | 1,550 (+1%) | 5mo | $255,000 | $165 | 60 |
| 7125 Lindberg Ave | 0.28mi | 3/2.0 (+1) | 1,400 (-9%) | 6mo | $240,000 | $171 | 58 |
| 7344 Woodmar Ave | 0.61mi | 3/1.5 (+1) | 1,488 (-3%) | 2mo | $290,000 | $195 | 58 |
| 7231 Olcott Ave | 0.59mi | 2/2.0 | 1,650 (+8%) | 3mo | $223,000 | $135 | 54 |
| 6723 Baring Ave | 0.71mi | 3/1.0 (+1) | 1,450 (-6%) | 4mo | $185,900 | $128 | 49 |
| 7401 S Mccook Ave | 0.62mi | 3/1.0 (+1) | 1,710 (+12%) | 1mo | $215,000 | $126 | 46 |
| 7045 California Ave | 0.74mi | 3/1.0 (+1) | 1,682 (+10%) | 8mo | $190,000 | $113 | 38 |
Match score weights: distance 35% · size 25% · config 20% · recency 20%. Top-matched comps best support the ARV.
Projected returns pro-forma
-3.0% appreciation · 3.0% rent growth · sell at horizon
- IRR
- -2.1%
- Equity multiple
- 0.92×
- Total profit
- $-3,360
- Equity at exit
- $22,365
- IRR
- 7.6%
- Equity multiple
- 1.57×
- Total profit
- $24,130
- Equity at exit
- $12,969
Cash invested: $42,000 (down + closing). Projections, not guarantees.
Landlord ↔ Tenant lean methodology
- Overall (STATE)
- 90 Strongly Landlord-Friendly
- State Indiana
- 90 Strongly Landlord-Friendly · R+11
- County
- — inherits STATE
- City
- — inherits STATE
ZIP-level market 46323
- Home prices YoY
- -18.8%
- Active inventory
- 59
- Price-to-rent
- 7.2×
Monthly cashflow live
- Estimated rent
- $1,737 medium interval (Pro) →
- Mortgage (P&I)
- −$787
- Tax from tax record
- −$195 /mo · $2,335/yr
- Insurance
- −$62
- HOA
- −$0
- Vacancy / Maint / Mgmt
- −$365
- Net cashflow
- $328
Break-even live
UW: 25.0% down · 7.5% · 30yr · 1.5% tax · 5.0% vac · 8.0% maint · 8.0% mgmt
Financing live
Cash to close
- Down payment
- $37,500
- Closing costs
- $4,500
- Reserves months
- —
- Total cash needed
- —
Loan-product check · same deal, 3 products live
Conventional
25% down · 7.5% · 30yr
- Down + closing
- —
- Monthly P&I
- —
- Monthly cashflow
- —
- DSCR
- —
- Eligible?
- —
Personal DTI + credit; lowest rate.
DSCR
20% down · 8.5% · 30yr
- Down + closing
- —
- Monthly P&I
- —
- Monthly cashflow
- —
- DSCR
- —
- Eligible?
- —
No personal income docs; deal must DSCR.
Hard money
10% down · 12.0% · 12mo
- Down + closing
- —
- Monthly P&I
- —
- Monthly cashflow
- —
- DSCR
- —
- Eligible?
- —
Short-term bridge; refi at stabilization.
Rent comps 3 comps
| Address | Beds | Baths | Sqft | Rent | $/sqft | DOM | Units | Dist |
|---|---|---|---|---|---|---|---|---|
| 6949 Alabama Ave Hammond, IN | 2.0 | 1.5 | 1200 | $1,795 | $1.50 | 4d | 1 | 0.51mi |
| 7019 Chestnut Ave Hammond, IN | 3.0 | 1.5 | 1440 | $1,895 | $1.32 | 21d | 1 | 1.30mi |
| 7202 Chestnut Ave Hammond, IN | 3.0 | 2.0 | 2178 | $1,900 | $0.87 | 1d | 1 | 1.36mi |
Listing history 2 events
-
2026-06-02remarks 159-char remark
-
2026-06-02$150,000 Pending
ⓘ Source: listings_history table (triggers on properties + properties_extension) + one-shot
backfill from property_details.listing_events for pre-trigger history.
Tax reassessment forecast IN · Partial reset (capped growth)
- Current annual tax
- $2,335 · $195/mo
- Projected year-2 tax
- $2,335 · $195/mo
- Expected delta
- $0/yr ($0/mo · 0.0%)
ⓘ Screening estimate from a state-policy table — verify with the county assessor before closing.
Climate risk First Street
- Flood 1/10 Low FEMA zone X (unshaded) · 0% chance over 30 yrs
- Wildfire 1/10 Low
- Heat 3/10 Moderate 7 d/yr ≥102°F today · 15 d/yr by 30 yrs out
- Wind 2/10 Low 100% chance of damaging wind over 30 yrs
- Air quality 4/10 Moderate 5 unhealthy d/yr today · 6 by 30 yrs out
Nearby sold comps map
Loading sold comps map…
Walkable amenities ~0.75 mi
Loading nearby amenities…
Taxation est. · year 1
- Rental income
- $20,841
- − Mortgage interest
- −$8,402
- − Property taxes
- −$2,335
- − Insurance
- −$750
- − Repairs & maintenance
- −$1,667
- − Management
- −$1,667
- − Depreciation
- −$4,364
- Taxable income
- $1,656
- Est. tax owed @ 24.0%
- −$398
- After-tax cash flow
- $3,543/yr
For passive investors: Depreciation is non-cash, so a rental often shows a tax loss while cash-flowing — sheltering income. Rental losses are passive: they offset passive income freely, and up to $25,000/yr can offset ordinary (W-2) income if you actively participate and your MAGI is under $100k (phasing out to $0 by $150k); unused losses carry forward. On sale, claimed depreciation is recaptured at up to 25%, and gains may owe capital-gains tax (a 1031 exchange can defer both). Figures are a year-1 estimate at your 24.0% rate — not tax advice; consult a CPA.
Schools (NCES district)
- District
- School City Of Hammond
- NCES district ID
- 1804320
- Math proficiency
- 8% ▼ -18.00%
- Reading proficiency
- 18% ▼ -15.00%
- Median HH income
- $39,970
- Composite
- 11.11/100
- National rank
- #9730
- State rank
- #289 of 301 in IN
Livability — Hammond
- Score
- 70/100
- State rank
- #143
- US rank
- #7343
Category grades
Schools grade is shown separately in the Schools card above.
Census & demographics
- Census place
- Hammond, IN
- County
- Lake County · 422,878 people
- City population
- 58,809
- Metro
- Chicago-Naperville-Elgin, IL-IN-WI
- Population (ZIP)
- 23,047
- Household income
- $59,688
- Rent vs Own
- Severe rent burden
- 692.0
Population outlook (Lake County) Hauer SSP2
- Today (2025)
- 484,026 people
- By 2030
- 478,091 · -1.2%
- By 2040
- 462,974 · -4.3%
- By 2050
- 449,894 · -7.1%
- By 2075
- 436,169 · -9.9%
- By 2100
- 426,607 · -11.9%
Race, ethnicity, and origin ACS 2023
- Neighborhood character
- Diverse neighborhood (Simpson 0.68)
- Race & ethnicity
- Hispanic / Latino 38% White 36% Black 21% Two or more races 12% Asian 2% Native American 1%
- Hispanic origin (detail)
- Mexican 29% Puerto Rican 7%
- Common ancestry
- Romanian 6% Italian 2% Lithuanian 1%
- Foreign-born
- 8% · Canada, China
- Languages at home
- 78% English-only · Spanish 19% Chinese 1%
Political lean MEDSL · Lake
- 2024 margin
- Lean D (+5.6) · D 52.1% · R 46.5% · Other 1.5%
- 2008→2024 swing
- -28.6pp toward R · 2008: 34.3pp · 2024: 5.6pp
- All cycles
- 2024: D+5.6 2020: D+15.1 2016: D+20.6 2012: D+31.0 2008: D+34.3
Not yet ingested
- Civics
- —
Market trends
- HPI YoY
- ▼ -67.70%
- Current HPI
- 293.4702
- Rent YoY
- —
- Metro
- Chicago-Naperville-Elgin, IL-IN-WI
- State GDP YoY
- ▲ 2.90%
- F500 in state
- 18
Industry mix (Fortune 500 HQ in IN)
| Industry | F500 HQs | Revenue |
|---|---|---|
| Industrial Machinery | 2 | $37B |
|
||
| Healthcare | 1 | $177B |
|
||
| Pharmaceuticals | 1 | $45B |
|
||
| Metals / Steel | 1 | $18B |
|
||
| Agriculture | 1 | $17B |
|
||
| Packaging | 1 | $12B |
|
||
Price history
+76.5% since first listed9 events — show timeline
- 2026-06-01 Listing Removed — NIRA MLS as Distributed by MLS Grid
- 2026-06-01 Listed $150,000 NIRA MLS as Distributed by MLS Grid
- 2024-10-17 Sold (MLS) $225,000 NIRA MLS as Distributed by MLS Grid
- 2024-09-11 Contingent — NIRA MLS as Distributed by MLS Grid
- 2024-08-23 Relisted — NIRA MLS as Distributed by MLS Grid
- 2024-07-30 Contingent — NIRA MLS as Distributed by MLS Grid
- 2024-07-17 Listed $219,900 NIRA MLS as Distributed by MLS Grid
- 2001-08-06 Listed $84,900 NIRA MLS as Distributed by MLS Grid
- 2000-08-21 Listed $85,000 NIRA MLS as Distributed by MLS Grid
Property tax history
+1.5%/yrLatest (2024): $2,335 · -9.3% YoY. Source: county tax records.
Cash-flow waterfall
monthlySold comps — $/sqft
last 12 mo · ≤1 miLoading sold comps…