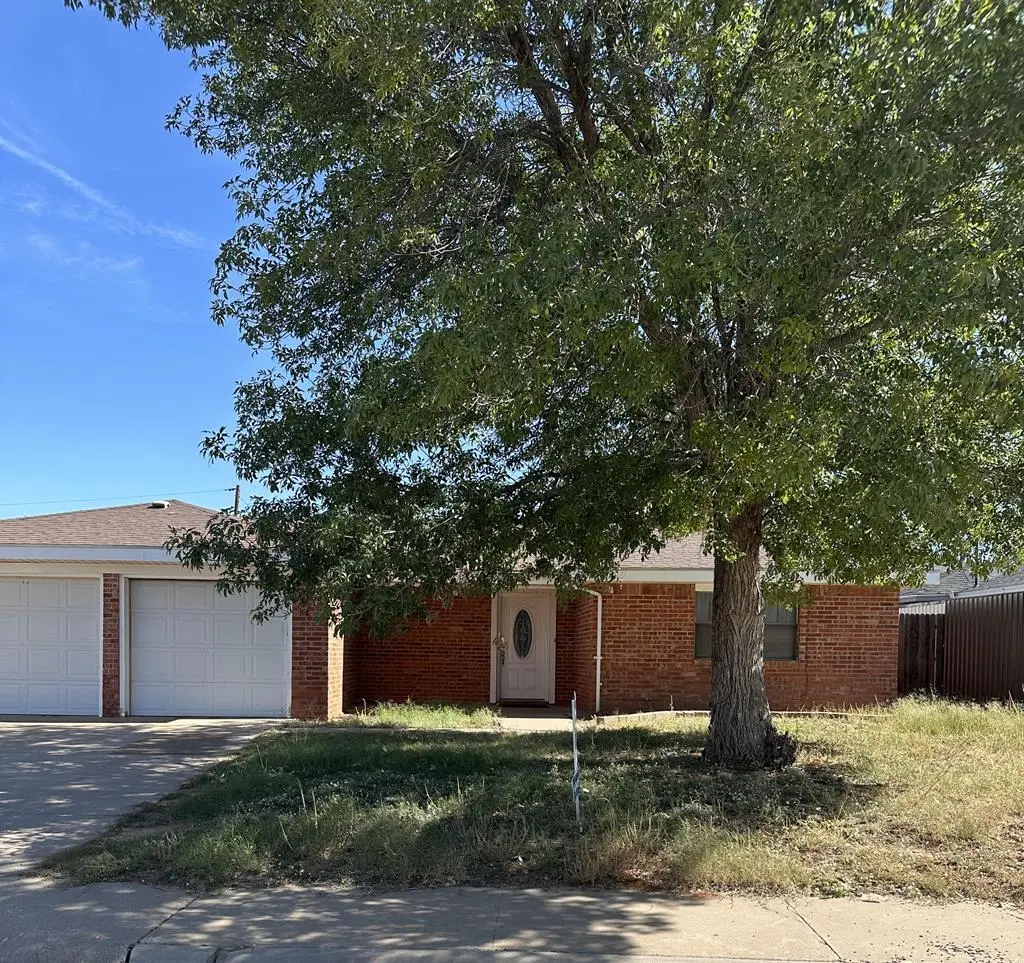
4402 Spence Dr · Midland, TX
Flood risk 1/10 · Minimal
- FEMA flood zone
- X
- Chance of flooding over 30 yrs
- 0.0%
- Est. flood insurance / yr
- $507 – $1,088
Fire risk 7/10 · Major
- Est. fire insurance / yr
- $1,222 – $2,270
Heat risk 6/10 · Moderate
- Hot days now (above 101°F)
- 7 days/yr
- Hot days in 30 yrs
- 22 days/yr
Wind risk 2/10 · Minimal
- Chance of severe wind over 30 yrs
- 3.0%
Air-quality risk 1/10 · Minimal
- Unhealthy air days now
- 0 days/yr
- Unhealthy air days in 30 yrs
- 0 days/yr
Risk factors via First Street. Map © Google.
Why this score? — see what drove the D- grade
The composite is a weighted blend of 9 inputs, each scored 0–100. Each bar is that input's sub-score; the figure is the points it added to the 100-point composite (weight × sub-score).
- Cash flow +9.2/30.0
- ARV discount +9.2/15.0
- Livability +4.0/5.0
- Rent growth +3.6/5.0
- Schools +3.2/10.0
- 1% rule +2.7/10.0
- DSCR +2.6/10.0
- Condition / age +2.5/5.0
- Appreciation +0.0/10.0
$300,000
🖨 Deal sheet 📄 Offer letter ✓ Due diligence
Listing remarks MLS
Cure 3 Bedroom 2 bath home on the north side, sunroom to enjoy, large back yard. Greathouse school area
Key facts
- Sunroom
- Large back yard
- 7,797 sq ft lot
Tags
Neighborhood map
What this means for you Summary
Snapshot
- This is a 3-bed/2.0-bath single-family listed at $300k.
Deal economics
- At list price, monthly cash flow is $-225 ($-3k/yr) — negative.
- To cash-flow at today's rent, offer at most $260k (13.2% below list).
- To meet the 1% rule (rent ≥ 1% of price), the offer needs to be $231k (23.1% below list).
- Recommended offer: $231k (23.1% below list) — sets the bar for 1% rule.
Location & tenants
- Location reads 79/100 on livability (#57 in TX, #2,192 nationally) — a middle-class / working-renter tenant base. Strengths: employment A+, housing A+, health & safety A+; Watch: schools C-, crime C-, commute D+.
- Midland ISD (urban): math 34% / reading 36% proficiency, ranked #477 of 826 in TX (top 58%) — families likely to look elsewhere, expect single-tenant / working-renter base with shorter leases.
- Market conditions: Rents rising fast (+4.5%/yr); 314 active listings in the ZIP; 32 comparable units currently listed for rent nearby; rentals at typical pace (median 21d on market — plan ~3-4 weeks tenant-placement turnaround); solid renter incomes; 1,504 units permitted in Midland County in 2024 (0 in 5+ unit buildings).
Forward outlook
- Local home prices are declining (-3.0%/yr); year-one equity from $2k of loan paydown is wiped out by about $9k of value loss. Plan a longer hold.
- Midland County population projected at +83% by 2050 — long-run rental-demand tailwind backs the buy-and-hold thesis.
Negotiation context
- It's been on market 79 days — a 6% lower offer ($282k) is reasonable based on typical stale-listing flexibility.
- 3 sale attempts since 23y ago with the ask held roughly flat each time — persistent listings suggest the price (not the market) is what's stuck; bring a comps-based counter.
Risks & watch-outs
- Climate carrying-cost: major wildfire risk; extreme-heat days projected 7→22/yr by 2055 (HVAC capex compounding) — expect insurance premiums to compound above CPI over the hold.
Questions for the listing agent
- What do current leases actually rent for vs. the listed asking? Can we see a recent rent roll and the last 12 months of T-12 income?
- It's been on market 79 days. Have you received any prior offers? Is the seller open to a 23% concession, seller financing, or rate buy-down credit?
- Why hasn't it sold? Are there any deal-killer items the seller is aware of (foundation, flood, title, zoning, code violations)?
- Is there a deadline driving the sale (1031 exchange, divorce, estate, relocation)? That informs how much negotiation room exists.
- The area grade is low — what's the realistic commute time and amenity access for the typical tenant pool here? Any planned neighborhood developments (good or bad) we should know about?
- What's the average days-on-market for RENTAL listings here right now (not sales)? A rising rental-DOM trend means longer vacancies and softer asking-rent achievability than the comps imply.
- What's the recent tenant-quality profile in this submarket — average credit score on applications, eviction rate, late-payment / NSF rate, and stable-employment percentage? A property-management company in the area should have these aggregated.
- How much new for-sale + rental construction is in the pipeline within 1–3 miles? Heavy new supply typically softens prices + rents 12–24 months out; constrained supply supports both.
Investment metrics
- 1% rule
- 0.77% ✗
- Cap rate
- 5.39%
- Cash-on-cash
- -3.21%
- DSCR
- 0.86
- GRM
- 10.8
CMA / ARV
- ARV (median comp)
- $312,058
- List price
- $300,000
- Delta
- -3.86%
- Verdict
- FAIR
- Comps
- 4 within 2.0 mi
Projected returns pro-forma
-3.0% appreciation · 4.45% rent growth · sell at horizon
- IRR
- -20.1%
- Equity multiple
- 0.29×
- Total profit
- $-59,506
- Equity at exit
- $44,731
- IRR
- -10.3%
- Equity multiple
- 0.34×
- Total profit
- $-55,748
- Equity at exit
- $25,939
Cash invested: $84,000 (down + closing). Projections, not guarantees.
Landlord ↔ Tenant lean methodology
- Overall (STATE)
- 87 Strongly Landlord-Friendly
- State Texas
- 87 Strongly Landlord-Friendly · R+5
- County
- — inherits STATE
- City
- — inherits STATE
ZIP-level market 79707
- Rents YoY
- 4.5%
- Active inventory
- 314
- Price-to-rent
- 10.8×
Monthly cashflow live
- Estimated rent
- $2,308 high interval (Pro) →
- Mortgage (P&I)
- −$1,573
- Tax from tax record
- −$350 /mo · $4,203/yr
- Insurance
- −$125
- HOA
- −$0
- Vacancy / Maint / Mgmt
- −$485
- Net cashflow
- $-225
Break-even live
UW: 25.0% down · 7.5% · 30yr · 1.5% tax · 5.0% vac · 8.0% maint · 8.0% mgmt
Financing live
Cash to close
- Down payment
- $75,000
- Closing costs
- $9,000
- Reserves months
- —
- Total cash needed
- —
Loan-product check · same deal, 3 products live
Conventional
25% down · 7.5% · 30yr
- Down + closing
- —
- Monthly P&I
- —
- Monthly cashflow
- —
- DSCR
- —
- Eligible?
- —
Personal DTI + credit; lowest rate.
DSCR
20% down · 8.5% · 30yr
- Down + closing
- —
- Monthly P&I
- —
- Monthly cashflow
- —
- DSCR
- —
- Eligible?
- —
No personal income docs; deal must DSCR.
Hard money
10% down · 12.0% · 12mo
- Down + closing
- —
- Monthly P&I
- —
- Monthly cashflow
- —
- DSCR
- —
- Eligible?
- —
Short-term bridge; refi at stabilization.
Rent comps 32 comps
| Address | Beds | Baths | Sqft | Rent | $/sqft | DOM | Units | Dist |
|---|---|---|---|---|---|---|---|---|
| 5203 Canadian Ave Midland, TX | 4.0 | 2.0 | 1677 | $2,600 | $1.55 | 13d | 1 | 0.11mi |
| 5200 Briarwood Ave Midland, TX | 1.0–2.0 | 1.0–2.0 | 893 | $2,124 | $2.38 | 13d | 24 | 0.24mi |
| 5110 San Antonio Ave Midland, TX | 3.0 | 2.0 | 1510 | $2,600 | $1.72 | 21d | 1 | 0.24mi |
| 5103 San Antonio Ave Midland, TX | 4.0 | 2.0 | 1739 | $2,900 | $1.67 | 21d | 1 | 0.27mi |
| 5117 San Antonio Ave Midland, TX | 3.0 | 2.0 | 1600 | $2,495 | $1.56 | 44d | 1 | 0.28mi |
| 5207 San Antonio Ave Midland, TX | 3.0 | 2.0 | 1588 | $2,200 | $1.39 | 13d | 1 | 0.28mi |
| 5244 West Loop 250 N Midland, TX | 1.0–2.0 | 1.0–2.0 | 791 | $1,749 | $2.21 | 13d | 34 | 0.40mi |
| 4805 Briarwood Ave Midland, TX | 1.0–3.0 | 1.0–2.0 | 1028 | $2,285 | $2.22 | 13d | 18 | 0.44mi |
| 4415 Northcrest Dr Midland, TX | 1.0–2.0 | 1.0–2.0 | 804 | $1,594 | $1.98 | 13d | 17 | 0.56mi |
| 3705 Dentcrest Dr Midland, TX | 3.0 | 2.0 | 1402 | $1,800 | $1.28 | 13d | 1 | 0.61mi |
| 5216 Tremont Ave Midland, TX | 1.0–2.0 | 1.0–2.0 | 771 | $1,411 | $1.83 | 13d | 19 | 0.67mi |
| 3309 Edgemont Dr Midland, TX | 3.0 | 2.0 | 1600 | $2,995 | $1.87 | 21d | 1 | 0.88mi |
| 3306 Oakmont Dr Midland, TX | 3.0 | 2.0 | 1791 | $2,500 | $1.40 | 21d | 1 | 0.88mi |
| 6000 Briarwood Ave Midland, TX | 1.0–3.0 | 1.0–2.0 | 996 | $2,856 | $2.87 | 13d | 28 | 0.95mi |
| 3226 Whittle Way Midland, TX | 3.0 | 2.0 | 1850 | $4,250 | $2.30 | 21d | 1 | 0.95mi |
| 4419 Fairgate Dr Midland, TX | 2.0 | 2.0 | 1620 | $1,800 | $1.11 | 21d | 1 | 0.98mi |
| 4301 Raleigh Ct Midland, TX | 1.0–2.0 | 1.0–2.0 | 766 | $1,490 | $1.94 | 13d | 18 | 1.00mi |
| 3417 N Midland Dr Midland, TX | 1.0–3.0 | 1.0–2.0 | 887 | $1,624 | $1.83 | 13d | 13 | 1.01mi |
| 4715 W Wadley Ave Midland, TX | 1.0–2.0 | 1.0–2.5 | 872 | $1,514 | $1.74 | 13d | 10 | 1.02mi |
| 5001 W Wadley Ave Midland, TX | 1.0–3.0 | 1.0–2.0 | 1098 | $2,720 | $2.48 | 13d | 17 | 1.03mi |
| 4800 Dentcrest Dr Midland, TX | 2.0 | 2.0 | 1148 | $1,999 | $1.74 | 43d | 1 | 1.03mi |
| 3245 Preston Dr Midland, TX | 3.0 | 2.5 | 1608 | $2,000 | $1.24 | 43d | 1 | 1.05mi |
| 4704 Dentcrest Dr Unit A Midland, TX | 2.0 | 2.0 | 1500 | $1,850 | $1.23 | 43d | 1 | 1.05mi |
| 4713 Dentcrest Dr Unit A Midland, TX | 2.0 | 2.0 | 1400 | $3,250 | $2.32 | 21d | 1 | 1.06mi |
| 3600 N Midland Dr Midland, TX | 1.0–2.0 | 1.0–2.0 | 900 | $1,425 | $1.58 | 13d | 9 | 1.10mi |
| 3214 Mark Ln Midland, TX | 3.0 | 2.0 | 1836 | $2,550 | $1.39 | 43d | 1 | 1.10mi |
| 3208 Elma Dr Midland, TX | 3.0 | 2.5 | 1645 | $2,700 | $1.64 | 43d | 1 | 1.10mi |
| 2913 Sunburst Dr Midland, TX | 3.0 | 2.0 | 1655 | $2,400 | $1.45 | 21d | 1 | 1.14mi |
| 3002 Phillip Pl Midland, TX | 3.0 | 2.0 | 1579 | $2,400 | $1.52 | 43d | 1 | 1.21mi |
| 5108 Rainbow Rd Unit A Midland, TX | 3.0 | 2.0 | 1406 | $3,250 | $2.31 | 43d | 1 | 1.27mi |
| 4700 Boulder Dr Midland, TX | 1.0–2.0 | 1.0–2.0 | 823 | $1,500 | $1.82 | 21d | 2 | 1.38mi |
| 5501 Sherwood Dr Midland, TX | 1.0–3.0 | 1.0–2.5 | 1050 | $3,259 | $3.10 | 13d | 24 | 1.46mi |
Listing history 10 events
-
2026-05-17status Pending 103-char remark
Show marketing remark (103 chars)
Cure 3 Bedroom 2 bath home on the north side, sunroom to enjoy, large back yard. Greathouse school area
-
2026-02-27$300,000 Active 103-char remark
Show marketing remark (103 chars)
Cure 3 Bedroom 2 bath home on the north side, sunroom to enjoy, large back yard. Greathouse school area
-
2025-01-22historical $2,000
-
2024-12-04price $2,000
-
2024-10-24$2,100
-
2011-11-23soldstatus
-
2009-04-01soldstatus
-
2004-03-03soldstatus
-
2004-03-01soldstatus 191-char remark
Show marketing remark (191 chars)
HOME IS SOLD AS IS WHERE IS AND WITH ALL FAULTS, HOME IS VACANT, 3 BRS, 2 BA, DETRASH COMPLETE, SPI BOX, OPEN KITCHEN, FIREPLACE, 2 CAR GARAGE. CORP ADDENDA IS IN KITCHEN, EARNEST MONEY IS 3%
-
2003-11-20$67,900 191-char remark
Show marketing remark (191 chars)
HOME IS SOLD AS IS WHERE IS AND WITH ALL FAULTS, HOME IS VACANT, 3 BRS, 2 BA, DETRASH COMPLETE, SPI BOX, OPEN KITCHEN, FIREPLACE, 2 CAR GARAGE. CORP ADDENDA IS IN KITCHEN, EARNEST MONEY IS 3%
ⓘ Source: listings_history table (triggers on properties + properties_extension) + one-shot
backfill from property_details.listing_events for pre-trigger history.
Tax reassessment forecast TX · Resets to sale price
- Current annual tax
- $4,203 · $350/mo
- Projected year-2 tax
- $5,490 · $458/mo
- Expected delta
- +$1,287/yr (+$107/mo · 30.6%)
ⓘ Screening estimate from a state-policy table — verify with the county assessor before closing.
Climate risk First Street
- Flood 1/10 Low FEMA zone X · 0% chance over 30 yrs
- Wildfire 7/10 Severe
- Heat 6/10 Major 7 d/yr ≥101°F today · 22 d/yr by 30 yrs out
- Wind 2/10 Low 3% chance of damaging wind over 30 yrs
- Air quality 1/10 Low 0 unhealthy d/yr today · 0 by 30 yrs out
Nearby sold comps map
Loading sold comps map…
Walkable amenities ~0.75 mi
Loading nearby amenities…
Taxation est. · year 1
- Rental income
- $27,699
- − Mortgage interest
- −$16,805
- − Property taxes
- −$4,203
- − Insurance
- −$1,500
- − Repairs & maintenance
- −$2,216
- − Management
- −$2,216
- − Depreciation
- −$8,727
- Taxable loss
- −$7,968
- Est. tax savings @ 24.0%
- +$1,912
- After-tax cash flow
- $-787/yr
For passive investors: Depreciation is non-cash, so a rental often shows a tax loss while cash-flowing — sheltering income. Rental losses are passive: they offset passive income freely, and up to $25,000/yr can offset ordinary (W-2) income if you actively participate and your MAGI is under $100k (phasing out to $0 by $150k); unused losses carry forward. On sale, claimed depreciation is recaptured at up to 25%, and gains may owe capital-gains tax (a 1031 exchange can defer both). Figures are a year-1 estimate at your 24.0% rate — not tax advice; consult a CPA.
Schools (NCES district)
- District
- Midland ISD
- NCES district ID
- 4830570
- Math proficiency
- 34% ▼ -7.00%
- Reading proficiency
- 36% ▬ 0.00%
- Median HH income
- $63,457
- Composite
- 31.63/100
- National rank
- #5938
- State rank
- #477 of 826 in TX
Livability — Midland
- Score
- 79/100
- State rank
- #57
- US rank
- #2192
Category grades
Schools grade is shown separately in the Schools card above.
Census & demographics
- Census place
- Midland, TX
- County
- Midland County · 168,494 people
- City population
- 168,494
- Metro
- Midland, TX
- Population (ZIP)
- 40,010
- Household income
- $99,886
- Rent vs Own
- Severe rent burden
- 1919.0
Population outlook (Midland County) Hauer SSP2
- Today (2025)
- 220,895 people
- By 2030
- 253,667 · +14.8%
- By 2040
- 325,498 · +47.4%
- By 2050
- 404,168 · +83.0%
- By 2075
- 609,802 · +176.1%
- By 2100
- 760,172 · +244.1%
Race, ethnicity, and origin ACS 2023
- Neighborhood character
- Diverse neighborhood (Simpson 0.58)
- Race & ethnicity
- White 56% Hispanic / Latino 31% Two or more races 11% Asian 5% Black 4%
- Hispanic origin (detail)
- Mexican 26% Cuban 1%
- Common ancestry
- Slovak 3% Lithuanian 2% Italian 1%
- Foreign-born
- 11% · Canada, China, Philippines
- Languages at home
- 79% English-only · Spanish 14% Other Asian/Pacific 2% Other Indo-European 1%
Political lean MEDSL · Midland
- 2024 margin
- Solid R (+60.5) · D 19.3% · R 79.8%
- 2008→2024 swing
- -3.3pp toward R · 2008: -57.3pp · 2024: -60.5pp
- All cycles
- 2024: R+60.5 2020: R+56.6 2016: R+55.2 2012: R+61.5 2008: R+57.3
Not yet ingested
- Civics
- —
Market trends
- HPI YoY
- ▼ -208.65%
- Current HPI
- 198.7489
- Rent YoY
- ▲ 4.45%
- Metro
- Midland, TX
- State GDP YoY
- ▲ 3.95%
- F500 in state
- 110
Industry mix (Fortune 500 HQ in TX)
| Industry | F500 HQs | Revenue |
|---|---|---|
| Energy | 16 | $1,198B |
|
||
| Technology | 5 | $198B |
|
||
| Engineering / Construction | 4 | $72B |
|
||
| Energy Services | 3 | $60B |
|
||
| Utilities | 3 | $41B |
|
||
| Healthcare | 2 | $330B |
|
||
Price history
+341.8% since first listed10 events — show timeline
- 2026-05-17 Pending — PBBOR
- 2026-02-27 Listed $300,000 PBBOR
- 2025-01-22 Rental Removed $2,000 PBBOR
- 2024-12-04 Price Changed $2,000 PBBOR
- 2024-10-24 Listed for Rent $2,100 PBBOR
- 2011-11-23 Sold (Public Records) — Public Records
- 2009-04-01 Sold (Public Records) — Public Records
- 2004-03-03 Sold (Public Records) — Public Records
- 2004-03-01 Sold (MLS) — ODMLS
- 2003-11-20 Listed $67,900 ODMLS
Property tax history
+1.1%/yrLatest (2025): $4,203 · -5.6% YoY. Source: county tax records.
Cash-flow waterfall
monthlySold comps — $/sqft
last 12 mo · ≤1 miLoading sold comps…