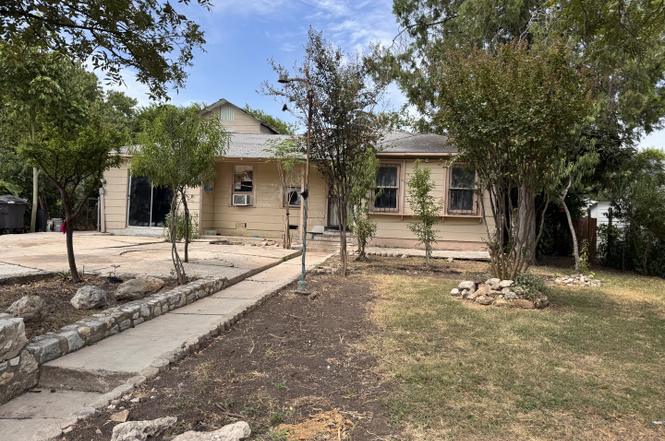
815 Edison · San Antonio, TX
Flood risk 1/10 · Minimal
- FEMA flood zone
- X (unshaded)
- Chance of flooding over 30 yrs
- 0.0%
- Est. flood insurance / yr
- $507 – $1,088
Fire risk 1/10 · Minimal
- Est. fire insurance / yr
- $1,222 – $2,270
Heat risk 8/10 · Major
- Hot days now (above 108°F)
- 7 days/yr
- Hot days in 30 yrs
- 22 days/yr
Wind risk 8/10 · Major
- Chance of severe wind over 30 yrs
- 80.0%
Air-quality risk 2/10 · Minimal
- Unhealthy air days now
- 1 days/yr
- Unhealthy air days in 30 yrs
- 1 days/yr
Risk factors via First Street. Map © Google.
Why this score? — see what drove the B- grade
The composite is a weighted blend of 9 inputs, each scored 0–100. Each bar is that input's sub-score; the figure is the points it added to the 100-point composite (weight × sub-score).
- Cash flow +30.0/30.0
- 1% rule +10.0/10.0
- DSCR +10.0/10.0
- ARV discount +7.5/15.0
- Livability +4.0/5.0
- Rent growth +2.7/5.0
- Condition / age +2.5/5.0
- Schools +1.4/10.0
- Appreciation +0.0/10.0
$89,000
🖨 Deal sheet 📄 Offer letter ✓ Due diligence
Listing remarks
INVESTOR SPECIAL! Prime location just off San Pedro & Blanco with extremely low days on market in this subdivision! This property offers 3 bedrooms, 2 bathroom in the main home, plus a garage conversion with an additional bathroom-making it a total of 4 bedrooms and 3 bathrooms. The back addition features stairs leading up to a private porch and a studio-style living space with its own bathroom. Below, there's another separate living space with a bathroom, providing multiple options for use or rental income potential. This home is ready for a full rehab-a perfect blank canvas for investors looking to maximize returns in a highly desirable location. Don't miss this opportunity-schedule
Key facts
- Private porch
- Garage conversion
- Full rehab
Tags
Neighborhood map
What this means for you Summary
Snapshot
- This is a 3-bed/1.0-bath single-family listed at $89k.
Deal economics
- At list price, monthly cash flow is $550 ($7k/yr) — positive.
- The deal already cash-flows at list — no discount required.
- Meets the 1% rule at list price ($2k rent vs $89k).
- Recommended offer: $84k (6.0% below list) — sets the bar for market timing.
- Cap rate 13.7% vs local median 3.8% in San Antonio — top-decile yield for the area; either an underpriced asset or a hidden risk that comps aren't pricing in. Stress-test before assuming the spread holds.
Location & tenants
- Location reads 80/100 on livability (#31 in TX, #1,616 nationally) — a professional / high-income tenant draw. Strengths: amenities A+, commute A+, cost of living A+; Watch: crime F.
- San Antonio ISD (urban): math 12% / reading 22% proficiency, ranked #805 of 826 in TX (top 98%) — low school quality limits family demand, transient renter base, plan for 1-2y turnover; 80% free/reduced lunch — lower-income household profile, screen leases tightly.
- Zoned schools: Rogers Academy (math 5% / reading 17%, grade F, #4,237 of 4,322 statewide, top 98%, 695 students, 93% FRL); Edison H S (math 14% / reading 24%, grade F, #1,431 of 1,632 statewide, top 88%, 1,329 students, 90% FRL).
- Market conditions: Rents flat; 175 active listings in the ZIP; 40 comparable units currently listed for rent nearby; rentals at typical pace (median 24d on market — plan ~3-4 weeks tenant-placement turnaround); 8,308 units permitted in Bexar County in 2024 (2,506 in 5+ unit buildings).
- This rent runs 33% of the median local income ($63k/yr) — at the standard rent-burdened threshold; future hikes will face affordability resistance.
Forward outlook
- Local home prices are declining (-3.0%/yr); year-one equity from $615 of loan paydown is wiped out by about $3k of value loss. Plan a longer hold.
- Bexar County population projected at +50% by 2050 — long-run rental-demand tailwind backs the buy-and-hold thesis.
- At projected returns (-3.0% appreciation + 0.9% rent growth), your $25k cash investment doubles in ~6 years — after that, you're playing with house money.
Negotiation context
- It's been on market 65 days — a 6% lower offer ($84k) is reasonable based on typical stale-listing flexibility.
- 5 sale attempts; this cycle's ask has dropped $10k (10%) from the opening price — seller is motivated, your offer sets the floor, not the list.
Risks & watch-outs
- Watch-outs: property tax is 4.0% of price; built in 1949 — expect roof / HVAC / electrical / plumbing capex.
- Climate carrying-cost: severe wind risk, 80% chance of damaging wind over 30y; extreme-heat days projected 7→22/yr by 2055 (HVAC capex compounding) — expect insurance premiums to compound above CPI over the hold.
Questions for the listing agent
- It's been on market 65 days. Have you received any prior offers? Is the seller open to a 6% concession, seller financing, or rate buy-down credit?
- Built in 1949 — when were the roof, HVAC, electrical panel, plumbing, and water heater last replaced?
- Property tax is high relative to price — has the assessment been appealed recently, and will the sale trigger a re-assessment?
- Why hasn't it sold? Are there any deal-killer items the seller is aware of (foundation, flood, title, zoning, code violations)?
- Is there a deadline driving the sale (1031 exchange, divorce, estate, relocation)? That informs how much negotiation room exists.
- Crime grade is F in this area — have there been break-ins, vandalism, or insurance claims at this property in the last 3 years? What carrier currently insures it and at what premium?
- What's the average days-on-market for RENTAL listings here right now (not sales)? A rising rental-DOM trend means longer vacancies and softer asking-rent achievability than the comps imply.
- What's the recent tenant-quality profile in this submarket — average credit score on applications, eviction rate, late-payment / NSF rate, and stable-employment percentage? A property-management company in the area should have these aggregated.
- How much new for-sale + rental construction is in the pipeline within 1–3 miles? Heavy new supply typically softens prices + rents 12–24 months out; constrained supply supports both.
Investment metrics
- 1% rule
- 1.92% ✓
- Cap rate
- 13.71%
- Cash-on-cash
- 26.48%
- DSCR
- 2.18
- GRM
- 4.3
CMA / ARV
- ARV (on-the-fly)
- $216,580
- Comps found
- 12
Show comp detail 12 sales within ~0.75 mi
| Address | Dist | Beds/Ba | Sqft | Sold | Price | $/sf | Match |
|---|---|---|---|---|---|---|---|
| 815 Edison | 0.00mi | 4/3.0 (+1) | 1,666 (0%) | 1mo | $89,000 | $53 | 86 |
| 803 Fresno | 0.06mi | 4/2.0 (+1) | 1,610 (-3%) | 1mo | $249,900 | $155 | 82 |
| 839 Alametos | 0.14mi | 3/2.0 | 1,532 (-8%) | 6mo | $184,000 | $120 | 71 |
| 422 W Wildwood | 0.33mi | 3/1.0 | 1,586 (-5%) | 9mo | $169,900 | $107 | 69 |
| 824 Elmwood | 0.46mi | 3/2.0 | 1,540 (-8%) | 3mo | $280,000 | $182 | 59 |
| 339 Thorain Blvd | 0.58mi | 3/2.0 | 1,662 (-0%) | 11mo | $298,000 | $179 | 59 |
| 607 Lovera | 0.64mi | 3/2.0 | 1,684 (+1%) | 8mo | $175,000 | $104 | 58 |
| 369 W Mandalay | 0.51mi | 3/2.0 | 1,804 (+8%) | 5mo | $235,000 | $130 | 54 |
| 633 W Lullwood Ave | 0.65mi | 3/2.0 | 1,783 (+7%) | 5mo | $199,900 | $112 | 50 |
| 531 W Olmos Dr | 0.41mi | 3/2.0 | 1,444 (-13%) | 10mo | $135,000 | $93 | 46 |
| 915 W Rosewood | 0.74mi | 3/2.0 | 1,448 (-13%) | 1mo | $269,900 | $186 | 39 |
| 223 W Mariposa Dr | 0.66mi | 2/1.0 (-1) | 1,418 (-15%) | 11mo | $275,000 | $194 | 30 |
Match score weights: distance 35% · size 25% · config 20% · recency 20%. Top-matched comps best support the ARV.
Projected returns pro-forma
-3.0% appreciation · 0.89% rent growth · sell at horizon
- IRR
- 17.6%
- Equity multiple
- 1.69×
- Total profit
- $17,183
- Equity at exit
- $13,270
- IRR
- 24.3%
- Equity multiple
- 2.87×
- Total profit
- $46,627
- Equity at exit
- $7,695
Cash invested: $24,920 (down + closing). Projections, not guarantees.
Landlord ↔ Tenant lean methodology
- Overall (STATE)
- 87 Strongly Landlord-Friendly
- State Texas
- 87 Strongly Landlord-Friendly · R+5
- County
- — inherits STATE
- City
- — inherits STATE
ZIP-level market 78212
- Home prices YoY
- -25.2%
- Rents YoY
- 0.9%
- Active inventory
- 175
- Price-to-rent
- 4.3×
Monthly cashflow live
- Estimated rent
- $1,713 high interval (Pro) →
- Mortgage (P&I)
- −$467
- Tax from tax record
- −$300 /mo · $3,596/yr
- Insurance
- −$37
- HOA
- −$0
- Vacancy / Maint / Mgmt
- −$360
- Net cashflow
- $550
Break-even live
UW: 25.0% down · 7.5% · 30yr · 1.5% tax · 5.0% vac · 8.0% maint · 8.0% mgmt
Financing live
Cash to close
- Down payment
- $22,250
- Closing costs
- $2,670
- Reserves months
- —
- Total cash needed
- —
Loan-product check · same deal, 3 products live
Conventional
25% down · 7.5% · 30yr
- Down + closing
- —
- Monthly P&I
- —
- Monthly cashflow
- —
- DSCR
- —
- Eligible?
- —
Personal DTI + credit; lowest rate.
DSCR
20% down · 8.5% · 30yr
- Down + closing
- —
- Monthly P&I
- —
- Monthly cashflow
- —
- DSCR
- —
- Eligible?
- —
No personal income docs; deal must DSCR.
Hard money
10% down · 12.0% · 12mo
- Down + closing
- —
- Monthly P&I
- —
- Monthly cashflow
- —
- DSCR
- —
- Eligible?
- —
Short-term bridge; refi at stabilization.
Rent comps 40 comps
| Address | Beds | Baths | Sqft | Rent | $/sqft | DOM | Units | Dist |
|---|---|---|---|---|---|---|---|---|
| 802 Alametos Unit A San Antonio, TX | 3.0 | 2.0 | 1350 | $1,700 | $1.26 | 24d | 1 | 0.13mi |
| 862 Clower Unit 2 San Antonio, TX | 3.0 | 1.0 | 1250 | $1,195 | $0.96 | 20d | 1 | 0.19mi |
| 918 McIlvaine San Antonio, TX | 2.0 | 1.0 | 1921 | $1,595 | $0.83 | 44d | 1 | 0.21mi |
| 654 Santa Monica St San Antonio, TX | 3.0 | 1.0 | 1125 | $1,550 | $1.38 | 3d | 1 | 0.28mi |
| 820 W Olmos Dr San Antonio, TX | 2.0 | 1.0 | 1500 | $1,000 | $0.67 | 44d | 1 | 0.32mi |
| 1106 Alametos San Antonio, TX | 4.0 | 2.0 | 1275 | $1,595 | $1.25 | 22d | 1 | 0.36mi |
| 415 W Mariposa Dr Unit NA San Antonio, TX | 3.0 | 2.0 | 1312 | $1,750 | $1.33 | 15d | 1 | 0.44mi |
| 415 W Mariposa Dr San Antonio, TX | 3.0 | 2.0 | 1312 | $1,950 | $1.49 | 24d | 1 | 0.44mi |
| 1211 Lee Hall San Antonio, TX | 4.0 | 2.0 | 1078 | $1,500 | $1.39 | 24d | 1 | 0.48mi |
| 542 Thorain Blvd Unit 1 San Antonio, TX | 3.0 | 1.0 | 1935 | $1,450 | $0.75 | 24d | 1 | 0.50mi |
| 636 W Norwood Ct San Antonio, TX | 3.0 | 2.0 | 1168 | $1,650 | $1.41 | 3d | 1 | 0.51mi |
| 1035 San Francisco San Antonio, TX | 3.0 | 2.5 | 1516 | $1,795 | $1.18 | 44d | 1 | 0.53mi |
| 611 W Ridgewood Ct Unit 2 San Antonio, TX | 2.0 | 1.0 | 2048 | $1,300 | $0.63 | 24d | 1 | 0.55mi |
| 244 W Hermosa Dr San Antonio, TX | 3.0 | 2.0 | 1664 | $2,245 | $1.35 | 4d | 1 | 0.58mi |
| 711 W Lullwood Ave San Antonio, TX | 3.0 | 2.0 | 1527 | $2,350 | $1.54 | 16d | 1 | 0.63mi |
| 1135 W Ridgewood Ct San Antonio, TX | 3.0 | 2.0 | 1212 | $1,650 | $1.36 | 44d | 1 | 0.65mi |
| 4507 Howard St San Antonio, TX | 3.0 | 2.0 | 1289 | $1,600 | $1.24 | 22d | 1 | 0.66mi |
| 315 W Norwood Ct Unit 1 San Antonio, TX | 2.0 | 2.0 | 1976 | $1,550 | $0.78 | 4d | 1 | 0.68mi |
| 331 Clarence St San Antonio, TX | 4.0 | 2.0 | 1678 | $1,965 | $1.17 | 11d | 1 | 0.71mi |
| 1331 W Wildwood Dr San Antonio, TX | 3.0 | 1.0 | 1178 | $1,600 | $1.36 | 44d | 1 | 0.72mi |
| 513 W Rosewood Ave San Antonio, TX | 2.0 | 2.0 | 1192 | $2,000 | $1.68 | 44d | 1 | 0.74mi |
| 1019 W Rosewood Ave San Antonio, TX | 3.0 | 2.0 | 1530 | $2,100 | $1.37 | 44d | 1 | 0.76mi |
| 311 W Lullwood Ave San Antonio, TX | 2.0 | 1.0 | 1512 | $1,250 | $0.83 | 24d | 1 | 0.78mi |
| 309 W Lullwood Ave San Antonio, TX | 2.0 | 1.0 | 2186 | $1,200 | $0.55 | 44d | 1 | 0.78mi |
| 418 W Rosewood Ave San Antonio, TX | 3.0 | 2.0 | 2100 | $2,499 | $1.19 | 24d | 1 | 0.80mi |
| 294 El Monte Blvd San Antonio, TX | 2.0 | 1.0 | 1267 | $1,600 | $1.26 | 2d | 1 | 0.81mi |
| 200 Melrose Pl Unit 300 San Antonio, TX | 2.0 | 2.5 | 1336 | $1,995 | $1.49 | 44d | 1 | 0.81mi |
| 109 W Norwood Ct Unit 3 San Antonio, TX | 2.0 | 1.0 | 1400 | $1,395 | $1.00 | 24d | 1 | 0.84mi |
| 109 W Norwood Ct Unit 1 San Antonio, TX | 2.0 | 2.0 | 1400 | $1,495 | $1.07 | 44d | 1 | 0.84mi |
| 217 W Lullwood Ave Unit 3 San Antonio, TX | 2.0 | 1.0 | 1130 | $1,120 | $0.99 | 44d | 1 | 0.84mi |
| 823 La Manda Blvd San Antonio, TX | 3.0 | 2.0 | 1166 | $1,550 | $1.33 | 4d | 1 | 0.85mi |
| 207 W Hermine Blvd Unit 1 San Antonio, TX | 2.0 | 1.0 | 1371 | $2,000 | $1.46 | 3d | 1 | 0.85mi |
| 125 San Angelo San Antonio, TX | 3.0 | 2.5 | 1430 | $1,950 | $1.36 | 15d | 1 | 0.86mi |
| 130 Melrose Pl San Antonio, TX | 3.0 | 1.0–2.5 | 1230 | $1,865 | $1.52 | 3d | 22 | 0.88mi |
| 204 Lovera Blvd San Antonio, TX | 3.0 | 2.0 | 1859 | $2,500 | $1.34 | 10d | 1 | 0.89mi |
| 1142 W Lynwood Ave San Antonio, TX | 3.0 | 1.5 | 1276 | $1,700 | $1.33 | 24d | 1 | 0.93mi |
| 527 Fulton Ave Unit 2 San Antonio, TX | 2.0 | 1.0 | 1450 | $1,395 | $0.96 | 22d | 1 | 0.94mi |
| 527 Fulton Ave Unit 2 San Antonio, TX | 2.0 | 1.0 | 1450 | $1,395 | $0.96 | 24d | 1 | 0.94mi |
| 100 W El Prado Dr #112 San Antonio, TX | 2.0 | 2.0 | 1460 | $1,995 | $1.37 | 15d | 1 | 0.97mi |
| 402 W Elsmere Pl San Antonio, TX | 4.0 | 2.0 | 1490 | $1,995 | $1.34 | 24d | 1 | 0.97mi |
Listing history 11 events
-
2025-11-05status Pending
-
2025-10-31status Back on Market
-
2025-10-31historical Active Option
-
2025-10-15status Back on Market
-
2025-10-11historical Active Option
-
2025-10-01price $89,000
-
2025-10-01status Back on Market
-
2025-09-29historical Active Option
-
2025-09-23status Back on Market
-
2025-09-18historical Active Option
-
2025-09-01$99,000 New
ⓘ Source: listings_history table (triggers on properties + properties_extension) + one-shot
backfill from property_details.listing_events for pre-trigger history.
Tax reassessment forecast TX · Resets to sale price
- Current annual tax
- $3,596 · $300/mo
- Projected year-2 tax
- $3,596 · $300/mo
- Expected delta
- $0/yr ($0/mo · 0.0%)
ⓘ Screening estimate from a state-policy table — verify with the county assessor before closing.
Climate risk First Street
- Flood 1/10 Low FEMA zone X (unshaded) · 0% chance over 30 yrs
- Wildfire 1/10 Low
- Heat 8/10 Severe 7 d/yr ≥108°F today · 22 d/yr by 30 yrs out
- Wind 8/10 Severe 80% chance of damaging wind over 30 yrs
- Air quality 2/10 Low 1 unhealthy d/yr today · 1 by 30 yrs out
Nearby sold comps map
Loading sold comps map…
Walkable amenities ~0.75 mi
Loading nearby amenities…
Taxation est. · year 1
- Rental income
- $20,557
- − Mortgage interest
- −$4,985
- − Property taxes
- −$3,596
- − Insurance
- −$445
- − Repairs & maintenance
- −$1,645
- − Management
- −$1,645
- − Depreciation
- −$2,589
- Taxable income
- $5,653
- Est. tax owed @ 24.0%
- −$1,357
- After-tax cash flow
- $5,242/yr
For passive investors: Depreciation is non-cash, so a rental often shows a tax loss while cash-flowing — sheltering income. Rental losses are passive: they offset passive income freely, and up to $25,000/yr can offset ordinary (W-2) income if you actively participate and your MAGI is under $100k (phasing out to $0 by $150k); unused losses carry forward. On sale, claimed depreciation is recaptured at up to 25%, and gains may owe capital-gains tax (a 1031 exchange can defer both). Figures are a year-1 estimate at your 24.0% rate — not tax advice; consult a CPA.
Schools (NCES district)
- District
- San Antonio ISD
- NCES district ID
- 4838730
- Math proficiency
- 12% ▼ -21.00%
- Reading proficiency
- 22% ▼ -7.00%
- Median HH income
- $30,952
- Composite
- 13.57/100
- National rank
- #9512
- State rank
- #805 of 826 in TX
Livability — San Antonio
- Score
- 80/100
- State rank
- #31
- US rank
- #1616
Category grades
Schools grade is shown separately in the Schools card above.
Census & demographics
- Census place
- San Antonio, TX
- County
- Bexar County · 1,990,555 people
- City population
- 1,806,925
- Metro
- San Antonio-New Braunfels, TX
- Population (ZIP)
- 27,437
- Household income
- $62,801
- Rent vs Own
- Severe rent burden
- 1505.0
Population outlook (Bexar County) Hauer SSP2
- Today (2025)
- 2,336,851 people
- By 2030
- 2,560,728 · +9.6%
- By 2040
- 3,020,569 · +29.3%
- By 2050
- 3,493,522 · +49.5%
- By 2075
- 4,668,459 · +99.8%
- By 2100
- 5,533,242 · +136.8%
Race, ethnicity, and origin ACS 2023
- Neighborhood character
- Diverse neighborhood (Simpson 0.55)
- Race & ethnicity
- Hispanic / Latino 58% White 34% Two or more races 34% Black 3% Asian 2%
- Hispanic origin (detail)
- Mexican 50%
- Common ancestry
- Slovak 2% Lithuanian 2% Romanian 1%
- Foreign-born
- 13% · Canada, China
- Languages at home
- 62% English-only · Spanish 36% Chinese 1%
Political lean MEDSL · Bexar
- 2024 margin
- Lean D (+9.8) · D 54.3% · R 44.6% · Other 1.1%
- 2008→2024 swing
- +4.2pp toward D · 2008: 5.6pp · 2024: 9.8pp
- All cycles
- 2024: D+9.8 2020: D+18.2 2016: D+13.5 2012: D+4.6 2008: D+5.6
Not yet ingested
- Civics
- —
Market trends
- HPI YoY
- ▼ -94.24%
- Current HPI
- 280.1006
- Rent YoY
- ▲ 0.89%
- Metro
- San Antonio-New Braunfels, TX
- State GDP YoY
- ▲ 3.95%
- F500 in state
- 110
Industry mix (Fortune 500 HQ in TX)
| Industry | F500 HQs | Revenue |
|---|---|---|
| Energy | 16 | $1,198B |
|
||
| Technology | 5 | $198B |
|
||
| Engineering / Construction | 4 | $72B |
|
||
| Energy Services | 3 | $60B |
|
||
| Utilities | 3 | $41B |
|
||
| Healthcare | 2 | $330B |
|
||
Price history
-10.1% since first listed11 events — show timeline
- 2025-11-05 Pending — LERA
- 2025-10-31 Relisted — LERA
- 2025-10-31 Contingent — LERA
- 2025-10-15 Relisted — LERA
- 2025-10-11 Contingent — LERA
- 2025-10-01 Price Changed $89,000 LERA
- 2025-10-01 Relisted — LERA
- 2025-09-29 Contingent — LERA
- 2025-09-23 Relisted — LERA
- 2025-09-18 Contingent — LERA
- 2025-09-01 Listed $99,000 LERA
Property tax history
+3.9%/yrLatest (2025): $3,596 · +0.0% YoY. Source: county tax records.
Cash-flow waterfall
monthlySold comps — $/sqft
last 12 mo · ≤1 miLoading sold comps…