 Triplex
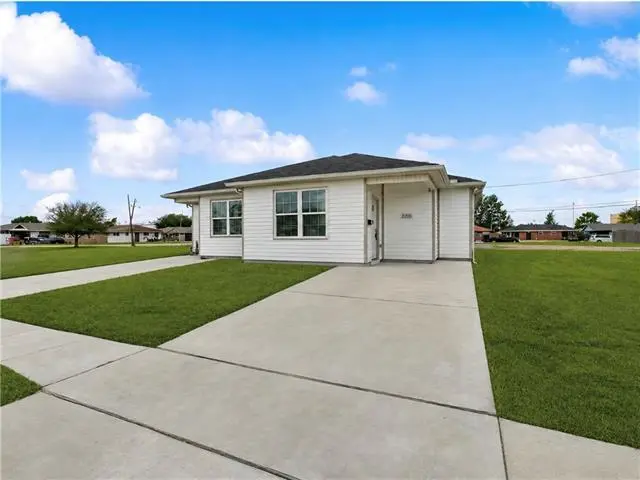
1164-66 Tallow Tree Ln · Harvey, LA
Flood risk No data
- FEMA flood zone
- —
- Chance of flooding over 30 yrs
- —
- Est. flood insurance / yr
- —
Fire risk No data
- Est. fire insurance / yr
- —
Heat risk No data
- Hot days now (above threshold)
- —
- Hot days in 30 yrs
- —
Wind risk No data
- Chance of severe wind over 30 yrs
- —
Air-quality risk No data
- Unhealthy air days now
- —
- Unhealthy air days in 30 yrs
- —
Risk factors via First Street. Map © Google.
Why this score? — see what drove the C+ grade
The composite is a weighted blend of 9 inputs, each scored 0–100. Each bar is that input's sub-score; the figure is the points it added to the 100-point composite (weight × sub-score).
- Cash flow +30.0/30.0
- 1% rule +10.0/10.0
- DSCR +10.0/10.0
- Condition / age +4.0/5.0
- Livability +3.2/5.0
- Schools +2.5/10.0
- Rent growth +1.5/5.0
- ARV discount +0.0/15.0
- Appreciation +0.0/10.0
$325,000
🖨 Deal sheet (PDF) 📄 Offer letter ✓ Due diligence
Multi-family units
County records classify this as Multi-Family (5+ Unit). Listing-text estimate: 3 units. estimate disagrees with records
5+ unit building — per-unit beds/baths from public records are typically unavailable; the breakdown below (if shown) is an estimate from the listing text.
Listing remarks
MOTIVATED SELLER WANTS TO SELL THIS DOUBLE RESIDENCE IN HARVEY LA, OFFERING A BLEND OF MODERN LIVING AND INVESTMENT OPPORTUNITIES. EACH SIDE HAS SPACIOUS LIVING WITH 3 BEDROOMS/2 BATHROOMS ON ONE SIDE AND 2 BEDROOMS/2 BATHROOOMS ON THE OTHER. PRIVACY IS KEY WITH EACH MASTER BEDROOM FEATURING ITS OWN ENSUITE BATH AND WALK IN CLOSET. THE OPEN CONCEPT LIVING AND DINING AREA HAS VINYL FLOORING THROUGHOUT. RECESS LIGHTING IN LIVING AREAS. ENJOY THE CONVENIENCE OF INDOOR LAUNDRY ROOMS AND AN ALL ELECTRIC HOME FOR ENERGY-EFFICIENT LIVING. THE PROPERTY HAS WOOD SIDING AND GUTTERS INSTALLED. EACH UNIT HAS ITS OWN DRIVEWAYS FOR EASY ACCESS TO YOUR FRONT DOOR. NEAR MANHATTAN BLVD, SURROUNDED BY NUMERO
Key facts
- All electric home
- Vinyl flooring
- Recess lighting
Tags
Property features AI
Exterior
- Home design: Duplex with 2 total units
- Construction: Multiple unit structure configuration (listed as Unit 1–4)
- Exterior features: Composition roof
Interior
- Bathrooms: 8 full bathrooms
- Interior features: Central heating and central air conditioning
Neighborhood map
What this means for you Summary
Snapshot
- This is a 3 × 3-bed/?-bath units multifamily listed at $325k. Condition is rated good.
Deal economics
- At list price, monthly cash flow is $2k ($20k/yr) — positive. Per door: $544/mo.
- The deal already cash-flows at list — no discount required.
- Meets the 1% rule at list price ($5k rent vs $325k).
- Recommended offer: $315k (3.0% below list) — sets the bar for market timing.
- Cap rate 12.3% vs local median 4.8% in Harvey — top-decile yield for the area; either an underpriced asset or a hidden risk that comps aren't pricing in. Stress-test before assuming the spread holds.
Location & tenants
- Location reads 64/100 on livability (#166 in LA) — a middle-class / working-renter tenant base. Strengths: cost of living A+, housing A+; Watch: schools D+, crime F, amenities F.
- Jefferson Parish (suburban): math 24% / reading 34% proficiency, ranked #44 of 98 in LA (top 45%) — low school quality limits family demand, transient renter base, plan for 1-2y turnover; 70% free/reduced lunch — lower-income household profile, screen leases tightly.
- Market conditions: Rents falling (-3.9%/yr); 187 active listings in the ZIP; 518 units permitted in Jefferson Parish in 2024 (43 in 5+ unit buildings).
- At $4,908/mo this rent would consume 94% of the median local household income ($62k/yr) (locally 1992% of renters already pay >50% of income on rent) — very limited rent-growth headroom before tenants either downsize or default.
Forward outlook
- Local home prices are declining (-3.0%/yr); year-one equity from $2k of loan paydown is wiped out by about $10k of value loss. Plan a longer hold.
- At projected returns (-3.0% appreciation + 0.0% rent growth), your $91k cash investment doubles in ~8 years — after that, you're playing with house money.
Negotiation context
- It's been on market 48 days — a 3% lower offer ($315k) is reasonable based on typical stale-listing flexibility.
- 5 sale attempts since 5y ago with the ask held roughly flat each time — persistent listings suggest the price (not the market) is what's stuck; bring a comps-based counter.
Questions for the listing agent
- It's been on market 48 days. Have you received any prior offers? Is the seller open to a 3% concession, seller financing, or rate buy-down credit?
- Can we see the unit-by-unit rent roll, current vacancy, and any below-market leases? What's the average tenancy length?
- What capital expenditures (roof, boiler, parking lot, exteriors) have been made in the last 5 years, and what's planned in the next 2?
- Is there a deadline driving the sale (1031 exchange, divorce, estate, relocation)? That informs how much negotiation room exists.
- Schools are D-rated, which usually means shorter tenancies and higher turnover. Who's the typical renter profile here, and what's been the actual vacancy rate?
- Crime grade is F in this area — have there been break-ins, vandalism, or insurance claims at this property in the last 3 years? What carrier currently insures it and at what premium?
- What's the average days-on-market for RENTAL listings here right now (not sales)? A rising rental-DOM trend means longer vacancies and softer asking-rent achievability than the comps imply.
- What's the recent tenant-quality profile in this submarket — average credit score on applications, eviction rate, late-payment / NSF rate, and stable-employment percentage? A property-management company in the area should have these aggregated.
- How much new apartment / multifamily construction is in the pipeline within 1–3 miles? Heavy new supply (>2% of stock underway) typically softens rents 12–24 months out; light construction supports rent growth.
Investment metrics
- 1% rule
- 1.51% ✓
- Cap rate
- 12.32%
- Cash-on-cash
- 21.51%
- DSCR
- 1.96
- GRM
- 5.5
CMA / ARV
- ARV (median comp)
- $239,225
- List price
- $325,000
- Delta
- 35.86%
- Verdict
- OVERPRICED
- Comps
- 20 within 1.0 mi
Projected returns pro-forma
-3.0% appreciation · 0.0% rent growth · sell at horizon
- IRR
- 10.6%
- Equity multiple
- 1.41×
- Total profit
- $36,926
- Equity at exit
- $48,459
- IRR
- 17.1%
- Equity multiple
- 2.22×
- Total profit
- $110,656
- Equity at exit
- $28,100
Cash invested: $91,000 (down + closing). Projections, not guarantees.
Landlord ↔ Tenant lean methodology
- Overall (STATE)
- 90 Strongly Landlord-Friendly
- State Louisiana
- 90 Strongly Landlord-Friendly · R+12
- County
- — inherits STATE
- City
- — inherits STATE
ZIP-level market 70058
- Rents YoY
- -3.9%
- Active inventory
- 187
- Price-to-rent
- 16.6×
Monthly cashflow live
- Estimated rent
- $4,908 high interval (Pro) →
- Mortgage (P&I)
- −$1,704
- Tax est. 1.5%
- −$406 /mo · $4,875/yr
- Insurance
- −$135
- HOA
- −$0
- Vacancy / Maint / Mgmt
- −$1,031
- Net cashflow
- $1,631
Break-even live
Sensitivity live
| Price | -10% $1,856 | -5% $1,744 | +0% $1,631 | +5% $1,519 | +10% $1,407 |
|---|---|---|---|---|---|
| Rent | -10% $1,244 | -5% $1,437 | +0% $1,631 | +5% $1,825 | +10% $2,019 |
| Rate | -1.0pp $1,795 | -0.5pp $1,714 | base $1,631 | +0.5pp $1,547 | +1.0pp $1,461 |
3-unit breakdown (identical units grouped — click to expand)
| Units | Beds | Baths | Est. rent |
|---|---|---|---|
| 3× units | 3 | — | $4,908 |
| #1 | 3 | — | $1,636 |
| #2 | 3 | — | $1,636 |
| #3 | 3 | — | $1,636 |
| Total (3 units) | $4,908 | ||
UW: 25.0% down · 7.5% · 30yr · 1.5% tax · 5.0% vac · 8.0% maint · 8.0% mgmt
Financing live
Cash to close
- Down payment
- $81,250
- Closing costs
- $9,750
- Reserves months
- —
- Total cash needed
- —
Loan-product check · same deal, 3 products live
Conventional
25% down · 7.5% · 30yr
- Down + closing
- —
- Monthly P&I
- —
- Monthly cashflow
- —
- DSCR
- —
- Eligible?
- —
Personal DTI + credit; lowest rate.
DSCR
20% down · 8.5% · 30yr
- Down + closing
- —
- Monthly P&I
- —
- Monthly cashflow
- —
- DSCR
- —
- Eligible?
- —
No personal income docs; deal must DSCR.
Hard money
10% down · 12.0% · 12mo
- Down + closing
- —
- Monthly P&I
- —
- Monthly cashflow
- —
- DSCR
- —
- Eligible?
- —
Short-term bridge; refi at stabilization.
Listing history 21 events
-
2026-06-18days on market $325,000 Active 48 DOM
-
2026-06-17days on market $325,000 Active 47 DOM
-
2026-06-16days on market $325,000 Active 46 DOM
-
2026-06-15days on market $325,000 Active 45 DOM
-
2026-06-13days on market $325,000 Active 43 DOM
-
2026-06-10days on market $325,000 Active 40 DOM
-
2026-06-09days on market $325,000 Active 39 DOM
-
2026-06-08days on market $325,000 Active 38 DOM
-
2026-06-07days on market $325,000 Active 37 DOM
-
2026-06-03days on market $325,000 Active 33 DOM
-
2026-06-02days on market $325,000 Active 32 DOM
-
2026-06-01days on market $325,000 Active 31 DOM
-
2026-05-31days on market $325,000 Active 30 DOM
-
2026-05-01$325,000 Active 1201-char remark
-
2025-06-04price $330,795
-
2025-03-11price $355,000
-
2024-09-06historical $1,800
-
2024-07-10$1,800
-
2024-04-14$377,500 Active
-
2021-06-02$330,000
-
2021-02-05$337,500
ⓘ Source: listings_history table (triggers on properties + properties_extension) + one-shot
backfill from property_details.listing_events for pre-trigger history.
Nearby sold comps map
Loading sold comps map…
Walkable amenities ~0.75 mi
Loading nearby amenities…
Taxation est. · year 1
- Rental income
- $58,896
- − Mortgage interest
- −$18,205
- − Property taxes
- −$4,875
- − Insurance
- −$1,625
- − Repairs & maintenance
- −$4,712
- − Management
- −$4,712
- − Depreciation
- −$9,455
- Taxable income
- $15,313
- Est. tax owed @ 24.0%
- −$3,675
- After-tax cash flow
- $15,901/yr
For passive investors: Depreciation is non-cash, so a rental often shows a tax loss while cash-flowing — sheltering income. Rental losses are passive: they offset passive income freely, and up to $25,000/yr can offset ordinary (W-2) income if you actively participate and your MAGI is under $100k (phasing out to $0 by $150k); unused losses carry forward. On sale, claimed depreciation is recaptured at up to 25%, and gains may owe capital-gains tax (a 1031 exchange can defer both). Figures are a year-1 estimate at your 24.0% rate — not tax advice; consult a CPA.
Condition & rehab AI · 13 photos
This multi-family property is in good condition with modern amenities and a clean, well-maintained appearance. It has potential for further value enhancement through minor exterior updates and landscaping improvements.
Value-add opportunities
- Resale Paint the exterior siding and trim for a fresh look. — Fresh paint can significantly enhance curb appeal and property value.
- Resale Install new landscaping and add some greenery around the property. — A well-maintained and landscaped property can attract more buyers and renters.
- Rental Add a small patio or outdoor seating area. — This can increase the rental appeal and attract tenants who value outdoor spaces.
Renovation cost estimate screening
Value-add ROI direction
- Resale Paint the exterior siding and trim for a fresh look. — Fresh paint can significantly enhance curb appeal and property value. ↑
- Resale Install new landscaping and add some greenery around the property. — A well-maintained and landscaped property can attract more buyers and renters. ↑
- Rental Add a small patio or outdoor seating area. — This can increase the rental appeal and attract tenants who value outdoor spaces. ↑
ⓘ Cost ranges are severity-bucket heuristics (US national rule-of-thumb). Get contractor quotes + a written scope before underwriting a rehab budget.
Schools (NCES district)
- District
- Jefferson Parish
- NCES district ID
- 2200840
- Math proficiency
- 24% ▼ -36.00%
- Reading proficiency
- 34% ▼ -30.00%
- Median HH income
- $48,421
- Composite
- 25.19/100
- National rank
- #7511
- State rank
- #44 of 98 in LA
Livability — Harvey
- Score
- 64/100
- State rank
- #166
- US rank
- #13980
Category grades
Schools grade is shown separately in the Schools card above.
Census & demographics
- Census place
- Harvey, LA
- County
- Jefferson Parish · 426,999 people
- City population
- 39,578
- Metro
- New Orleans-Metairie, LA
- Population (ZIP)
- 39,578
- Household income
- $62,416
- Rent vs Own
- Severe rent burden
- 1992.0
Population outlook (Jefferson County) Hauer SSP2
- Today (2025)
- 451,696 people
- By 2030
- 455,451 · +0.8%
- By 2040
- 458,308 · +1.5%
- By 2050
- 461,031 · +2.1%
- By 2075
- 476,351 · +5.5%
- By 2100
- 499,377 · +10.6%
Race, ethnicity, and origin ACS 2023
- Neighborhood character
- Diverse neighborhood (Simpson 0.60)
- Race & ethnicity
- Black 58% White 20% Hispanic / Latino 13% Asian 7% Two or more races 4%
- Hispanic origin (detail)
- Mexican 1% Dominican 1%
- Common ancestry
- Lithuanian 4% Hispanic 1%
- Foreign-born
- 13% · Canada, Vietnam
- Languages at home
- 81% English-only · Spanish 10% Vietnamese 5% French/Haitian/Cajun 2%
Political lean MEDSL · Jefferson
- 2024 margin
- R (+12.9) · D 42.5% · R 55.5% · Other 2.1%
- 2008→2024 swing
- +13.6pp toward D · 2008: -26.6pp · 2024: -12.9pp
- All cycles
- 2024: R+12.9 2020: R+11.1 2016: R+14.8 2012: R+18.4 2008: R+26.6
Not yet ingested
- Civics
- —
Market trends
- HPI YoY
- ▼ -96.82%
- Current HPI
- 156.1052
- Rent YoY
- ▼ -3.88%
- Metro
- New Orleans-Metairie, LA
- State GDP YoY
- ▲ 3.29%
- F500 in state
- 10
Industry mix (Fortune 500 HQ in LA)
| Industry | F500 HQs | Revenue |
|---|---|---|
| Telecommunications | 2 | $23B |
|
||
| Utilities | 1 | $12B |
|
||
| Wholesale / Distribution | 1 | $5B |
|
||
| Advertising | 1 | $2B |
|
||
Price history
-3.7% since first listed8 events — show timeline
- 2026-05-01 Listed $325,000 AcadianaMLS
- 2025-06-04 Price Changed $330,795 AcadianaMLS
- 2025-03-11 Price Changed $355,000 AcadianaMLS
- 2024-09-06 Rental Removed $1,800 GSREIN
- 2024-07-10 Listed for Rent $1,800 GSREIN
- 2024-04-14 Listed $377,500 AcadianaMLS
- 2021-06-02 Listed $330,000 AcadianaMLS
- 2021-02-05 Listed $337,500 AcadianaMLS
Cash-flow waterfall
monthlySold comps — $/sqft
last 12 mo · ≤1 miLoading sold comps…