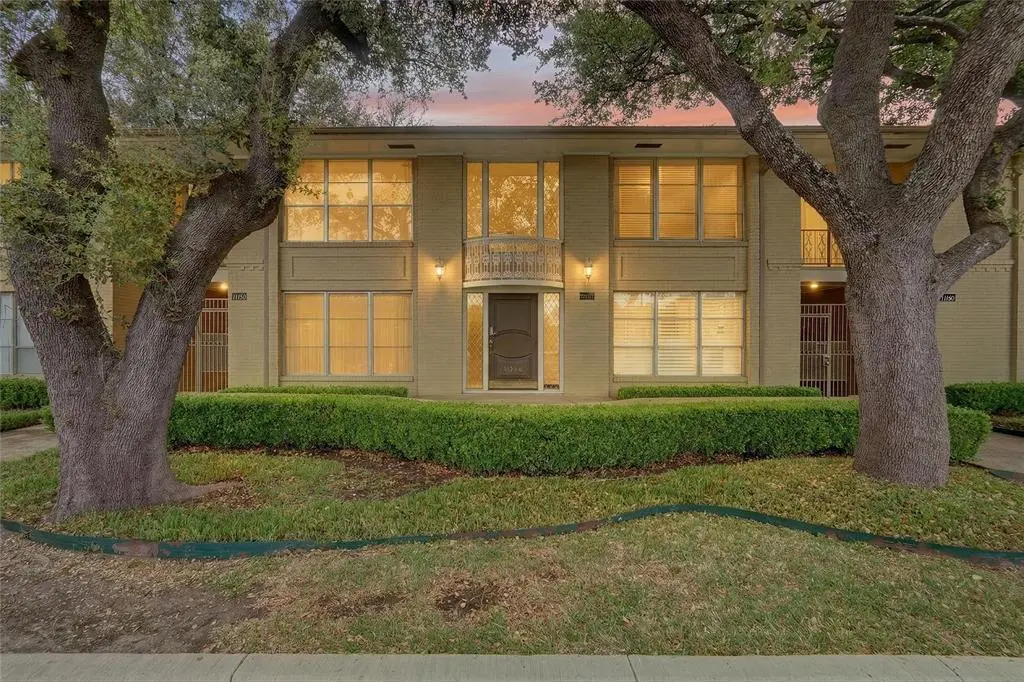
11150 Valleydale Dr Unit D · Dallas, TX
Flood risk 1/10 · Minimal
- FEMA flood zone
- X (unshaded)
- Chance of flooding over 30 yrs
- 0.0%
- Est. flood insurance / yr
- $507 – $1,088
Fire risk 1/10 · Minimal
- Est. fire insurance / yr
- $1,222 – $2,270
Heat risk 7/10 · Major
- Hot days now (above 109°F)
- 7 days/yr
- Hot days in 30 yrs
- 24 days/yr
Wind risk 6/10 · Moderate
- Chance of severe wind over 30 yrs
- 27.0%
Air-quality risk 3/10 · Minor
- Unhealthy air days now
- 3 days/yr
- Unhealthy air days in 30 yrs
- 3 days/yr
Risk factors via First Street. Map © Google.
Why this score? — see what drove the D grade
The composite is a weighted blend of 9 inputs, each scored 0–100. Each bar is that input's sub-score; the figure is the points it added to the 100-point composite (weight × sub-score).
- ARV discount +15.0/15.0
- 1% rule +10.0/10.0
- Cash flow +5.4/30.0
- Livability +4.0/5.0
- Rent growth +3.2/5.0
- Schools +2.8/10.0
- Condition / age +2.5/5.0
- DSCR +0.0/10.0
- Appreciation +0.0/10.0
$116,000
🖨 Deal sheet (PDF) 📄 Offer letter ✓ Due diligence
Listing remarks MLS
This charming 2-bedroom, 2-bath condo offers 1,100+ sqft of comfortable living space within a quiet, well-maintained community. Built in 1961, the property blends classic character with thoughtful updates and functional design. The unit overlooks lush, tree-lined grounds and a beautifully maintained community pool, creating a peaceful and private living environment. Inside, the home features a spacious layout with large rooms, abundant storage, and built-in features, ideal for both owner-occupants and investors. HOA includes water, sewer, exterior insurance, landscaping & grounds and Community amenities.
Key facts
- Tree-lined grounds
- Community pool
- Thoughtful updates
Tags
Neighborhood map
What this means for you Summary
Snapshot
- This is a 2-bed/2.0-bath condo listed at $116k.
Deal economics
- At list price, monthly cash flow is $-253 ($-3k/yr) — negative.
- To cash-flow at today's rent, offer at most $72k (38.1% below list).
- Meets the 1% rule at list price ($2k rent vs $116k).
- Recommended offer: $72k (38.1% below list) — sets the bar for cash-flow.
- Cap rate 3.7% vs local median 2.3% in Dallas — top-decile yield for the area; either an underpriced asset or a hidden risk that comps aren't pricing in. Stress-test before assuming the spread holds.
Location & tenants
- Location reads 81/100 on livability (#24 in TX, #1,380 nationally) — a professional / high-income tenant draw. Strengths: amenities A+, commute A+, housing A+; Watch: crime F.
- Dallas ISD (urban): math 31% / reading 36% proficiency, ranked #559 of 826 in TX (top 68%) — families likely to look elsewhere, expect single-tenant / working-renter base with shorter leases; 83% free/reduced lunch — lower-income household profile, screen leases tightly.
- Zoned schools: Arthur Kramer El (math 37% / reading 47%, grade F, #1,335 of 4,322 statewide, top 33%, 454 students, 68% FRL); Benjamin Franklin International Exploratory Acad (math 26% / reading 32%, grade F, #1,103 of 1,662 statewide, top 67%, 878 students, 86% FRL); Hillcrest H S (math 28% / reading 44%, grade F, #930 of 1,632 statewide, top 57%, 1,610 students, 74% FRL).
- Market conditions: Rents rising (+2.6%/yr); 291 active listings in the ZIP; 40 comparable units currently listed for rent nearby; rentals leasing fast (median 14d on market — plan ~1-2 weeks tenant-placement turnaround); high-income renter base; 12,577 units permitted in Dallas County in 2024 (6,829 in 5+ unit buildings).
Forward outlook
- Local home prices are declining (-3.0%/yr); year-one equity from $802 of loan paydown is wiped out by about $3k of value loss. Plan a longer hold.
- Dallas County population projected at +35% by 2050 — long-run rental-demand tailwind backs the buy-and-hold thesis.
Negotiation context
- It's been on market 90 days — a 6% lower offer ($109k) is reasonable based on typical stale-listing flexibility.
- 3 sale attempts since 12y ago; this cycle's ask has dropped $24k (17%) from the opening price — seller is motivated, your offer sets the floor, not the list.
Risks & watch-outs
- Watch-outs: property tax is 3.1% of price; HOA is 41% of rent.
- Climate carrying-cost: major wind risk, 27% chance of damaging wind over 30y; extreme-heat days projected 7→24/yr by 2055 (HVAC capex compounding) — expect insurance premiums to compound above CPI over the hold.
Questions for the listing agent
- What do current leases actually rent for vs. the listed asking? Can we see a recent rent roll and the last 12 months of T-12 income?
- It's been on market 90 days. Have you received any prior offers? Is the seller open to a 38% concession, seller financing, or rate buy-down credit?
- Built in 1961 — when were the roof, HVAC, electrical panel, plumbing, and water heater last replaced?
- Property tax is high relative to price — has the assessment been appealed recently, and will the sale trigger a re-assessment?
- What does the HOA fee cover, when was the last increase, and are there any pending special assessments or reserve-fund shortfalls?
- Any open or pending special assessments — roof, HVAC, plumbing, elevator, façade? What's the per-unit balance and payoff schedule, and is the seller paying it off at close or rolling it to the buyer?
- Why hasn't it sold? Are there any deal-killer items the seller is aware of (foundation, flood, title, zoning, code violations)?
- Is there a deadline driving the sale (1031 exchange, divorce, estate, relocation)? That informs how much negotiation room exists.
- Crime grade is F in this area — have there been break-ins, vandalism, or insurance claims at this property in the last 3 years? What carrier currently insures it and at what premium?
- The area grade is low — what's the realistic commute time and amenity access for the typical tenant pool here? Any planned neighborhood developments (good or bad) we should know about?
- What's the average days-on-market for RENTAL listings here right now (not sales)? A rising rental-DOM trend means longer vacancies and softer asking-rent achievability than the comps imply.
- What's the recent tenant-quality profile in this submarket — average credit score on applications, eviction rate, late-payment / NSF rate, and stable-employment percentage? A property-management company in the area should have these aggregated.
- How much new apartment / multifamily construction is in the pipeline within 1–3 miles? Heavy new supply (>2% of stock underway) typically softens rents 12–24 months out; light construction supports rent growth.
Investment metrics
- 1% rule
- 1.59% ✓
- Cap rate
- 3.68%
- Cash-on-cash
- -9.35%
- DSCR
- 0.58
- GRM
- 5.2
CMA / ARV
- ARV (median comp)
- $168,195
- List price
- $116,000
- Delta
- -31.03%
- Verdict
- UNDERPRICED
- Comps
- 20 within 1.0 mi
Projected returns pro-forma
-3.0% appreciation · 2.6% rent growth · sell at horizon
- IRR
- -33.2%
- Equity multiple
- -0.08×
- Total profit
- $-35,064
- Equity at exit
- $17,296
- IRR
- -41.6%
- Equity multiple
- -0.60×
- Total profit
- $-51,911
- Equity at exit
- $10,030
Cash invested: $32,480 (down + closing). Projections, not guarantees.
Landlord ↔ Tenant lean methodology
- Overall (STATE)
- 87 Strongly Landlord-Friendly
- State Texas
- 87 Strongly Landlord-Friendly · R+5
- County
- — inherits STATE
- City
- — inherits STATE
ZIP-level market 75230
- Rents YoY
- 2.6%
- Active inventory
- 291
- Price-to-rent
- 5.2×
Monthly cashflow live
- Estimated rent
- $1,844 high interval (Pro) →
- Mortgage (P&I)
- −$608
- Tax from tax record
- −$299 /mo · $3,588/yr
- Insurance
- −$48
- HOA
- −$754
- Vacancy / Maint / Mgmt
- −$387
- Net cashflow
- $-253
Break-even live
Sensitivity live
| Price | -10% $-187 | -5% $-220 | +0% $-253 | +5% $-286 | +10% $-319 |
|---|---|---|---|---|---|
| Rent | -10% $-399 | -5% $-326 | +0% $-253 | +5% $-180 | +10% $-107 |
| Rate | -1.0pp $-195 | -0.5pp $-223 | base $-253 | +0.5pp $-283 | +1.0pp $-314 |
UW: 25.0% down · 7.5% · 30yr · 1.5% tax · 5.0% vac · 8.0% maint · 8.0% mgmt
Financing live
Cash to close
- Down payment
- $29,000
- Closing costs
- $3,480
- Reserves months
- —
- Total cash needed
- —
Loan-product check · same deal, 3 products live
Conventional
25% down · 7.5% · 30yr
- Down + closing
- —
- Monthly P&I
- —
- Monthly cashflow
- —
- DSCR
- —
- Eligible?
- —
Personal DTI + credit; lowest rate.
DSCR
20% down · 8.5% · 30yr
- Down + closing
- —
- Monthly P&I
- —
- Monthly cashflow
- —
- DSCR
- —
- Eligible?
- —
No personal income docs; deal must DSCR.
Hard money
10% down · 12.0% · 12mo
- Down + closing
- —
- Monthly P&I
- —
- Monthly cashflow
- —
- DSCR
- —
- Eligible?
- —
Short-term bridge; refi at stabilization.
Rent comps 40 comps
| Address | Beds | Baths | Sqft | Rent | $/sqft | DOM | Units | Dist |
|---|---|---|---|---|---|---|---|---|
| 11108 Valleydale Dr Unit B Dallas, TX | 2.0 | 2.0 | 1111 | $1,850 | $1.67 | 46d | 1 | 0.03mi |
| 11108 Valleydale Dr Dallas, TX | 2.0 | 2.0 | 1111 | $2,500 | $2.25 | 45d | 1 | 0.03mi |
| 7931 Royal Ln #215 Dallas, TX | 2.0 | 2.0 | 1100 | $1,750 | $1.59 | 13d | 1 | 0.13mi |
| 11316 Park Central Pl Unit C Dallas, TX | 2.0 | 2.0 | 1137 | $1,750 | $1.54 | 6d | 1 | 0.14mi |
| 7935 Royal Ln #217 Dallas, TX | 2.0 | 2.0 | 1100 | $1,750 | $1.59 | 5d | 1 | 0.14mi |
| 7937 Royal Ln #223 Dallas, TX | 2.0 | 2.0 | 965 | $1,750 | $1.81 | 13d | 1 | 0.14mi |
| 7929 Royal Ln #121 Dallas, TX | 2.0 | 2.0 | 992 | $1,750 | $1.76 | 13d | 1 | 0.15mi |
| 7918 Royal Ln #212 Dallas, TX | 2.0 | 2.0 | 1110 | $1,800 | $1.62 | 15d | 1 | 0.19mi |
| 7812 Royal Ln Unit 210 Dallas, TX | 3.0 | 2.0 | 1383 | $2,100 | $1.52 | 9d | 1 | 0.22mi |
| 10951 Stone Canyon Rd Dallas, TX | 1.0–2.0 | 1.0–2.0 | 678 | $1,350 | $1.99 | 5d | 18 | 0.25mi |
| 10843 N Central Expy Dallas, TX | 2.0 | 1.0–2.0 | 694 | $1,615 | $2.33 | 0d | 53 | 0.40mi |
| 10830 Stone Canyon Rd Dallas, TX | 1.0–2.0 | 1.0–2.0 | 815 | $1,595 | $1.96 | 0d | 45 | 0.46mi |
| 10824 Stone Canyon Rd Dallas, TX | 2.0 | 2.0 | 935 | $1,580 | $1.69 | 45d | 1 | 0.47mi |
| 10650 Steppington Dr Dallas, TX | 1.0–2.0 | 1.0–2.0 | 983 | $1,850 | $1.88 | 0d | 2 | 0.53mi |
| 10650 Steppington Dr Dallas, TX | 1.0–2.0 | 1.0–2.0 | 983 | $1,950 | $1.98 | 45d | 2 | 0.53mi |
| 8169 Midtown Blvd Dallas, TX | 2.0 | 1.0–2.0 | 924 | $2,120 | $2.29 | 0d | 40 | 0.54mi |
| 10651 Steppington Dr Dallas, TX | 2.0 | 1.0–2.0 | 735 | $1,505 | $2.05 | 0d | 38 | 0.54mi |
| 10702 Stone Canyon Rd Dallas, TX | 1.0–2.0 | 1.0–2.0 | 933 | $1,590 | $1.70 | 5d | 10 | 0.57mi |
| 7933 Forest Ln Dallas, TX | 2.0 | 2.0 | 1194 | $1,773 | $1.48 | 22d | 1 | 0.59mi |
| 7933 Forest Ln Dallas, TX | 2.0 | 2.0 | 1194 | $1,773 | $1.48 | 0d | 1 | 0.59mi |
| 10640 Steppington Dr Dallas, TX | 1.0–2.0 | 1.0–2.0 | 724 | $1,295 | $1.79 | 0d | 26 | 0.59mi |
| 10602 Stone Canyon Rd Dallas, TX | 1.0–2.0 | 1.0–2.0 | 724 | $1,520 | $2.10 | 4d | 20 | 0.62mi |
| 8031 Forest Ln Dallas, TX | 2.0 | 2.0 | 1103 | $1,765 | $1.60 | 21d | 1 | 0.62mi |
| 8031 Forest Ln Dallas, TX | 2.0 | 2.0 | 1103 | $1,765 | $1.60 | 45d | 1 | 0.62mi |
| 8031 Forest Ln Dallas, TX | 1.0 | 1.0 | 739 | $1,463 | $1.98 | 26d | 1 | 0.62mi |
| 8196 Manderville Ln Dallas, TX | 2.0 | 2.0 | 1055 | $2,297 | $2.18 | 26d | 1 | 0.66mi |
| 7927 Forest Ln Dallas, TX | 3.0 | 1.0–3.0 | 1095 | $2,063 | $1.88 | 0d | 42 | 0.67mi |
| 7927 Forest Ln Unit 3227 Dallas, TX | 1.0 | 1.0 | 745 | $1,255 | $1.68 | 45d | 1 | 0.67mi |
| 10501 Steppington Dr Dallas, TX | 1.0 | 1.0 | 626 | $1,158 | $1.85 | 21d | 15 | 0.68mi |
| 10590 Stone Canyon Rd Dallas, TX | 2.0 | 2.0 | 1111 | $1,560 | $1.40 | 26d | 1 | 0.69mi |
| 10588 Stone Canyon Rd Dallas, TX | 2.0 | 1.0–2.0 | 783 | $1,614 | $2.06 | 1d | 44 | 0.69mi |
| 8025 Forest Ln Dallas, TX | 2.0 | 1.0–2.5 | 1035 | $2,128 | $2.06 | 1d | 23 | 0.71mi |
| 10658 N Central Expy Dallas, TX | 2.0 | 1.0–2.0 | 929 | $3,053 | $3.29 | 0d | 82 | 0.71mi |
| 10658 N Central Expy Dallas, TX | 2.0 | 1.0–2.0 | 929 | $3,227 | $3.47 | 18d | 90 | 0.71mi |
| 7879 Riverfall Dr Dallas, TX | 1.0–2.0 | 1.0–2.0 | 678 | $1,444 | $2.13 | 0d | 32 | 0.72mi |
| 8122 Midtown Blvd Unit 1335743P Dallas, TX | 1.0 | 1.0 | 753 | $2,996 | $3.98 | 4d | 1 | 0.73mi |
| 7520 Highmont St #29 Dallas, TX | 2.0 | 2.0 | 1210 | $2,000 | $1.65 | 22d | 1 | 0.73mi |
| 10570 Stone Canyon Rd Dallas, TX | 1.0–2.0 | 1.0–2.0 | 646 | $1,464 | $2.27 | 1d | 25 | 0.75mi |
| 10570 Stone Canyon Rd Unit 354 Dallas, TX | 1.0 | 1.0 | 820 | $1,122 | $1.37 | 45d | 1 | 0.75mi |
| 10594 High Hollows Dr #290 Dallas, TX | 2.0 | 1.0 | 851 | $1,495 | $1.76 | 26d | 1 | 0.77mi |
HOA detail condo
- Monthly dues
- $754 · $9,048/yr
- Likely covers
- watersewerlandscapingpool
- Assessments
- None detected in remarks — confirm with the listing agent.
Listing history 26 events
-
2026-06-21days on market $116,000 Active 90 DOM
-
2026-06-18days on market $116,000 Active 87 DOM
-
2026-06-17days on market $116,000 Active 86 DOM
-
2026-06-16days on market $116,000 Active 85 DOM
-
2026-06-15days on market $116,000 Active 84 DOM
-
2026-06-13days on market $116,000 Active 82 DOM
-
2026-06-09days on market $116,000 Active 78 DOM
-
2026-06-08days on market $116,000 Active 77 DOM
-
2026-06-07days on market $116,000 Active 76 DOM
-
2026-06-04days on market $116,000 Active 73 DOM
-
2026-06-03days on market $116,000 Active 72 DOM
-
2026-06-02days on market $116,000 Active 71 DOM
-
2026-06-02price $116,000 Active 70 DOM
-
2026-06-01days on market $126,000 Active 70 DOM
-
2026-05-31days on market $126,000 Active 69 DOM
-
2026-05-08price $126,000 615-char remark
Show marketing remark (615 chars)
This charming 2-bedroom, 2-bath condo offers 1,100+ sqft of comfortable living space within a quiet, well-maintained community. Built in 1961, the property blends classic character with thoughtful updates and functional design. The unit overlooks lush, tree-lined grounds and a beautifully maintained community pool, creating a peaceful and private living environment. Inside, the home features a spacious layout with large rooms, abundant storage, and built-in features, ideal for both owner-occupants and investors. HOA includes water, sewer, exterior insurance, landscaping & grounds and Community amenities.
-
2026-03-19$139,900 Active 615-char remark
Show marketing remark (615 chars)
This charming 2-bedroom, 2-bath condo offers 1,100+ sqft of comfortable living space within a quiet, well-maintained community. Built in 1961, the property blends classic character with thoughtful updates and functional design. The unit overlooks lush, tree-lined grounds and a beautifully maintained community pool, creating a peaceful and private living environment. Inside, the home features a spacious layout with large rooms, abundant storage, and built-in features, ideal for both owner-occupants and investors. HOA includes water, sewer, exterior insurance, landscaping & grounds and Community amenities.
-
2017-10-03soldstatus
-
2017-10-02soldstatus Sold 509-char remark
Show marketing remark (509 chars)
Second-floor 2 BR home overlooks lushly treed, manicured grounds with beautiful community pool. Spacious floor plan with large rooms, abundant storage, & built-ins. Improvements since 2014 include full bamboo floors, new carpet & paint, replacement of HVAC, plantation shutters, & bathroom & kitchen upgrades. Easy access to Medical City, JCC facilities, & exceptional shopping. Refrigerator, washer, and dryer remain. HOA Dues include water, sewer, trash, & blanket insurance.
-
2017-09-16historical Active Option Contract 509-char remark
Show marketing remark (509 chars)
Second-floor 2 BR home overlooks lushly treed, manicured grounds with beautiful community pool. Spacious floor plan with large rooms, abundant storage, & built-ins. Improvements since 2014 include full bamboo floors, new carpet & paint, replacement of HVAC, plantation shutters, & bathroom & kitchen upgrades. Easy access to Medical City, JCC facilities, & exceptional shopping. Refrigerator, washer, and dryer remain. HOA Dues include water, sewer, trash, & blanket insurance.
-
2017-09-07$124,500 Active 509-char remark
Show marketing remark (509 chars)
Second-floor 2 BR home overlooks lushly treed, manicured grounds with beautiful community pool. Spacious floor plan with large rooms, abundant storage, & built-ins. Improvements since 2014 include full bamboo floors, new carpet & paint, replacement of HVAC, plantation shutters, & bathroom & kitchen upgrades. Easy access to Medical City, JCC facilities, & exceptional shopping. Refrigerator, washer, and dryer remain. HOA Dues include water, sewer, trash, & blanket insurance.
-
2014-04-29soldstatus
-
2014-04-15soldstatus Closed
-
2014-04-01historical Active Option Contract
-
2014-03-26$59,900 Active
-
1989-09-19soldstatus
ⓘ Source: listings_history table (triggers on properties + properties_extension) + one-shot
backfill from property_details.listing_events for pre-trigger history.
Tax reassessment forecast TX · Resets to sale price
- Current annual tax
- $3,588 · $299/mo
- Projected year-2 tax
- $3,588 · $299/mo
- Expected delta
- $0/yr ($0/mo · 0.0%)
ⓘ Screening estimate from a state-policy table — verify with the county assessor before closing.
Climate risk First Street
- Flood 1/10 Low FEMA zone X (unshaded) · 0% chance over 30 yrs
- Wildfire 1/10 Low
- Heat 7/10 Severe 7 d/yr ≥109°F today · 24 d/yr by 30 yrs out
- Wind 6/10 Major 27% chance of damaging wind over 30 yrs
- Air quality 3/10 Moderate 3 unhealthy d/yr today · 3 by 30 yrs out
Nearby sold comps map
Loading sold comps map…
Walkable amenities ~0.75 mi
Loading nearby amenities…
Taxation est. · year 1
- Rental income
- $22,127
- − Mortgage interest
- −$6,498
- − Property taxes
- −$3,588
- − Insurance
- −$580
- − Repairs & maintenance
- −$1,770
- − Management
- −$1,770
- − HOA
- −$9,048
- − Depreciation
- −$3,375
- Taxable loss
- −$4,502
- Est. tax savings @ 24.0%
- +$1,081
- After-tax cash flow
- $-1,955/yr
For passive investors: Depreciation is non-cash, so a rental often shows a tax loss while cash-flowing — sheltering income. Rental losses are passive: they offset passive income freely, and up to $25,000/yr can offset ordinary (W-2) income if you actively participate and your MAGI is under $100k (phasing out to $0 by $150k); unused losses carry forward. On sale, claimed depreciation is recaptured at up to 25%, and gains may owe capital-gains tax (a 1031 exchange can defer both). Figures are a year-1 estimate at your 24.0% rate — not tax advice; consult a CPA.
Schools (NCES district)
- District
- Dallas ISD
- NCES district ID
- 4816230
- Math proficiency
- 31% ▼ -16.00%
- Reading proficiency
- 36% ▼ -4.00%
- Median HH income
- $42,881
- Composite
- 28.41/100
- National rank
- #6763
- State rank
- #559 of 826 in TX
Livability — Dallas
- Score
- 81/100
- State rank
- #24
- US rank
- #1380
Category grades
Schools grade is shown separately in the Schools card above.
Census & demographics
- Census place
- Dallas, TX
- County
- Dallas County · 2,612,404 people
- City population
- 1,168,437
- Metro
- Dallas-Fort Worth-Arlington, TX
- Population (ZIP)
- 27,763
- Household income
- $110,956
- Rent vs Own
- Severe rent burden
- 1333.0
Population outlook (Dallas County) Hauer SSP2
- Today (2025)
- 2,979,839 people
- By 2030
- 3,191,823 · +7.1%
- By 2040
- 3,619,611 · +21.5%
- By 2050
- 4,026,915 · +35.1%
- By 2075
- 4,957,073 · +66.4%
- By 2100
- 5,508,725 · +84.9%
Race, ethnicity, and origin ACS 2023
- Neighborhood character
- Predominantly White (72%)
- Race & ethnicity
- White 72% Hispanic / Latino 12% Black 9% Two or more races 8% Asian 4%
- Hispanic origin (detail)
- Mexican 9%
- Common ancestry
- Lithuanian 3% Italian 2% Serbian 2%
- Foreign-born
- 13% · Canada, Vietnam, China
- Languages at home
- 83% English-only · Spanish 8% Other Indo-European 3% French/Haitian/Cajun 1%
Political lean MEDSL · Dallas
- 2024 margin
- Strong D (+22.2) · D 60.2% · R 38.0% · Other 1.8%
- 2008→2024 swing
- +6.9pp toward D · 2008: 15.3pp · 2024: 22.2pp
- All cycles
- 2024: D+22.2 2020: D+31.6 2016: D+26.2 2012: D+15.4 2008: D+15.3
Not yet ingested
- Civics
- —
Market trends
- HPI YoY
- ▼ -595.21%
- Current HPI
- 329.7118
- Rent YoY
- ▲ 2.60%
- Metro
- Dallas-Fort Worth-Arlington, TX
- State GDP YoY
- ▲ 3.95%
- F500 in state
- 110
Industry mix (Fortune 500 HQ in TX)
| Industry | F500 HQs | Revenue |
|---|---|---|
| Energy | 16 | $1,198B |
|
||
| Technology | 5 | $198B |
|
||
| Engineering / Construction | 4 | $72B |
|
||
| Energy Services | 3 | $60B |
|
||
| Utilities | 3 | $41B |
|
||
| Healthcare | 2 | $330B |
|
||
Price history
+110.4% since first listed11 events — show timeline
- 2026-05-08 Price Changed $126,000 NTREIS
- 2026-03-19 Listed $139,900 NTREIS
- 2017-10-03 Sold (Public Records) — Public Records
- 2017-10-02 Sold (MLS) — NTREIS
- 2017-09-16 Contingent — NTREIS
- 2017-09-07 Listed $124,500 NTREIS
- 2014-04-29 Sold (Public Records) — Public Records
- 2014-04-15 Sold (MLS) — NTREIS
- 2014-04-01 Contingent — NTREIS
- 2014-03-26 Listed $59,900 NTREIS
- 1989-09-19 Sold (Public Records) — Public Records
Property tax history
+4.2%/yrLatest (2025): $3,588 · -18.0% YoY. Source: county tax records.
Cash-flow waterfall
monthlySold comps — $/sqft
last 12 mo · ≤1 miLoading sold comps…