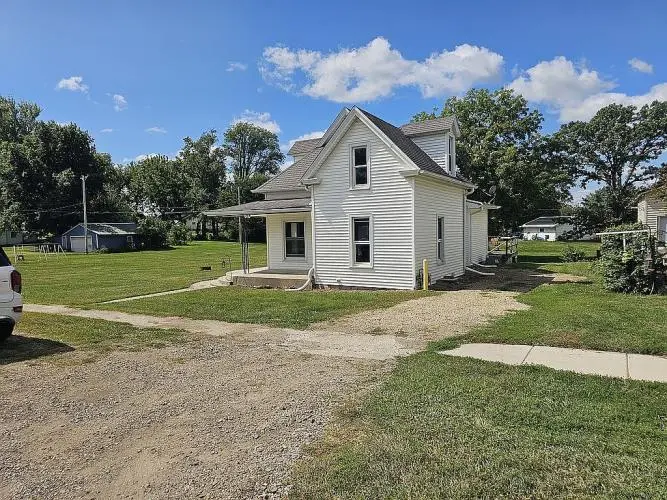
706 S Broadway St · Toledo, IA
Flood risk 1/10 · Minimal
- FEMA flood zone
- X (unshaded)
- Chance of flooding over 30 yrs
- 0.0%
- Est. flood insurance / yr
- $473 – $860
Fire risk 7/10 · Major
- Est. fire insurance / yr
- $902 – $1,676
Heat risk 3/10 · Minor
- Hot days now (above 102°F)
- 7 days/yr
- Hot days in 30 yrs
- 15 days/yr
Wind risk 2/10 · Minimal
- Chance of severe wind over 30 yrs
- —
Air-quality risk 1/10 · Minimal
- Unhealthy air days now
- 0 days/yr
- Unhealthy air days in 30 yrs
- 0 days/yr
Risk factors via First Street. Map © Google.
Why this score? — see what drove the B+ grade
The composite is a weighted blend of 9 inputs, each scored 0–100. Each bar is that input's sub-score; the figure is the points it added to the 100-point composite (weight × sub-score).
- Cash flow +25.1/30.0
- ARV discount +15.0/15.0
- Appreciation +8.4/10.0
- DSCR +8.2/10.0
- 1% rule +6.9/10.0
- Schools +4.0/10.0
- Livability +3.7/5.0
- Rent growth +2.5/5.0
- Condition / age +2.5/5.0
$88,900
🖨 Deal sheet (PDF) 📄 Offer letter ✓ Due diligence
Listing remarks MLS
This diamond in the rough needs some TLC, but has major potential to become a perfect home, rental or flip house for the right person. There are four bedrooms, one on the main floor and Three (plus a bonus room) on the second story. There is a eat in kitchen with laundry on the main floor. The house sits on approximately 3/4 of an acre of ground.
Key facts
- Built 1910
- Listed 270 days
Neighborhood map
What this means for you Summary
Snapshot
- This is a 3-bed/1.0-bath single-family listed at $89k.
Deal economics
- At list price, monthly cash flow is $195 ($2k/yr) — positive.
- The deal already cash-flows at list — no discount required.
- Meets the 1% rule at list price ($1k rent vs $89k).
- Recommended offer: $78k (12.0% below list) — sets the bar for market timing.
Location & tenants
- Location reads 74/100 on livability (#245 in IA, #4,722 nationally) — a middle-class / working-renter tenant base. Strengths: crime A+, cost of living A+, housing A+; Watch: schools C-, amenities F, commute F.
- South Tama County (town): math 44% / reading 50% proficiency, ranked #287 of 289 in IA (top 99%) — families likely to look elsewhere, expect single-tenant / working-renter base with shorter leases.
- Market conditions: 16 active listings in the ZIP; 17 units permitted in Tama County in 2024 (0 in 5+ unit buildings).
Forward outlook
- In year one you build about $7k of equity ($615 loan paydown + $6k appreciation (6.8% local appreciation)).
- Tama County population projected at -15% by 2050 — secular population decline; favor cash flow + early exit over multi-decade hold.
- At projected returns (6.8% appreciation + 3.0% rent growth), your $25k cash investment doubles in ~3 years — after that, you're playing with house money.
- By year 6, paydown + projected appreciation supports a ~$37k cash-out refi (75% LTV) — recoverable capital for the next deal without selling this one.
Negotiation context
- It's been on market 270 days — a 12% lower offer ($78k) is reasonable based on typical stale-listing flexibility.
- Current owner paid $58k; list at $89k implies a 53% gain — meaningful room to come down on a strong offer.
Risks & watch-outs
- Watch-outs: built in 1910 — expect roof / HVAC / electrical / plumbing capex.
- Climate carrying-cost: major wildfire risk — expect insurance premiums to compound above CPI over the hold.
Questions for the listing agent
- It's been on market 270 days. Have you received any prior offers? Is the seller open to a 12% concession, seller financing, or rate buy-down credit?
- Built in 1910 — when were the roof, HVAC, electrical panel, plumbing, and water heater last replaced?
- Why hasn't it sold? Are there any deal-killer items the seller is aware of (foundation, flood, title, zoning, code violations)?
- Is there a deadline driving the sale (1031 exchange, divorce, estate, relocation)? That informs how much negotiation room exists.
- What's the average days-on-market for RENTAL listings here right now (not sales)? A rising rental-DOM trend means longer vacancies and softer asking-rent achievability than the comps imply.
- What's the recent tenant-quality profile in this submarket — average credit score on applications, eviction rate, late-payment / NSF rate, and stable-employment percentage? A property-management company in the area should have these aggregated.
- How much new for-sale + rental construction is in the pipeline within 1–3 miles? Heavy new supply typically softens prices + rents 12–24 months out; constrained supply supports both.
Investment metrics
- 1% rule
- 1.19% ✓
- Cap rate
- 8.93%
- Cash-on-cash
- 9.41%
- DSCR
- 1.42
- GRM
- 7.0
CMA / ARV
- ARV (median comp)
- $146,365
- List price
- $88,900
- Delta
- -39.26%
- Verdict
- UNDERPRICED
- Comps
- 20 within 1.0 mi
Show comp detail 12 sales within ~0.75 mi
| Address | Dist | Beds/Ba | Sqft | Sold | Price | $/sf | Match |
|---|---|---|---|---|---|---|---|
| 809 S Main St | 0.09mi | 3/1.5 | 1,547 (-2%) | 11mo | $155,000 | $100 | 81 |
| 601 S Broadway St | 0.11mi | 4/1.5 (+1) | 1,434 (-10%) | 10mo | $77,777 | $54 | 64 |
| 407 S Broadway St | 0.20mi | 3/1.5 | 1,766 (+11%) | 15mo | $147,000 | $83 | 57 |
| 101 N Wilson St | 0.61mi | 3/1.0 | 1,616 (+2%) | 16mo | $140,000 | $87 | 55 |
| 303 E State St | 0.56mi | 3/1.5 | 1,445 (-9%) | 4mo | $124,900 | $86 | 54 |
| 206 N Green St St | 0.59mi | 3/2.0 | 1,456 (-8%) | 4mo | $155,000 | $106 | 52 |
| 208 E Carleton St | 0.39mi | 3/2.0 | 1,781 (+12%) | 7mo | $157,500 | $88 | 51 |
| 209 S Ann St | 0.65mi | 3/1.0 | 1,728 (+9%) | 6mo | $185,000 | $107 | 50 |
| 106 N Center St | 0.58mi | 3/1.5 | 1,384 (-13%) | 1mo | $185,000 | $134 | 49 |
| 408 & 406 E South St | 0.42mi | 4/2.0 (+1) | 1,701 (+7%) | 23mo | $126,500 | $74 | 40 |
| 708 E College St | 0.56mi | 2/1.5 (-1) | 1,720 (+8%) | 23mo | $180,000 | $105 | 33 |
| 700 E Carleton St | 0.54mi | 4/3.0 (+1) | 1,743 (+10%) | 19mo | $267,500 | $153 | 29 |
Match score weights: distance 35% · size 25% · config 20% · recency 20%. Top-matched comps best support the ARV.
Projected returns pro-forma
6.78% appreciation · 3.0% rent growth · sell at horizon
- IRR
- 24.8%
- Equity multiple
- 2.70×
- Total profit
- $42,313
- Equity at exit
- $60,338
- IRR
- 23.0%
- Equity multiple
- 5.58×
- Total profit
- $113,895
- Equity at exit
- $113,485
Cash invested: $24,892 (down + closing). Projections, not guarantees.
Landlord ↔ Tenant lean methodology
- Overall (STATE)
- 83 Strongly Landlord-Friendly
- State Iowa
- 83 Strongly Landlord-Friendly · R+6
- County
- — inherits STATE
- City
- — inherits STATE
ZIP-level market 52342
- Home prices YoY
- 3.6%
- Active inventory
- 16
- Price-to-rent
- 7.0×
Monthly cashflow live
- Estimated rent
- $1,060 medium interval (Pro) →
- Mortgage (P&I)
- −$466
- Tax from tax record
- −$139 /mo · $1,666/yr
- Insurance
- −$37
- HOA
- −$0
- Vacancy / Maint / Mgmt
- −$223
- Net cashflow
- $195
Break-even live
Sensitivity live
| Price | -10% $245 | -5% $220 | +0% $195 | +5% $170 | +10% $145 |
|---|---|---|---|---|---|
| Rent | -10% $111 | -5% $153 | +0% $195 | +5% $237 | +10% $279 |
| Rate | -1.0pp $240 | -0.5pp $218 | base $195 | +0.5pp $172 | +1.0pp $149 |
UW: 25.0% down · 7.5% · 30yr · 1.5% tax · 5.0% vac · 8.0% maint · 8.0% mgmt
Financing live
Cash to close
- Down payment
- $22,225
- Closing costs
- $2,667
- Reserves months
- —
- Total cash needed
- —
Loan-product check · same deal, 3 products live
Conventional
25% down · 7.5% · 30yr
- Down + closing
- —
- Monthly P&I
- —
- Monthly cashflow
- —
- DSCR
- —
- Eligible?
- —
Personal DTI + credit; lowest rate.
DSCR
20% down · 8.5% · 30yr
- Down + closing
- —
- Monthly P&I
- —
- Monthly cashflow
- —
- DSCR
- —
- Eligible?
- —
No personal income docs; deal must DSCR.
Hard money
10% down · 12.0% · 12mo
- Down + closing
- —
- Monthly P&I
- —
- Monthly cashflow
- —
- DSCR
- —
- Eligible?
- —
Short-term bridge; refi at stabilization.
Listing history 11 events
-
2026-06-09days on market $88,900 Active 270 DOM
-
2026-06-08days on market $88,900 Active 269 DOM
-
2026-06-07days on market $88,900 Active 268 DOM
-
2026-06-05days on market $88,900 Active 265 DOM
-
2026-06-03days on market $88,900 Active 264 DOM
-
2026-06-02days on market $88,900 Active 263 DOM
-
2026-06-01days on market $88,900 Active 262 DOM
-
2026-05-31days on market $88,900 Active 261 DOM
-
2026-05-30days on market $88,900 Active 260 DOM
-
2025-09-10$88,900 Active 348-char remark
Show marketing remark (348 chars)
This diamond in the rough needs some TLC, but has major potential to become a perfect home, rental or flip house for the right person. There are four bedrooms, one on the main floor and Three (plus a bonus room) on the second story. There is a eat in kitchen with laundry on the main floor. The house sits on approximately 3/4 of an acre of ground.
-
2011-08-08soldstatus $58,000
ⓘ Source: listings_history table (triggers on properties + properties_extension) + one-shot
backfill from property_details.listing_events for pre-trigger history.
Tax reassessment forecast IA · Partial reset (capped growth)
- Current annual tax
- $1,666 · $139/mo
- Projected year-2 tax
- $1,666 · $139/mo
- Expected delta
- $0/yr ($0/mo · 0.0%)
ⓘ Screening estimate from a state-policy table — verify with the county assessor before closing.
Climate risk First Street
- Flood 1/10 Low FEMA zone X (unshaded) · 0% chance over 30 yrs
- Wildfire 7/10 Severe
- Heat 3/10 Moderate 7 d/yr ≥102°F today · 15 d/yr by 30 yrs out
- Wind 2/10 Low
- Air quality 1/10 Low 0 unhealthy d/yr today · 0 by 30 yrs out
Nearby sold comps map
Loading sold comps map…
Walkable amenities ~0.75 mi
Loading nearby amenities…
Taxation est. · year 1
- Rental income
- $12,717
- − Mortgage interest
- −$4,980
- − Property taxes
- −$1,666
- − Insurance
- −$444
- − Repairs & maintenance
- −$1,017
- − Management
- −$1,017
- − Depreciation
- −$2,586
- Taxable income
- $1,006
- Est. tax owed @ 24.0%
- −$241
- After-tax cash flow
- $2,100/yr
For passive investors: Depreciation is non-cash, so a rental often shows a tax loss while cash-flowing — sheltering income. Rental losses are passive: they offset passive income freely, and up to $25,000/yr can offset ordinary (W-2) income if you actively participate and your MAGI is under $100k (phasing out to $0 by $150k); unused losses carry forward. On sale, claimed depreciation is recaptured at up to 25%, and gains may owe capital-gains tax (a 1031 exchange can defer both). Figures are a year-1 estimate at your 24.0% rate — not tax advice; consult a CPA.
Schools (NCES district)
- District
- South Tama County
- NCES district ID
- 1926730
- Math proficiency
- 44% ▼ -14.00%
- Reading proficiency
- 50% ▼ -7.00%
- Median HH income
- $46,147
- Composite
- 39.91/100
- National rank
- #3853
- State rank
- #287 of 289 in IA
Livability — Toledo
- Score
- 74/100
- State rank
- #245
- US rank
- #4722
Category grades
Schools grade is shown separately in the Schools card above.
Census & demographics
- Census place
- Toledo, IA
- Population (ZIP)
- 2,898
Population outlook (Tama County) Hauer SSP2
- Today (2025)
- 16,690 people
- By 2030
- 16,217 · -2.8%
- By 2040
- 15,207 · -8.9%
- By 2050
- 14,186 · -15.0%
- By 2075
- 12,228 · -26.7%
- By 2100
- 10,386 · -37.8%
Race, ethnicity, and origin ACS 2023
- Neighborhood character
- Predominantly White (84%)
- Race & ethnicity
- White 84% Hispanic / Latino 7% Native American 6% Two or more races 3% Black 2%
- Hispanic origin (detail)
- Mexican 4%
- Common ancestry
- Portuguese 2% Iranian 2% Slovak 1%
- Foreign-born
- 1% · Canada
- Languages at home
- 94% English-only · Spanish 4%
Political lean MEDSL · Tama
- 2024 margin
- Strong R (+26.9) · D 35.7% · R 62.6% · Other 1.7%
- 2008→2024 swing
- -39.1pp toward R · 2008: 12.2pp · 2024: -26.9pp
- All cycles
- 2024: R+26.9 2020: R+19.1 2016: R+20.6 2012: D+7.4 2008: D+12.2
Not yet ingested
- Civics
- —
Market trends
- HPI YoY
- ▲ 6.78%
- Current HPI
- 195.2678
- Rent YoY
- —
- Metro
- —
- State GDP YoY
- ▲ 2.48%
- F500 in state
- 4
Industry mix (Fortune 500 HQ in IA)
| Industry | F500 HQs | Revenue |
|---|---|---|
| Financial Services | 1 | $16B |
|
||
| Retail / Convenience | 1 | $15B |
|
||
Price history
+53.3% since first listed2 events — show timeline
- 2025-09-10 Listed $88,900 Fizber.com
- 2011-08-08 Sold (Public Records) $58,000 Public Records
Property tax history
+3.8%/yrLatest (2025): $1,666 · +4.8% YoY. Source: county tax records.
Cash-flow waterfall
monthlySold comps — $/sqft
last 12 mo · ≤1 miLoading sold comps…