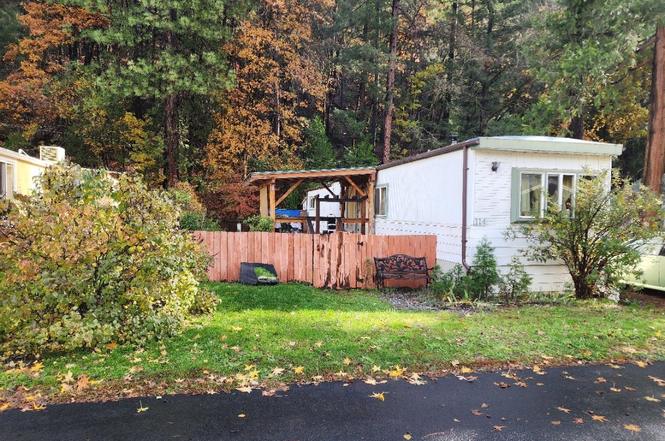
114 Riverwood Way · Castella, CA
Flood risk 8/10 · Major
- FEMA flood zone
- A
- Chance of flooding over 30 yrs
- 0.99%
- Est. flood insurance / yr
- $1,009 – $1,996
Fire risk 7/10 · Major
- Est. fire insurance / yr
- $659 – $1,223
Heat risk 6/10 · Moderate
- Hot days now (above 95°F)
- 10 days/yr
- Hot days in 30 yrs
- 24 days/yr
Wind risk 1/10 · Minimal
- Chance of severe wind over 30 yrs
- —
Air-quality risk 10/10 · Severe
- Unhealthy air days now
- 51 days/yr
- Unhealthy air days in 30 yrs
- 52 days/yr
Risk factors via First Street. Map © Google.
Why this score? — see what drove the C+ grade
The composite is a weighted blend of 9 inputs, each scored 0–100. Each bar is that input's sub-score; the figure is the points it added to the 100-point composite (weight × sub-score).
- Cash flow +30.0/30.0
- 1% rule +10.0/10.0
- DSCR +10.0/10.0
- Schools +4.1/10.0
- ARV discount +3.1/15.0
- Rent growth +2.5/5.0
- Livability +2.5/5.0
- Condition / age +2.5/5.0
- Appreciation +0.0/10.0
$45,000
🖨 Deal sheet 📄 Offer letter ✓ Due diligence
Listing remarks
Welcome to your charming retreat at 114 Riverwood Way in the picturesque town of Dunsmuir, CA. This delightful 2-bedroom, 1-bath home, nestled on a generous lot, offers an inviting atmosphere. Priced at just $50,000, this property presents an exceptional opportunity to own a piece of tranquility in a community rich with natural beauty. The efficient layout seamlessly connects the living area to the kitchen, making it ideal for entertaining friends or enjoying quiet evenings at home. It features a workshop, woodstove and on demand water heater. Outside is a covered patio that beckons you to enjoy morning coffee or evening sunsets while overlooking your expansive lot. With plenty of room for
Key facts
- Expansive lot
- Woodstove
- Covered patio
Tags
Property features AI
Exterior
- Home design: Residential property; Park property subtype; Single-story
- Construction: Metal siding
- Exterior features: Deck; Wood fencing; Shed(s); Level lot
Interior
- Kitchen: Electric range; Dishwasher; Refrigerator
- Flooring: Carpet; Laminate; Wood
- Heating & cooling: Has heating; Wood stove
- Interior features: Dishwasher; Dryer; Electric range; Refrigerator; Washer
- Laundry & utility: Washer; Dryer
Neighborhood map
What this means for you Summary
Snapshot
- This is a 2-bed/1.0-bath single-family listed at $45k.
Deal economics
- At list price, monthly cash flow is $433 ($5k/yr) — positive.
- The deal already cash-flows at list — no discount required.
- Meets the 1% rule at list price ($1k rent vs $45k).
- Recommended offer: $40k (12.0% below list) — sets the bar for market timing.
Location & tenants
- Location reads: area grade C — affects rentability + tenant quality, not the cash-flow math above.
- Dunsmuir Joint Union High (rural): math 25% / reading 75% proficiency, ranked #163 of 517 in CA (top 32%) — acceptable for families but not a draw, mixed tenant base, ~2y average lease.
- Market conditions: 36 active listings in the ZIP; 1 comparable units currently listed for rent nearby; 50 units permitted in Siskiyou County in 2024 (0 in 5+ unit buildings).
Forward outlook
- Local home prices are declining (-3.0%/yr); year-one equity from $311 of loan paydown is wiped out by about $1k of value loss. Plan a longer hold.
- Siskiyou County population projected at -26% by 2050 — secular population decline; favor cash flow + early exit over multi-decade hold.
- At projected returns (-3.0% appreciation + 3.0% rent growth), your $13k cash investment doubles in ~3 years — after that, you're playing with house money.
Negotiation context
- It's been on market 211 days — a 12% lower offer ($40k) is reasonable based on typical stale-listing flexibility.
- 2 sale attempts; this cycle's ask has dropped $13k (22%) from the opening price — seller is motivated, your offer sets the floor, not the list.
Risks & watch-outs
- Watch-outs: flood insurance adds $125/mo.
- Climate carrying-cost: in FEMA flood zone A (mandatory federal flood insurance); major wildfire risk; extreme-heat days projected 10→24/yr by 2055 (HVAC capex compounding) — expect insurance premiums to compound above CPI over the hold.
Questions for the listing agent
- It's been on market 211 days. Have you received any prior offers? Is the seller open to a 12% concession, seller financing, or rate buy-down credit?
- Built in 1975 — when were the roof, HVAC, electrical panel, plumbing, and water heater last replaced?
- What's the actual annual flood-insurance premium (NFIP or private), and is the property in a SFHA with mandatory coverage?
- Why hasn't it sold? Are there any deal-killer items the seller is aware of (foundation, flood, title, zoning, code violations)?
- Is there a deadline driving the sale (1031 exchange, divorce, estate, relocation)? That informs how much negotiation room exists.
- What's the average days-on-market for RENTAL listings here right now (not sales)? A rising rental-DOM trend means longer vacancies and softer asking-rent achievability than the comps imply.
- What's the recent tenant-quality profile in this submarket — average credit score on applications, eviction rate, late-payment / NSF rate, and stable-employment percentage? A property-management company in the area should have these aggregated.
- How much new for-sale + rental construction is in the pipeline within 1–3 miles? Heavy new supply typically softens prices + rents 12–24 months out; constrained supply supports both.
Investment metrics
- 1% rule
- 2.44% ✓
- Cap rate
- 21.17%
- Cash-on-cash
- 53.14%
- DSCR
- 3.36
- GRM
- 3.4
CMA / ARV
- ARV (on-the-fly)
- $41,004
- Comps found
- 1
Show comp detail 1 sale within ~0.75 mi
| Address | Dist | Beds/Ba | Sqft | Sold | Price | $/sf | Match |
|---|---|---|---|---|---|---|---|
| 824 S First St | 0.46mi | 2/1.0 | 894 (+11%) | 14mo | $45,250 | $51 | 48 |
Match score weights: distance 35% · size 25% · config 20% · recency 20%. Top-matched comps best support the ARV.
Projected returns pro-forma
-3.0% appreciation · 3.0% rent growth · sell at horizon
- IRR
- 37.9%
- Equity multiple
- 2.62×
- Total profit
- $20,367
- Equity at exit
- $6,710
- IRR
- 44.4%
- Equity multiple
- 5.25×
- Total profit
- $53,611
- Equity at exit
- $3,891
Cash invested: $12,600 (down + closing). Projections, not guarantees.
Landlord ↔ Tenant lean methodology
- Overall (STATE)
- 18 Strongly Tenant-Friendly
- State California
- 18 Strongly Tenant-Friendly · D+13
- County
- — inherits STATE
- City
- — inherits STATE
ZIP-level market 96025
- Active inventory
- 36
- Price-to-rent
- 3.4×
Monthly cashflow live
- Estimated rent
- $1,100 medium interval (Pro) →
- Mortgage (P&I)
- −$236
- Tax est. 1.5%
- −$56 /mo · $675/yr
- Insurance
- −$19
- Flood insurance flood zone
- −$125 /mo · $1,502/yr
- HOA
- −$0
- Vacancy / Maint / Mgmt
- −$231
- Net cashflow
- $433
Break-even live
UW: 25.0% down · 7.5% · 30yr · 1.5% tax · 5.0% vac · 8.0% maint · 8.0% mgmt
Financing live
Cash to close
- Down payment
- $11,250
- Closing costs
- $1,350
- Reserves months
- —
- Total cash needed
- —
Loan-product check · same deal, 3 products live
Conventional
25% down · 7.5% · 30yr
- Down + closing
- —
- Monthly P&I
- —
- Monthly cashflow
- —
- DSCR
- —
- Eligible?
- —
Personal DTI + credit; lowest rate.
DSCR
20% down · 8.5% · 30yr
- Down + closing
- —
- Monthly P&I
- —
- Monthly cashflow
- —
- DSCR
- —
- Eligible?
- —
No personal income docs; deal must DSCR.
Hard money
10% down · 12.0% · 12mo
- Down + closing
- —
- Monthly P&I
- —
- Monthly cashflow
- —
- DSCR
- —
- Eligible?
- —
Short-term bridge; refi at stabilization.
Rent comps 1 comps
| Address | Beds | Baths | Sqft | Rent | $/sqft | DOM | Units | Dist |
|---|---|---|---|---|---|---|---|---|
| 5945 Shasta Ave Dunsmuir, CA | 3.0 | 1.0 | 800 | $1,100 | $1.38 | 21d | 1 | 1.48mi |
Listing history 20 events
-
2026-06-19days on market $45,000 Active 211 DOM
-
2026-06-18days on market $45,000 Active 210 DOM
-
2026-06-17days on market $45,000 Active 209 DOM
-
2026-06-16days on market $45,000 Active 208 DOM
-
2026-06-15days on market $45,000 Active 207 DOM
-
2026-06-14days on market $45,000 Active 205 DOM
-
2026-06-13price $45,000 Active 204 DOM
-
2026-06-12days on market $50,000 Active 204 DOM
-
2026-06-09days on market $50,000 Active 201 DOM
-
2026-06-08days on market $50,000 Active 200 DOM
-
2026-06-07days on market $50,000 Active 199 DOM
-
2026-06-07days on market $50,000 Active 198 DOM
-
2026-06-04days on market $50,000 Active 195 DOM
-
2026-06-02days on market $50,000 Active 194 DOM
-
2026-06-01days on market $50,000 Active 193 DOM
-
2026-05-31days on market $50,000 Active 192 DOM
-
2026-05-31days on market $50,000 Active 191 DOM
-
2026-02-27price $50,000
-
2025-12-29status Active
-
2025-11-14$58,000 Active
ⓘ Source: listings_history table (triggers on properties + properties_extension) + one-shot
backfill from property_details.listing_events for pre-trigger history.
Climate risk First Street
- Flood 8/10 Severe FEMA zone A · 99% chance over 30 yrs
- Wildfire 7/10 Severe
- Heat 6/10 Major 10 d/yr ≥95°F today · 24 d/yr by 30 yrs out
- Wind 1/10 Low
- Air quality 10/10 Extreme 51 unhealthy d/yr today · 52 by 30 yrs out
Nearby sold comps map
Loading sold comps map…
Walkable amenities ~0.75 mi
Loading nearby amenities…
Taxation est. · year 1
- Rental income
- $13,200
- − Mortgage interest
- −$2,521
- − Property taxes
- −$675
- − Insurance
- −$1,727
- − Repairs & maintenance
- −$1,056
- − Management
- −$1,056
- − Depreciation
- −$1,309
- Taxable income
- $4,856
- Est. tax owed @ 24.0%
- −$1,165
- After-tax cash flow
- $4,028/yr
For passive investors: Depreciation is non-cash, so a rental often shows a tax loss while cash-flowing — sheltering income. Rental losses are passive: they offset passive income freely, and up to $25,000/yr can offset ordinary (W-2) income if you actively participate and your MAGI is under $100k (phasing out to $0 by $150k); unused losses carry forward. On sale, claimed depreciation is recaptured at up to 25%, and gains may owe capital-gains tax (a 1031 exchange can defer both). Figures are a year-1 estimate at your 24.0% rate — not tax advice; consult a CPA.
Schools (NCES district)
- District
- Dunsmuir Joint Union High
- NCES district ID
- 0611700
- Math proficiency
- 25% ▲ 25.00%
- Reading proficiency
- 75% ▲ 75.00%
- Median HH income
- $32,255
- Composite
- 40.88/100
- National rank
- #3620
- State rank
- #163 of 517 in CA
Livability — Castella
No livability data for this city. (Only ~50 U.S. cities are tracked.)
Census & demographics
- Population (ZIP)
- 2,150
Population outlook (Siskiyou County) Hauer SSP2
- Today (2025)
- 39,337 people
- By 2030
- 36,930 · -6.1%
- By 2040
- 32,367 · -17.7%
- By 2050
- 29,030 · -26.2%
- By 2075
- 23,534 · -40.2%
- By 2100
- 19,312 · -50.9%
Race, ethnicity, and origin ACS 2023
- Neighborhood character
- Predominantly White (76%)
- Race & ethnicity
- White 76% Two or more races 13% Hispanic / Latino 12% Asian 1% Black 1% Native American 1%
- Hispanic origin (detail)
- Mexican 9%
- Common ancestry
- Italian 4% Romanian 4% Lithuanian 3%
- Foreign-born
- 6% · Canada, China, South Korea
- Languages at home
- 94% English-only · Spanish 4% Other Indo-European 1%
Political lean MEDSL · Siskiyou
- 2024 margin
- R (+19.2) · D 38.8% · R 58.0% · Other 3.2%
- 2008→2024 swing
- -8.8pp toward R · 2008: -10.4pp · 2024: -19.2pp
- All cycles
- 2024: R+19.2 2020: R+15.8 2016: R+20.7 2012: R+15.6 2008: R+10.4
Not yet ingested
- Civics
- —
Market trends
- HPI YoY
- ▼ -140.66%
- Current HPI
- 144.676
- Rent YoY
- —
- Metro
- —
- State GDP YoY
- ▲ 3.21%
- F500 in state
- 116
Industry mix (Fortune 500 HQ in CA)
| Industry | F500 HQs | Revenue |
|---|---|---|
| Technology | 27 | $1,492B |
|
||
| Financial Services | 3 | $174B |
|
||
| Retail | 3 | $44B |
|
||
| Insurance | 3 | $26B |
|
||
| Media / Entertainment | 2 | $115B |
|
||
| Pharmaceuticals / Biotech | 2 | $62B |
|
||
Price history
-13.8% since first listed3 events — show timeline
- 2026-02-27 Price Changed $50,000 SMLS
- 2025-12-29 Relisted — SMLS
- 2025-11-14 Listed $58,000 SMLS
Cash-flow waterfall
monthlySold comps — $/sqft
last 12 mo · ≤1 miLoading sold comps…