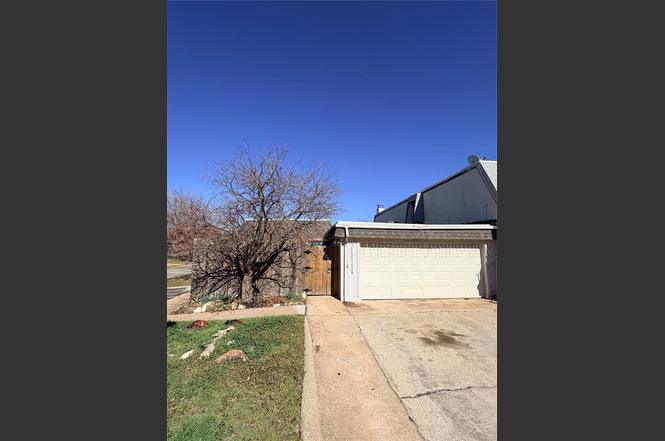
4056 NW 36th St · Oklahoma City, OK
Flood risk 1/10 · Minimal
- FEMA flood zone
- X (unshaded)
- Chance of flooding over 30 yrs
- 0.0%
- Est. flood insurance / yr
- $507 – $1,088
Fire risk 1/10 · Minimal
- Est. fire insurance / yr
- $2,463 – $4,575
Heat risk 5/10 · Moderate
- Hot days now (above 107°F)
- 6 days/yr
- Hot days in 30 yrs
- 16 days/yr
Wind risk 2/10 · Minimal
- Chance of severe wind over 30 yrs
- 3.0%
Air-quality risk 2/10 · Minimal
- Unhealthy air days now
- 1 days/yr
- Unhealthy air days in 30 yrs
- 2 days/yr
Risk factors via First Street. Map © Google.
Why this score? — see what drove the C grade
The composite is a weighted blend of 9 inputs, each scored 0–100. Each bar is that input's sub-score; the figure is the points it added to the 100-point composite (weight × sub-score).
- Cash flow +22.3/30.0
- 1% rule +8.1/10.0
- ARV discount +7.5/15.0
- DSCR +7.1/10.0
- Livability +4.0/5.0
- Rent growth +3.7/5.0
- Condition / age +2.5/5.0
- Schools +1.3/10.0
- Appreciation +0.0/10.0
$79,900
🖨 Deal sheet 📄 Offer letter ✓ Due diligence
Listing remarks MLS
SOLD DURING PROCESSING; SELLER IS A LICENSED REAL ESTATE BROKERAGE SELLING OWN PROPERTY MANOR 3 UNIT 1, WILLOW SPRINGS MANOR
Key facts
- Tile flooring
- $200 HOA
- 2 garage spots
Tags
Property features AI
Finance
- Other: Homestead exemption claimed
- Financial info: Property is assumable; Buyer may qualify for loan; Sold as-is
- HOA & community: Mandatory association dues; Association fee $2,400; HOA covers garbage, insurance, exterior maintenance, and partial utilities
Exterior
- Parking: Concrete parking; 2-car garage
- Security: Security system; Smoke alarm
- Utilities: Utilities details not provided
- Home design: Residential condominium; Flat entry level (condo); Faces south; Existing property
- Construction: Concrete, frame, and masonry veneer construction; Other roof type; Double-pane windows; Slab foundation; Handicap accessible
- Exterior features: Covered patio; Open deck; Corner lot
Interior
- Kitchen: Built-in electric range and oven
- Bedrooms: 2 bedrooms
- Flooring: Tile
- Bathrooms: 1 full bathroom
- Heating & cooling: Electric heating
- Interior features: Accessible bedroom and central living area and kitchen; Security system and smoke alarm; Tile flooring; No fireplace; Two living areas; One dining area
- Laundry & utility: Washer/dryer info not provided
Neighborhood map
What this means for you Summary
Snapshot
- This is a 2-bed/1.0-bath condo listed at $80k.
Deal economics
- At list price, monthly cash flow is $131 ($2k/yr) — positive.
- The deal already cash-flows at list — no discount required.
- Meets the 1% rule at list price ($1k rent vs $80k).
- Recommended offer: $70k (12.0% below list) — sets the bar for market timing.
- Cap rate 8.3% vs local median 3.7% in Oklahoma City — top-decile yield for the area; either an underpriced asset or a hidden risk that comps aren't pricing in. Stress-test before assuming the spread holds.
Location & tenants
- Location reads 80/100 on livability (#3 in OK, #1,635 nationally) — a professional / high-income tenant draw. Strengths: amenities A+, commute A+, cost of living A+; Watch: crime F.
- Putnam City (urban): math 12% / reading 16% proficiency, ranked #227 of 270 in OK (top 84%) — low school quality limits family demand, transient renter base, plan for 1-2y turnover; 65% free/reduced lunch — lower-income household profile, screen leases tightly.
- Zoned schools: Windsor Hills Es (math 11% / reading 9%, grade F, #695 of 845 statewide, top 84%, 688 students, 0% FRL); Putnam City West Hs (math 10% / reading 20%, grade F, #323 of 447 statewide, top 74%, 1,803 students, 0% FRL) — zoned schools average 0% FRL vs 65% district-wide (65 pts lower); this property's tenant base skews higher-income than the district average.
- Market conditions: Rents rising fast (+4.8%/yr); 192 active listings in the ZIP; 40 comparable units currently listed for rent nearby; rentals at typical pace (median 17d on market — plan ~3-4 weeks tenant-placement turnaround); 5,365 units permitted in Oklahoma County in 2024 (569 in 5+ unit buildings).
Forward outlook
- Local home prices are declining (-3.0%/yr); year-one equity from $552 of loan paydown is wiped out by about $2k of value loss. Plan a longer hold.
- Oklahoma County population projected at +41% by 2050 — long-run rental-demand tailwind backs the buy-and-hold thesis.
- At projected returns (-3.0% appreciation + 4.8% rent growth), your $22k cash investment doubles in ~10 years — after that, you're playing with house money.
Negotiation context
- It's been on market 126 days — a 12% lower offer ($70k) is reasonable based on typical stale-listing flexibility.
- 5 sale attempts since 27y ago; this cycle's ask has dropped $10k (11%) from the opening price — seller is motivated, your offer sets the floor, not the list.
- Current owner paid $40k; list at $80k implies a 100% gain — meaningful room to come down on a strong offer.
Risks & watch-outs
- Climate carrying-cost: extreme-heat days projected 6→16/yr by 2055 (HVAC capex compounding) — expect insurance premiums to compound above CPI over the hold.
Questions for the listing agent
- It's been on market 126 days. Have you received any prior offers? Is the seller open to a 12% concession, seller financing, or rate buy-down credit?
- Built in 1973 — when were the roof, HVAC, electrical panel, plumbing, and water heater last replaced?
- What does the HOA fee cover, when was the last increase, and are there any pending special assessments or reserve-fund shortfalls?
- Any open or pending special assessments — roof, HVAC, plumbing, elevator, façade? What's the per-unit balance and payoff schedule, and is the seller paying it off at close or rolling it to the buyer?
- Why hasn't it sold? Are there any deal-killer items the seller is aware of (foundation, flood, title, zoning, code violations)?
- Is there a deadline driving the sale (1031 exchange, divorce, estate, relocation)? That informs how much negotiation room exists.
- Schools are F-rated, which usually means shorter tenancies and higher turnover. Who's the typical renter profile here, and what's been the actual vacancy rate?
- Crime grade is F in this area — have there been break-ins, vandalism, or insurance claims at this property in the last 3 years? What carrier currently insures it and at what premium?
- What's the average days-on-market for RENTAL listings here right now (not sales)? A rising rental-DOM trend means longer vacancies and softer asking-rent achievability than the comps imply.
- What's the recent tenant-quality profile in this submarket — average credit score on applications, eviction rate, late-payment / NSF rate, and stable-employment percentage? A property-management company in the area should have these aggregated.
- How much new apartment / multifamily construction is in the pipeline within 1–3 miles? Heavy new supply (>2% of stock underway) typically softens rents 12–24 months out; light construction supports rent growth.
Investment metrics
- 1% rule
- 1.31% ✓
- Cap rate
- 8.26%
- Cash-on-cash
- 7.03%
- DSCR
- 1.31
- GRM
- 6.3
CMA / ARV
No comps found within radius.
Projected returns pro-forma
-3.0% appreciation · 4.8% rent growth · sell at horizon
- IRR
- -3.0%
- Equity multiple
- 0.89×
- Total profit
- $-2,561
- Equity at exit
- $11,913
- IRR
- 9.1%
- Equity multiple
- 1.77×
- Total profit
- $17,175
- Equity at exit
- $6,908
Cash invested: $22,372 (down + closing). Projections, not guarantees.
Landlord ↔ Tenant lean methodology
- Overall (STATE)
- 83 Strongly Landlord-Friendly
- State Oklahoma
- 83 Strongly Landlord-Friendly · R+20
- County
- — inherits STATE
- City
- — inherits STATE
ZIP-level market 73112
- Rents YoY
- 4.8%
- Active inventory
- 192
- Price-to-rent
- 6.3×
Monthly cashflow live
- Estimated rent
- $1,049 high interval (Pro) →
- Mortgage (P&I)
- −$419
- Tax from tax record
- −$45 /mo · $540/yr
- Insurance
- −$33
- HOA
- −$200
- Vacancy / Maint / Mgmt
- −$220
- Net cashflow
- $131
Break-even live
UW: 25.0% down · 7.5% · 30yr · 1.5% tax · 5.0% vac · 8.0% maint · 8.0% mgmt
Financing live
Cash to close
- Down payment
- $19,975
- Closing costs
- $2,397
- Reserves months
- —
- Total cash needed
- —
Loan-product check · same deal, 3 products live
Conventional
25% down · 7.5% · 30yr
- Down + closing
- —
- Monthly P&I
- —
- Monthly cashflow
- —
- DSCR
- —
- Eligible?
- —
Personal DTI + credit; lowest rate.
DSCR
20% down · 8.5% · 30yr
- Down + closing
- —
- Monthly P&I
- —
- Monthly cashflow
- —
- DSCR
- —
- Eligible?
- —
No personal income docs; deal must DSCR.
Hard money
10% down · 12.0% · 12mo
- Down + closing
- —
- Monthly P&I
- —
- Monthly cashflow
- —
- DSCR
- —
- Eligible?
- —
Short-term bridge; refi at stabilization.
Rent comps 40 comps
| Address | Beds | Baths | Sqft | Rent | $/sqft | DOM | Units | Dist |
|---|---|---|---|---|---|---|---|---|
| 3615 N Tulsa Ave Oklahoma City, OK | 1.0 | 1.0 | 700 | $775 | $1.11 | 43d | 1 | 0.12mi |
| 3929 NW 32nd St Oklahoma City, OK | 3.0 | 1.0 | 1050 | $1,300 | $1.24 | 43d | 1 | 0.28mi |
| 3912 NW 32nd St Oklahoma City, OK | 2.0 | 1.0 | 894 | $1,099 | $1.23 | 43d | 1 | 0.32mi |
| 4396 NW 36th St Oklahoma City, OK | 1.0–3.0 | 1.0–2.0 | 848 | $1,044 | $1.23 | 1d | 9 | 0.46mi |
| 4200 N Meridian Ave Oklahoma City, OK | 1.0–2.0 | 1.0–2.0 | 801 | $1,289 | $1.61 | 4d | 29 | 0.58mi |
| 3175 N Portland Ave Oklahoma City, OK | 2.0 | 2.0 | 918 | $960 | $1.05 | 23d | 1 | 0.61mi |
| 3175 N Portland Ave Oklahoma City, OK | 1.0 | 1.0 | 700 | $834 | $1.19 | 14d | 1 | 0.61mi |
| 3175 N Portland Ave Oklahoma City, OK | 2.0 | 1.0 | 865 | $899 | $1.04 | 43d | 1 | 0.61mi |
| 3175 N Portland Ave Oklahoma City, OK | 1.0–2.0 | 1.0–2.0 | 809 | $960 | $1.19 | 15d | 3 | 0.61mi |
| 4020 N Meridian Ave Oklahoma City, OK | 2.0 | 1.0 | 700 | $849 | $1.21 | 23d | 1 | 0.61mi |
| 3624 NW 42nd St Oklahoma City, OK | 1.0–2.0 | 1.0–2.0 | 1050 | $899 | $0.86 | 2d | 1 | 0.64mi |
| 4529 NW 33rd St Oklahoma City, OK | 3.0 | 1.0 | 950 | $1,280 | $1.35 | 2d | 1 | 0.68mi |
| 3827 N Harvard Ave Oklahoma City, OK | 2.0 | 1.5 | 988 | $1,100 | $1.11 | 21d | 1 | 0.68mi |
| 3790 N Nicklas Ave Unit 3790 Oklahoma City, OK | 1.0 | 1.0 | 720 | $650 | $0.90 | 23d | 1 | 0.72mi |
| 3742 N Nicklas Ave Unit 3742 Oklahoma City, OK | 1.0 | 1.0 | 720 | $650 | $0.90 | 4d | 1 | 0.72mi |
| 3792 N Nicklas Ave Oklahoma City, OK | 1.0 | 1.0 | 720 | $650 | $0.90 | 23d | 1 | 0.72mi |
| 3033 N Grand Blvd Oklahoma City, OK | 1.0 | 1.0 | 672 | $675 | $1.00 | 1d | 1 | 0.77mi |
| 3829 NW 26th St Oklahoma City, OK | 2.0 | 1.0 | 895 | $1,125 | $1.26 | 2d | 1 | 0.84mi |
| 2626 N Meridian Ave Oklahoma City, OK | 1.0–2.0 | 1.0–2.0 | 1040 | $845 | $0.81 | 3d | 1 | 0.98mi |
| 3905 NW 23rd St Oklahoma City, OK | 2.0 | 1.5 | 1044 | $1,100 | $1.05 | 16d | 1 | 1.00mi |
| 3221 NW 39th Ter Oklahoma City, OK | 3.0 | 1.0 | 1073 | $1,350 | $1.26 | 16d | 1 | 1.04mi |
| 4204 NW 51st St Unit 2 Oklahoma City, OK | 2.0 | 2.0 | 1005 | $1,495 | $1.49 | 23d | 1 | 1.06mi |
| 3801 NW 51st St Oklahoma City, OK | 2.0 | 1.0 | 818 | $1,100 | $1.34 | 23d | 1 | 1.09mi |
| 3733 NW 22nd St Apt 210 Oklahoma City, OK | 2.0 | 1.0 | 850 | $950 | $1.12 | 43d | 1 | 1.11mi |
| 3141 NW 32nd St Oklahoma City, OK | 2.0 | 1.0 | 1010 | $1,025 | $1.01 | 21d | 1 | 1.13mi |
| 3541 NW 50th St Oklahoma City, OK | 2.0 | 1.0 | 980 | $949 | $0.97 | 43d | 1 | 1.15mi |
| 3116 NW 32nd St Oklahoma City, OK | 2.0 | 1.0 | 720 | $950 | $1.32 | 3d | 1 | 1.19mi |
| 3112 Cashion Pl Oklahoma City, OK | 3.0 | 1.0 | 968 | $1,150 | $1.19 | 10d | 1 | 1.23mi |
| 2325 N Meridian Ave Oklahoma City, OK | 2.0 | 1.0 | 800 | $850 | $1.06 | 11d | 1 | 1.24mi |
| 2325 N Meridian Ave Oklahoma City, OK | 2.0 | 1.0 | 800 | $850 | $1.06 | 23d | 1 | 1.24mi |
| 3228 NW 27th St Oklahoma City, OK | 2.0 | 1.0 | 1088 | $1,195 | $1.10 | 11d | 1 | 1.25mi |
| 4301 N Wall St Warr Acres, OK | 3.0 | 1.0 | 747 | $1,775 | $2.38 | 19d | 1 | 1.27mi |
| 2317 N Meridian Ave Unit 35 Oklahoma City, OK | 2.0 | 1.0 | 800 | $850 | $1.06 | 16d | 1 | 1.27mi |
| 4600 N Hamilton Dr Oklahoma City, OK | 2.0 | 1.0 | 708 | $1,050 | $1.48 | 43d | 1 | 1.32mi |
| 5418 N Meridian Ave Oklahoma City, OK | 2.0 | 1.0–2.0 | 690 | $940 | $1.36 | 2d | 14 | 1.33mi |
| 3800 NW 19th St Oklahoma City, OK | 3.0 | 1.0 | 1073 | $1,250 | $1.16 | 23d | 1 | 1.35mi |
| 3044 NW 28th St Oklahoma City, OK | 3.0 | 1.0 | 1030 | $1,150 | $1.12 | 2d | 1 | 1.36mi |
| 3045 Pioneer St Oklahoma City, OK | 2.0 | 1.0 | 857 | $1,050 | $1.23 | 16d | 1 | 1.38mi |
| 4746 NW 23rd St Oklahoma City, OK | 2.0 | 1.0 | 975 | $815 | $0.84 | 2d | 1 | 1.38mi |
| 4746 NW 23rd St Oklahoma City, OK | 2.0 | 1.0 | 975 | $725 | $0.74 | 23d | 1 | 1.38mi |
HOA detail condo
- Monthly dues
- $200 · $2,400/yr
- Assessments
- None detected in remarks — confirm with the listing agent.
Listing history 24 events
-
2026-06-18days on market $79,900 Active 126 DOM
-
2026-06-17days on market $79,900 Active 125 DOM
-
2026-06-16days on market $79,900 Active 124 DOM
-
2026-06-15days on market $79,900 Active 123 DOM
-
2026-06-13days on market $79,900 Active 121 DOM
-
2026-06-13days on market $79,900 Active 120 DOM
-
2026-06-09days on market $79,900 Active 117 DOM
-
2026-06-08days on market $79,900 Active 116 DOM
-
2026-06-07days on market $79,900 Active 115 DOM
-
2026-06-03days on market $79,900 Active 111 DOM
-
2026-06-02days on market $79,900 Active 110 DOM
-
2026-06-01days on market $79,900 Active 109 DOM
-
2026-05-31days on market $79,900 Active 108 DOM
-
2026-04-16price $79,900
-
2026-04-09status Active
-
2026-03-25status Pending
-
2026-03-14status Active
-
2026-02-24status Pending
-
2026-02-18status Active
-
2026-02-17price $84,900
-
2026-01-08$89,900 Active
-
1999-05-03soldstatus $39,900 126-char remark
Show marketing remark (126 chars)
SOLD DURING PROCESSING; SELLER IS A LICENSED REAL ESTATE BROKERAGE SELLING OWN PROPERTY MANOR 3 UNIT 1, WILLOW SPRINGS MANOR
-
1999-03-15$39,900 126-char remark
Show marketing remark (126 chars)
SOLD DURING PROCESSING; SELLER IS A LICENSED REAL ESTATE BROKERAGE SELLING OWN PROPERTY MANOR 3 UNIT 1, WILLOW SPRINGS MANOR
-
1984-03-01soldstatus $54,000
ⓘ Source: listings_history table (triggers on properties + properties_extension) + one-shot
backfill from property_details.listing_events for pre-trigger history.
Tax reassessment forecast OK · Resets to sale price
- Current annual tax
- $540 · $45/mo
- Projected year-2 tax
- $719 · $60/mo
- Expected delta
- +$179/yr (+$15/mo · 33.2%)
ⓘ Screening estimate from a state-policy table — verify with the county assessor before closing.
Climate risk First Street
- Flood 1/10 Low FEMA zone X (unshaded) · 0% chance over 30 yrs
- Wildfire 1/10 Low
- Heat 5/10 Major 6 d/yr ≥107°F today · 16 d/yr by 30 yrs out
- Wind 2/10 Low 3% chance of damaging wind over 30 yrs
- Air quality 2/10 Low 1 unhealthy d/yr today · 2 by 30 yrs out
Nearby sold comps map
Loading sold comps map…
Walkable amenities ~0.75 mi
Loading nearby amenities…
Taxation est. · year 1
- Rental income
- $12,583
- − Mortgage interest
- −$4,476
- − Property taxes
- −$540
- − Insurance
- −$400
- − Repairs & maintenance
- −$1,007
- − Management
- −$1,007
- − HOA
- −$2,400
- − Depreciation
- −$2,324
- Taxable income
- $430
- Est. tax owed @ 24.0%
- −$103
- After-tax cash flow
- $1,470/yr
For passive investors: Depreciation is non-cash, so a rental often shows a tax loss while cash-flowing — sheltering income. Rental losses are passive: they offset passive income freely, and up to $25,000/yr can offset ordinary (W-2) income if you actively participate and your MAGI is under $100k (phasing out to $0 by $150k); unused losses carry forward. On sale, claimed depreciation is recaptured at up to 25%, and gains may owe capital-gains tax (a 1031 exchange can defer both). Figures are a year-1 estimate at your 24.0% rate — not tax advice; consult a CPA.
Schools (NCES district)
- District
- Putnam City
- NCES district ID
- 4025290
- Math proficiency
- 12% ▼ -18.00%
- Reading proficiency
- 16% ▼ -14.00%
- Median HH income
- $46,657
- Composite
- 12.61/100
- National rank
- #9614
- State rank
- #227 of 270 in OK
Livability — Oklahoma City
- Score
- 80/100
- State rank
- #3
- US rank
- #1635
Category grades
Schools grade is shown separately in the Schools card above.
Census & demographics
- Census place
- Oklahoma City, OK
- County
- Oklahoma County · 771,644 people
- City population
- 498,656
- Metro
- Oklahoma City, OK
- Population (ZIP)
- 30,372
- Household income
- $58,419
- Rent vs Own
- Severe rent burden
- 1555.0
Population outlook (Oklahoma County) Hauer SSP2
- Today (2025)
- 911,875 people
- By 2030
- 982,413 · +7.7%
- By 2040
- 1,130,468 · +24.0%
- By 2050
- 1,288,422 · +41.3%
- By 2075
- 1,711,482 · +87.7%
- By 2100
- 2,088,448 · +129.0%
Race, ethnicity, and origin ACS 2023
- Neighborhood character
- Diverse neighborhood (Simpson 0.65)
- Race & ethnicity
- White 55% Hispanic / Latino 18% Black 13% Two or more races 12% Asian 4% Native American 3%
- Hispanic origin (detail)
- Mexican 12%
- Common ancestry
- Italian 3% Lithuanian 2% Slovak 2%
- Foreign-born
- 12% · Canada, Vietnam, China
- Languages at home
- 82% English-only · Spanish 12% Other Indo-European 1% Vietnamese 1%
Political lean MEDSL · Oklahoma
- 2024 margin
- Toss-up / Even · D 48.0% · R 49.7% · Other 2.3%
- 2008→2024 swing
- +15.1pp toward D · 2008: -16.8pp · 2024: -1.7pp
- All cycles
- 2024: R+1.7 2020: R+1.1 2016: R+10.5 2012: R+16.7 2008: R+16.8
Not yet ingested
- Civics
- —
Market trends
- HPI YoY
- ▼ -283.17%
- Current HPI
- 253.682
- Rent YoY
- ▲ 4.80%
- Metro
- Oklahoma City, OK
- State GDP YoY
- ▲ 1.55%
- F500 in state
- 6
Industry mix (Fortune 500 HQ in OK)
| Industry | F500 HQs | Revenue |
|---|---|---|
| Energy | 3 | $48B |
|
||
Price history
+48.0% since first listed11 events — show timeline
- 2026-04-16 Price Changed $79,900 MLSOK
- 2026-04-09 Relisted — MLSOK
- 2026-03-25 Pending — MLSOK
- 2026-03-14 Relisted — MLSOK
- 2026-02-24 Pending — MLSOK
- 2026-02-18 Relisted — MLSOK
- 2026-02-17 Price Changed $84,900 MLSOK
- 2026-01-08 Listed $89,900 MLSOK
- 1999-05-03 Sold (MLS) $39,900 MLSOK
- 1999-03-15 Listed $39,900 MLSOK
- 1984-03-01 Sold (Public Records) $54,000 Public Records
Property tax history
+6.5%/yrLatest (2025): $540 · +4.5% YoY. Source: county tax records.
Cash-flow waterfall
monthlySold comps — $/sqft
last 12 mo · ≤1 miLoading sold comps…