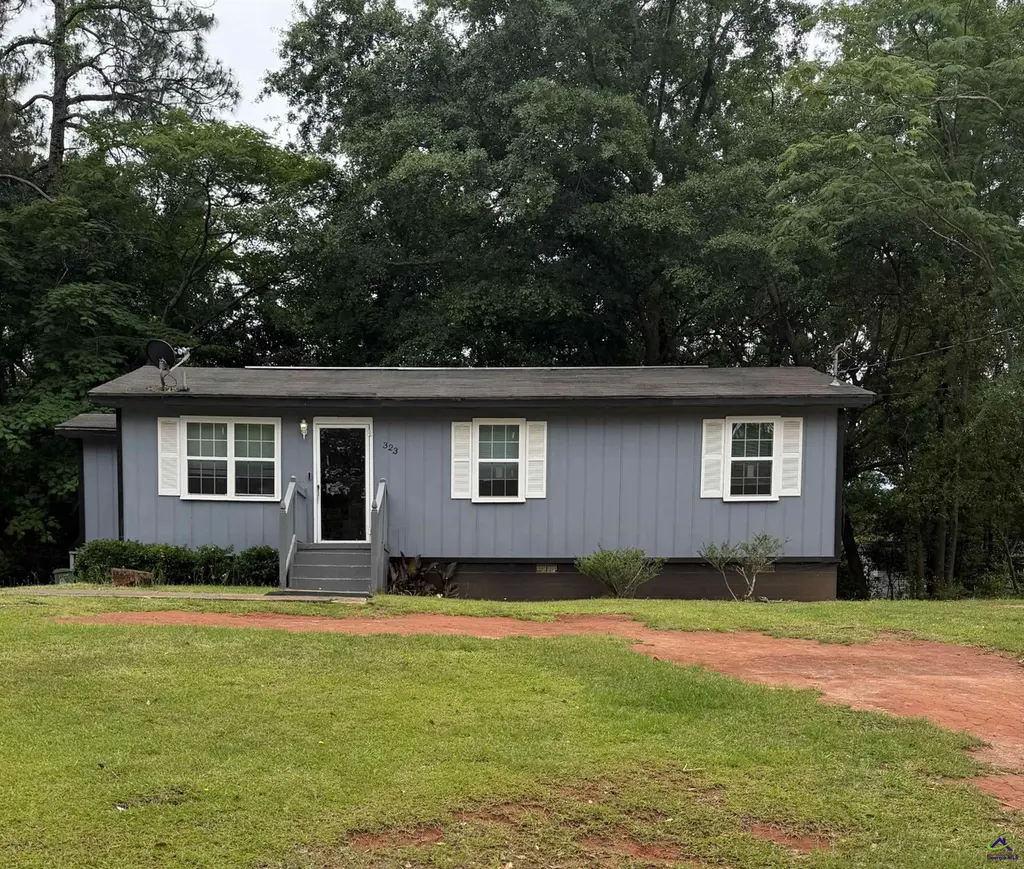
323 Peach Cir · Fort Valley, GA
Flood risk 1/10 · Minimal
- FEMA flood zone
- X (unshaded)
- Chance of flooding over 30 yrs
- 0.0%
- Est. flood insurance / yr
- $507 – $1,088
Fire risk 4/10 · Minor
- Est. fire insurance / yr
- $963 – $1,789
Heat risk 6/10 · Moderate
- Hot days now (above 107°F)
- 7 days/yr
- Hot days in 30 yrs
- 18 days/yr
Wind risk 8/10 · Major
- Chance of severe wind over 30 yrs
- 80.0%
Air-quality risk 3/10 · Minor
- Unhealthy air days now
- 2 days/yr
- Unhealthy air days in 30 yrs
- 2 days/yr
Risk factors via First Street. Map © Google.
Why this score? — see what drove the D- grade
The composite is a weighted blend of 9 inputs, each scored 0–100. Each bar is that input's sub-score; the figure is the points it added to the 100-point composite (weight × sub-score).
- Cash flow +18.3/30.0
- DSCR +5.8/10.0
- 1% rule +4.3/10.0
- Livability +3.2/5.0
- Rent growth +2.5/5.0
- Condition / age +2.5/5.0
- Schools +1.8/10.0
- ARV discount +0.0/15.0
- Appreciation +0.0/10.0
$105,000
🖨 Deal sheet 📄 Offer letter ✓ Due diligence
Listing remarks
Great Investment Opportunity in Fort Valley, GA! Well maintained and located in a quiet and friendly neighborhood. This property offers solid potential for rental income or owner occupancy with desirable location and practical floor plan. Convenient access to local schools, colleges, dining and major roadways. Don’t miss the opportunity to own this “peach” of a deal!
Key facts
- Quiet neighborhood
- Rental income
- 0.29 acre lot
Tags
Property features AI
Finance
- Other: Approximate above-grade finished area: 848 (square feet); Lot size about 0.29 acres
- Financial info: Financial details not provided
- HOA & community: Subdivision: Peach Valley
Exterior
- Parking: No garage
- Security: Security information not provided
- Utilities: Public water; Public sewer; Cable available
- Home design: Single-family residence; One story
- Construction: Wood siding; Crawl space foundation
- Exterior features: Deck
Interior
- Kitchen: Electric range; Microwave; Refrigerator
- Bedrooms: Bedrooms information not provided
- Flooring: Carpet; Vinyl
- Bathrooms: 1 full bathroom
- Heating & cooling: Central heating; Central air conditioning
- Interior features: Ceiling fan(s); Blinds
- Laundry & utility: Laundry information not provided
Neighborhood map
What this means for you Summary
Snapshot
- This is a 2-bed/1.0-bath single-family listed at $105k.
Deal economics
- At list price, monthly cash flow is $97 ($1k/yr) — positive.
- The deal already cash-flows at list — no discount required.
- To meet the 1% rule (rent ≥ 1% of price), the offer needs to be $98k (7.0% below list).
- Recommended offer: $98k (7.0% below list) — sets the bar for 1% rule.
- Cap rate 7.4% vs local median 5.7% in Fort Valley — top-decile yield for the area; either an underpriced asset or a hidden risk that comps aren't pricing in. Stress-test before assuming the spread holds.
Location & tenants
- Location reads 65/100 on livability (#220 in GA) — a middle-class / working-renter tenant base. Strengths: cost of living A+, health & safety A+, housing A-; Watch: crime D+, amenities F, commute F.
- Peach County (rural): math 17% / reading 25% proficiency, ranked #141 of 174 in GA (top 81%) — low school quality limits family demand, transient renter base, plan for 1-2y turnover; 65% free/reduced lunch — lower-income household profile, screen leases tightly.
- Zoned schools: Hunt Elementary School (math 11% / reading 11%, grade F, #1,071 of 1,228 statewide, top 88%, 640 students, 82% FRL); Fort Valley Middle School (math 11% / reading 19%, grade F, #397 of 470 statewide, top 85%, 481 students, 82% FRL); Peach County High School (math 3% / reading 22%, grade F, #334 of 424 statewide, top 79%, 1,107 students, 82% FRL) — zoned schools average 82% FRL vs 65% district-wide (17 pts higher); higher-poverty schools than district average — tighter screening recommended.
- Market conditions: 116 active listings in the ZIP; 13 comparable units currently listed for rent nearby; rentals at typical pace (median 22d on market — plan ~3-4 weeks tenant-placement turnaround); 149 units permitted in Peach County in 2024 (0 in 5+ unit buildings).
Forward outlook
- Local home prices are declining (-3.0%/yr); year-one equity from $726 of loan paydown is wiped out by about $3k of value loss. Plan a longer hold.
- Peach County population projected at -18% by 2050 — secular population decline; favor cash flow + early exit over multi-decade hold.
Negotiation context
- It's been on market 35 days — a 3% lower offer ($102k) is reasonable based on typical stale-listing flexibility.
Risks & watch-outs
- Climate carrying-cost: severe wind risk, 80% chance of damaging wind over 30y; extreme-heat days projected 7→18/yr by 2055 (HVAC capex compounding) — expect insurance premiums to compound above CPI over the hold.
Questions for the listing agent
- It's been on market 35 days. Have you received any prior offers? Is the seller open to a 7% concession, seller financing, or rate buy-down credit?
- Is there a deadline driving the sale (1031 exchange, divorce, estate, relocation)? That informs how much negotiation room exists.
- Schools are F-rated, which usually means shorter tenancies and higher turnover. Who's the typical renter profile here, and what's been the actual vacancy rate?
- Crime grade is D in this area — have there been break-ins, vandalism, or insurance claims at this property in the last 3 years? What carrier currently insures it and at what premium?
- The area grade is low — what's the realistic commute time and amenity access for the typical tenant pool here? Any planned neighborhood developments (good or bad) we should know about?
- What's the average days-on-market for RENTAL listings here right now (not sales)? A rising rental-DOM trend means longer vacancies and softer asking-rent achievability than the comps imply.
- What's the recent tenant-quality profile in this submarket — average credit score on applications, eviction rate, late-payment / NSF rate, and stable-employment percentage? A property-management company in the area should have these aggregated.
- How much new for-sale + rental construction is in the pipeline within 1–3 miles? Heavy new supply typically softens prices + rents 12–24 months out; constrained supply supports both.
Investment metrics
- 1% rule
- 0.93% ✗
- Cap rate
- 7.40%
- Cash-on-cash
- 3.96%
- DSCR
- 1.18
- GRM
- 9.0
CMA / ARV
- ARV (median comp)
- $86,152
- List price
- $105,000
- Delta
- 21.88%
- Verdict
- OVERPRICED
- Comps
- 8 within 1.0 mi
Show comp detail 1 sale within ~0.75 mi
| Address | Dist | Beds/Ba | Sqft | Sold | Price | $/sf | Match |
|---|---|---|---|---|---|---|---|
| 421 Vienna Cir | 0.03mi | 3/1.0 (+1) | 960 (+13%) | 2mo | $131,900 | $137 | 69 |
Match score weights: distance 35% · size 25% · config 20% · recency 20%. Top-matched comps best support the ARV.
Projected returns pro-forma
-3.0% appreciation · 3.0% rent growth · sell at horizon
- IRR
- -10.1%
- Equity multiple
- 0.63×
- Total profit
- $-10,860
- Equity at exit
- $15,656
- IRR
- -0.8%
- Equity multiple
- 0.95×
- Total profit
- $-1,577
- Equity at exit
- $9,078
Cash invested: $29,400 (down + closing). Projections, not guarantees.
Landlord ↔ Tenant lean methodology
- Overall (STATE)
- 90 Strongly Landlord-Friendly
- State Georgia
- 90 Strongly Landlord-Friendly · R+3
- County
- — inherits STATE
- City
- — inherits STATE
ZIP-level market 31030
- Home prices YoY
- -14.7%
- Active inventory
- 116
- Price-to-rent
- 9.0×
Monthly cashflow live
- Estimated rent
- $976 high interval (Pro) →
- Mortgage (P&I)
- −$551
- Tax from tax record
- −$80 /mo · $962/yr
- Insurance
- −$44
- HOA
- −$0
- Vacancy / Maint / Mgmt
- −$205
- Net cashflow
- $97
Break-even live
Sensitivity live
| Price | -10% $156 | -5% $127 | +0% $97 | +5% $67 | +10% $37 |
|---|---|---|---|---|---|
| Rent | -10% $20 | -5% $58 | +0% $97 | +5% $135 | +10% $174 |
| Rate | -1.0pp $150 | -0.5pp $124 | base $97 | +0.5pp $70 | +1.0pp $42 |
UW: 25.0% down · 7.5% · 30yr · 1.5% tax · 5.0% vac · 8.0% maint · 8.0% mgmt
Financing live
Cash to close
- Down payment
- $26,250
- Closing costs
- $3,150
- Reserves months
- —
- Total cash needed
- —
Loan-product check · same deal, 3 products live
Conventional
25% down · 7.5% · 30yr
- Down + closing
- —
- Monthly P&I
- —
- Monthly cashflow
- —
- DSCR
- —
- Eligible?
- —
Personal DTI + credit; lowest rate.
DSCR
20% down · 8.5% · 30yr
- Down + closing
- —
- Monthly P&I
- —
- Monthly cashflow
- —
- DSCR
- —
- Eligible?
- —
No personal income docs; deal must DSCR.
Hard money
10% down · 12.0% · 12mo
- Down + closing
- —
- Monthly P&I
- —
- Monthly cashflow
- —
- DSCR
- —
- Eligible?
- —
Short-term bridge; refi at stabilization.
Rent comps 13 comps
| Address | Beds | Baths | Sqft | Rent | $/sqft | DOM | Units | Dist |
|---|---|---|---|---|---|---|---|---|
| 529 Railroad St Fort Valley, GA | 3.0 | 2.0 | 1100 | $1,095 | $1.00 | 44d | 1 | 0.86mi |
| 529 Railroad St Unit 4B Fort Valley, GA | 3.0 | 2.0 | 1100 | $1,095 | $1.00 | 21d | 1 | 0.86mi |
| 413 Anderson Ave Unit D3 Fort Valley, GA | 3.0 | 2.0 | 950 | $900 | $0.95 | 13d | 1 | 1.01mi |
| 417 Anderson Ave Fort Valley, GA | 3.0 | 2.0 | 950 | $925 | $0.97 | 13d | 1 | 1.02mi |
| 318 Persons St Apt B Fort Valley, GA | 1.0 | 1.0 | 975 | $997 | $1.02 | 44d | 1 | 1.06mi |
| 401 Carver Dr Fort Valley, GA | 2.0 | 2.0 | 1000 | $1,450 | $1.45 | 13d | 1 | 1.24mi |
| 615 Elberta St Fort Valley, GA | 2.0 | 1.0 | 650 | $950 | $1.46 | 44d | 1 | 1.30mi |
| 103 Ronald Pride Blvd Fort Valley, GA | 3.0 | 2.0 | 960 | $1,300 | $1.35 | 21d | 1 | 1.34mi |
| 218 Hunt St Fort Valley, GA | 1.0 | 1.0 | 800 | $850 | $1.06 | 44d | 1 | 1.35mi |
| 218 Hunt St Fort Valley, GA | 1.0 | 1.0 | 800 | $850 | $1.06 | 21d | 1 | 1.35mi |
| 212 Rayfield Wright St Fort Valley, GA | 1.0 | 1.0 | 550 | $430 | $0.78 | 44d | 1 | 1.36mi |
| 714 Green St Fort Valley, GA | 1.0–3.0 | 1.0–2.0 | 975 | $949 | $0.97 | 13d | 1 | 1.36mi |
| 714 Green St Fort Valley, GA | 1.0 | 1.0 | 750 | $699 | $0.93 | 21d | 1 | 1.36mi |
Listing history 18 events
-
2026-06-19days on market $105,000 Active 35 DOM
-
2026-06-18days on market $105,000 Active 34 DOM
-
2026-06-17days on market $105,000 Active 33 DOM
-
2026-06-16days on market $105,000 Active 32 DOM
-
2026-06-15days on market $105,000 Active 31 DOM
-
2026-06-14days on market $105,000 Active 29 DOM
-
2026-06-13days on market $105,000 Active 28 DOM
-
2026-06-10days on market $105,000 Active 26 DOM
-
2026-06-09days on market $105,000 Active 25 DOM
-
2026-06-08days on market $105,000 Active 24 DOM
-
2026-06-07days on market $105,000 Active 23 DOM
-
2026-06-05days on market $105,000 Active 20 DOM
-
2026-06-03days on market $105,000 Active 19 DOM
-
2026-06-02days on market $105,000 Active 18 DOM
-
2026-06-01days on market $105,000 Active 17 DOM
-
2026-05-31days on market $105,000 Active 16 DOM
-
2026-05-30days on market $105,000 Active 15 DOM
-
2026-05-15$105,000 Active 387-char remark
ⓘ Source: listings_history table (triggers on properties + properties_extension) + one-shot
backfill from property_details.listing_events for pre-trigger history.
Tax reassessment forecast GA · Resets to sale price
- Current annual tax
- $962 · $80/mo
- Projected year-2 tax
- $966 · $80/mo
- Expected delta
- +$4/yr ($0/mo · 0.4%)
ⓘ Screening estimate from a state-policy table — verify with the county assessor before closing.
Climate risk First Street
- Flood 1/10 Low FEMA zone X (unshaded) · 0% chance over 30 yrs
- Wildfire 4/10 Moderate
- Heat 6/10 Major 7 d/yr ≥107°F today · 18 d/yr by 30 yrs out
- Wind 8/10 Severe 80% chance of damaging wind over 30 yrs
- Air quality 3/10 Moderate 2 unhealthy d/yr today · 2 by 30 yrs out
Nearby sold comps map
Loading sold comps map…
Walkable amenities ~0.75 mi
Loading nearby amenities…
Taxation est. · year 1
- Rental income
- $11,718
- − Mortgage interest
- −$5,882
- − Property taxes
- −$962
- − Insurance
- −$525
- − Repairs & maintenance
- −$937
- − Management
- −$937
- − Depreciation
- −$3,055
- Taxable loss
- −$580
- Est. tax savings @ 24.0%
- +$139
- After-tax cash flow
- $1,302/yr
For passive investors: Depreciation is non-cash, so a rental often shows a tax loss while cash-flowing — sheltering income. Rental losses are passive: they offset passive income freely, and up to $25,000/yr can offset ordinary (W-2) income if you actively participate and your MAGI is under $100k (phasing out to $0 by $150k); unused losses carry forward. On sale, claimed depreciation is recaptured at up to 25%, and gains may owe capital-gains tax (a 1031 exchange can defer both). Figures are a year-1 estimate at your 24.0% rate — not tax advice; consult a CPA.
Schools (NCES district)
- District
- Peach County
- NCES district ID
- 1304050
- Math proficiency
- 17% ▼ -15.00%
- Reading proficiency
- 25% ▼ -5.00%
- Median HH income
- $41,348
- Composite
- 17.89/100
- National rank
- #9000
- State rank
- #141 of 174 in GA
Livability — Fort Valley
- Score
- 65/100
- State rank
- #220
- US rank
- #12957
Category grades
Schools grade is shown separately in the Schools card above.
Census & demographics
- Census place
- Fort Valley, GA
- City population
- 17,987
- Population (ZIP)
- 17,987
Population outlook (Peach County) Hauer SSP2
- Today (2025)
- 26,481 people
- By 2030
- 25,723 · -2.9%
- By 2040
- 23,812 · -10.1%
- By 2050
- 21,724 · -18.0%
- By 2075
- 17,513 · -33.9%
- By 2100
- 14,235 · -46.2%
Race, ethnicity, and origin ACS 2023
- Neighborhood character
- Diverse neighborhood (Simpson 0.62)
- Race & ethnicity
- Black 49% White 35% Hispanic / Latino 12% Two or more races 5% Native American 1%
- Hispanic origin (detail)
- Mexican 9% Cuban 2%
- Common ancestry
- Romanian 1% Italian 1% Serbian 1%
- Foreign-born
- 7% · Canada
- Languages at home
- 90% English-only · Spanish 8%
Political lean MEDSL · Peach
- 2024 margin
- Lean R (+6.0) · D 46.8% · R 52.8%
- 2008→2024 swing
- -12.8pp toward R · 2008: 6.8pp · 2024: -6.0pp
- All cycles
- 2024: R+6.0 2020: R+4.7 2016: R+3.0 2012: D+7.5 2008: D+6.8
Not yet ingested
- Civics
- —
Market trends
- HPI YoY
- ▼ -34.82%
- Current HPI
- 202.0025
- Rent YoY
- —
- Metro
- —
- State GDP YoY
- ▲ 2.66%
- F500 in state
- 28
Industry mix (Fortune 500 HQ in GA)
| Industry | F500 HQs | Revenue |
|---|---|---|
| Paper / Packaging | 2 | $29B |
|
||
| Retail | 1 | $160B |
|
||
| Transportation / Logistics | 1 | $91B |
|
||
| Airlines | 1 | $62B |
|
||
| Consumer Goods | 1 | $47B |
|
||
| Utilities | 1 | $25B |
|
||
Price history
1 event — show timeline
- 2026-05-15 Listed $105,000 CGMLS
Property tax history
+1.5%/yrLatest (2025): $962 · -3.9% YoY. Source: county tax records.
Cash-flow waterfall
monthlySold comps — $/sqft
last 12 mo · ≤1 miLoading sold comps…