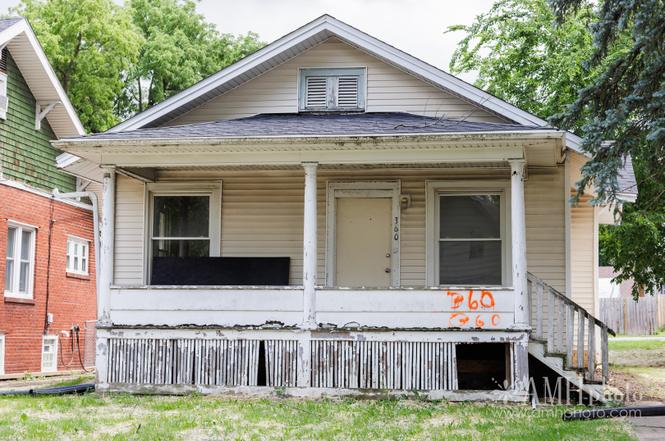
360 S Elm Ave · Kankakee, IL
Flood risk 1/10 · Minimal
- FEMA flood zone
- X (unshaded)
- Chance of flooding over 30 yrs
- 0.0%
- Est. flood insurance / yr
- $473 – $860
Fire risk 1/10 · Minimal
- Est. fire insurance / yr
- $804 – $1,492
Heat risk 3/10 · Minor
- Hot days now (above 105°F)
- 7 days/yr
- Hot days in 30 yrs
- 16 days/yr
Wind risk 2/10 · Minimal
- Chance of severe wind over 30 yrs
- 1.0%
Air-quality risk 2/10 · Minimal
- Unhealthy air days now
- 1 days/yr
- Unhealthy air days in 30 yrs
- 1 days/yr
Risk factors via First Street. Map © Google.
Why this score? — see what drove the B- grade
The composite is a weighted blend of 9 inputs, each scored 0–100. Each bar is that input's sub-score; the figure is the points it added to the 100-point composite (weight × sub-score).
- Cash flow +30.0/30.0
- 1% rule +10.0/10.0
- DSCR +10.0/10.0
- ARV discount +7.5/15.0
- Rent growth +3.6/5.0
- Livability +3.1/5.0
- Condition / age +2.5/5.0
- Schools +0.8/10.0
- Appreciation +0.0/10.0
$59,000
🖨 Deal sheet (PDF) 📄 Offer letter ✓ Due diligence
Listing remarks
Opportunity awaits with this affordable 2-bedroom, 1-bath home offered through the Kankakee Regional Land Bank! Major improvements have already been completed, including a new roof and new block foundation, providing a solid starting point for your renovation vision. Inside, you'll find a spacious kitchen and dining area, generous room sizes, and a full basement with ample ceiling height, offering the potential to create additional living space, bedrooms, a family room, bathroom, home office, or recreation area. Situated on a large lot, the expansive backyard provides plenty of room to add a garage, workshop, outdoor entertaining area, or simply enjoy the extra green space. Whether you're a
Key facts
- Spacious kitchen
- Large lot
- Full basement
Tags
Property features AI
Finance
- Other: Ownership is fee simple
- Financial info: No special service area (N)
- HOA & community: No master association fees required
Exterior
- Parking: No parking details provided
- Security: No security features provided
- Utilities: Public water; Public sewer; Electric service (standard); Natural gas available
- Home design: Detached single-family home; One-story entry
- Construction: Over 100 years old; Wood siding; Asphalt roof; Block foundation; Built before 1978
- Exterior features: Lot approximately 50 x 145; Less than 0.25 acre lot; Park nearby, sidewalks, street lights, paved streets
Interior
- Kitchen: Kitchen on main level (18 x 12) with vinyl flooring
- Bedrooms: Master bedroom on main level (12 x 10) with hardwood floors; Second bedroom on main level (12 x 10) with hardwood floors; Additional bedrooms listed (bedroom 3, bedroom 4)
- Flooring: Hardwood flooring in living room, dining room, master bedroom and other bedrooms; Vinyl flooring in kitchen
- Bathrooms: One full bathroom
- Heating & cooling: Natural gas heating
- Interior features: Five total rooms; Unfinished full basement; School bus service available
- Laundry & utility: Laundry room
Neighborhood map
What this means for you Summary
Snapshot
- This is a 2-bed/1.0-bath single-family listed at $59k.
Deal economics
- At list price, monthly cash flow is $476 ($6k/yr) — positive.
- The deal already cash-flows at list — no discount required.
- Meets the 1% rule at list price ($1k rent vs $59k).
- Cap rate 16.0% vs local median 5.7% in Kankakee — top-decile yield for the area; either an underpriced asset or a hidden risk that comps aren't pricing in. Stress-test before assuming the spread holds.
Location & tenants
- Location reads 62/100 on livability (#832 in IL) — a middle-class / working-renter tenant base. Strengths: commute A+, cost of living A+, housing A; Watch: crime F, amenities F, employment D-.
- Kankakee SD 111 (urban): math 6% / reading 13% proficiency, ranked #584 of 620 in IL (top 94%) — low school quality limits family demand, transient renter base, plan for 1-2y turnover; 78% free/reduced lunch — lower-income household profile, screen leases tightly.
- Zoned schools: King Middle Grade School (math 6% / reading 10%, grade F, #1,621 of 2,056 statewide, top 79%, 344 students, 0% FRL); Kankakee Junior High School (math 4% / reading 15%, grade F, #597 of 665 statewide, top 91%, 560 students, 0% FRL); Kankakee High School (math 6% / reading 10%, grade F, #587 of 693 statewide, top 85%, 1,513 students, 0% FRL) — zoned schools average 0% FRL vs 78% district-wide (78 pts lower); this property's tenant base skews higher-income than the district average.
- Market conditions: Rents rising fast (+4.4%/yr); 114 active listings in the ZIP; 21 comparable units currently listed for rent nearby; rentals lingering (median 46d on market — plan ~5-8 weeks vacancy on turnover, expect pricing pressure); 100% of comp listings sitting > 30 days — soft ceiling on asking rent; 145 units permitted in Kankakee County in 2024 (5 in 5+ unit buildings).
Forward outlook
- Local home prices are declining (-3.0%/yr); year-one equity from $408 of loan paydown is wiped out by about $2k of value loss. Plan a longer hold.
- Kankakee County population projected at -19% by 2050 — secular population decline; favor cash flow + early exit over multi-decade hold.
- At projected returns (-3.0% appreciation + 4.4% rent growth), your $17k cash investment doubles in ~4 years — after that, you're playing with house money.
Negotiation context
- Only 4 days on market — expect competitive offers; lowballing is unlikely to land.
- 2 sale attempts since 20y ago with the ask held roughly flat each time — persistent listings suggest the price (not the market) is what's stuck; bring a comps-based counter.
Risks & watch-outs
- Watch-outs: built in 1915 — expect roof / HVAC / electrical / plumbing capex.
Questions for the listing agent
- Built in 1915 — when were the roof, HVAC, electrical panel, plumbing, and water heater last replaced?
- Is there a deadline driving the sale (1031 exchange, divorce, estate, relocation)? That informs how much negotiation room exists.
- Schools are F-rated, which usually means shorter tenancies and higher turnover. Who's the typical renter profile here, and what's been the actual vacancy rate?
- Crime grade is F in this area — have there been break-ins, vandalism, or insurance claims at this property in the last 3 years? What carrier currently insures it and at what premium?
- What's the average days-on-market for RENTAL listings here right now (not sales)? A rising rental-DOM trend means longer vacancies and softer asking-rent achievability than the comps imply.
- What's the recent tenant-quality profile in this submarket — average credit score on applications, eviction rate, late-payment / NSF rate, and stable-employment percentage? A property-management company in the area should have these aggregated.
- How much new for-sale + rental construction is in the pipeline within 1–3 miles? Heavy new supply typically softens prices + rents 12–24 months out; constrained supply supports both.
Investment metrics
- 1% rule
- 1.94% ✓
- Cap rate
- 15.98%
- Cash-on-cash
- 34.60%
- DSCR
- 2.54
- GRM
- 4.3
CMA / ARV
No comps found within radius.
Show comp detail 12 sales within ~0.75 mi
| Address | Dist | Beds/Ba | Sqft | Sold | Price | $/sf | Match |
|---|---|---|---|---|---|---|---|
| 396 S Wildwood Ave | 0.21mi | 2/1.5 | 1,176 | 2mo | $125,000 | $106 | 74 |
| 540 S Osborn Ave | 0.29mi | 2/1.0 | 826 | 2mo | $65,000 | $79 | 72 |
| 657 S Poplar Ave | 0.28mi | 3/2.0 (+1) | 1,452 | 1mo | $45,000 | $31 | 64 |
| 1273 E Chestnut St | 0.39mi | 3/1.0 (+1) | 1,267 | 3mo | $155,000 | $122 | 62 |
| 780 S Elm Ave | 0.39mi | 3/1.5 (+1) | 1,008 | 2mo | $95,000 | $94 | 60 |
| 1436 E Eagle St | 0.37mi | 3/2.5 (+1) | 1,300 | 2mo | $250,000 | $192 | 58 |
| 689 Country Club Dr | 0.54mi | 3/1.0 (+1) | 1,152 | 3mo | $89,900 | $78 | 54 |
| 1809 E Eagle St | 0.56mi | 3/1.0 (+1) | 972 | 3mo | $153,100 | $158 | 54 |
| 1134 S Myrtle Ave | 0.73mi | 2/1.5 | 1,000 | 1mo | $175,000 | $175 | 51 |
| 790 S Prospect Ave | 0.73mi | 3/1.5 (+1) | 1,140 | 2mo | $174,900 | $153 | 45 |
| 1179 S Elm Ave | 0.75mi | 3/2.0 (+1) | 824 | 1mo | $235,000 | $285 | 43 |
| 995 Justine Dr | 0.71mi | 3/2.0 (+1) | 1,870 | 4mo | $165,000 | $88 | 42 |
Match score weights: distance 35% · size 25% · config 20% · recency 20%. Top-matched comps best support the ARV.
Projected returns pro-forma
-3.0% appreciation · 4.38% rent growth · sell at horizon
- IRR
- 31.7%
- Equity multiple
- 2.36×
- Total profit
- $22,417
- Equity at exit
- $8,797
- IRR
- 39.6%
- Equity multiple
- 4.96×
- Total profit
- $65,490
- Equity at exit
- $5,101
Cash invested: $16,520 (down + closing). Projections, not guarantees.
Landlord ↔ Tenant lean methodology
- Overall (STATE)
- 43 Moderately Tenant-Leaning
- State Illinois
- 43 Moderately Tenant-Leaning · D+7
- County
- — inherits STATE
- City
- — inherits STATE
ZIP-level market 60901
- Home prices YoY
- -32.5%
- Rents YoY
- 4.4%
- Active inventory
- 114
- Price-to-rent
- 4.3×
Monthly cashflow live
- Estimated rent
- $1,142 high interval (Pro) →
- Mortgage (P&I)
- −$309
- Tax from tax record
- −$92 /mo · $1,104/yr
- Insurance
- −$25
- HOA
- −$0
- Vacancy / Maint / Mgmt
- −$240
- Net cashflow
- $476
Break-even live
Sensitivity live
| Price | -10% $510 | -5% $493 | +0% $476 | +5% $460 | +10% $443 |
|---|---|---|---|---|---|
| Rent | -10% $386 | -5% $431 | +0% $476 | +5% $522 | +10% $567 |
| Rate | -1.0pp $506 | -0.5pp $491 | base $476 | +0.5pp $461 | +1.0pp $446 |
UW: 25.0% down · 7.5% · 30yr · 1.5% tax · 5.0% vac · 8.0% maint · 8.0% mgmt
Financing live
Cash to close
- Down payment
- $14,750
- Closing costs
- $1,770
- Reserves months
- —
- Total cash needed
- —
Loan-product check · same deal, 3 products live
Conventional
25% down · 7.5% · 30yr
- Down + closing
- —
- Monthly P&I
- —
- Monthly cashflow
- —
- DSCR
- —
- Eligible?
- —
Personal DTI + credit; lowest rate.
DSCR
20% down · 8.5% · 30yr
- Down + closing
- —
- Monthly P&I
- —
- Monthly cashflow
- —
- DSCR
- —
- Eligible?
- —
No personal income docs; deal must DSCR.
Hard money
10% down · 12.0% · 12mo
- Down + closing
- —
- Monthly P&I
- —
- Monthly cashflow
- —
- DSCR
- —
- Eligible?
- —
Short-term bridge; refi at stabilization.
Rent comps 21 comps
| Address | Beds | Baths | Sqft | Rent | $/sqft | DOM | Units | Dist |
|---|---|---|---|---|---|---|---|---|
| 519 S Osborn Ave Kankakee, IL | 2.0 | 1.0 | — | $1,400 | — | 45d | 1 | 0.29mi |
| 464 S Harrison Ave Unit 1 Kankakee, IL | 2.0 | 1.0 | — | $1,075 | — | 45d | 1 | 0.49mi |
| 294 N Greenwood Ave Unit 1 Kankakee, IL | 3.0 | 1.0 | — | $1,200 | — | 45d | 1 | 0.49mi |
| 450 S Dearborn Ave Apt 4 Kankakee, IL | 2.0 | 1.0 | — | $1,200 | — | 45d | 1 | 0.63mi |
| 1735 E Duane Blvd Unit 4 Kankakee, IL | 2.0 | 1.0 | 800 | $1,050 | $1.31 | 45d | 1 | 0.71mi |
| 592 N Dearborn Ave Unit 2 Kankakee, IL | 2.0 | 1.0 | — | $900 | — | 45d | 1 | 0.89mi |
| 200 N Crestlane Dr Unit 101 Kankakee, IL | 1.0 | 1.0 | — | $960 | — | 45d | 1 | 0.98mi |
| 200 N Crestlane Dr Unit 103 Kankakee, IL | 3.0 | 1.0 | — | $1,338 | — | 45d | 1 | 0.98mi |
| 200 N Crestlane Dr Kankakee, IL | 2.0 | 1.0 | — | $1,132 | — | 45d | 1 | 1.00mi |
| 250 N Entrance Ave Unit 5A Kankakee, IL | 1.0 | 1.0 | 500 | $825 | $1.65 | 45d | 1 | 1.03mi |
| 243 S 5th Ave Unit 247 Kankakee, IL | 2.0 | 1.0 | 1000 | $1,150 | $1.15 | 45d | 1 | 1.14mi |
| 319 S 5th Ave Unit 1 Kankakee, IL | 2.0 | 1.0 | — | $1,311 | — | 45d | 1 | 1.14mi |
| 319 S 5th Ave Unit 4 Kankakee, IL | 1.0 | 1.0 | 750 | $1,115 | $1.49 | 45d | 1 | 1.14mi |
| 1017 N Schuyler Ave Unit 3 Kankakee, IL | 2.0 | 1.0 | 800 | $1,375 | $1.72 | 45d | 1 | 1.21mi |
| 2755 Cooper Dr Unit 2 Kankakee, IL | 1.0 | 1.0 | — | $800 | — | 45d | 1 | 1.26mi |
| 2755 Cooper Dr Unit 12 Kankakee, IL | 2.0 | 1.0 | — | $875 | — | 45d | 1 | 1.26mi |
| 210 Tedmark Ct Apt 5 Kankakee, IL | 1.0 | 1.0 | — | $800 | — | 45d | 1 | 1.29mi |
| 280 Tedmark Ct Apt 1 Kankakee, IL | 2.0 | 1.0 | — | $975 | — | 45d | 1 | 1.29mi |
| 220 Tedmark Ct Unit 4 Kankakee, IL | 3.0 | 1.5 | 500 | $1,200 | $2.40 | 45d | 1 | 1.29mi |
| 2779 Cooper Dr Apt 1 Kankakee, IL | 2.0 | 1.0 | — | $900 | — | 45d | 1 | 1.30mi |
| 2779 Cooper Dr Unit 3 Kankakee, IL | 2.0 | 1.0 | — | $875 | — | 45d | 1 | 1.30mi |
Listing history 5 events
-
2026-06-19days on market $59,000 Active 4 DOM
-
2026-06-18days on market $59,000 Active 3 DOM
-
2026-06-17days on market $59,000 Active 2 DOM
-
2026-06-15remarks 699-char remark
-
2026-06-15$59,000 Active 1 DOM
ⓘ Source: listings_history table (triggers on properties + properties_extension) + one-shot
backfill from property_details.listing_events for pre-trigger history.
Tax reassessment forecast IL · Partial reset (capped growth)
- Current annual tax
- $1,104 · $92/mo
- Projected year-2 tax
- $1,222 · $102/mo
- Expected delta
- +$118/yr (+$10/mo · 10.7%)
ⓘ Screening estimate from a state-policy table — verify with the county assessor before closing.
Climate risk First Street
- Flood 1/10 Low FEMA zone X (unshaded) · 0% chance over 30 yrs
- Wildfire 1/10 Low
- Heat 3/10 Moderate 7 d/yr ≥105°F today · 16 d/yr by 30 yrs out
- Wind 2/10 Low 100% chance of damaging wind over 30 yrs
- Air quality 2/10 Low 1 unhealthy d/yr today · 1 by 30 yrs out
Nearby sold comps map
Loading sold comps map…
Walkable amenities ~0.75 mi
Loading nearby amenities…
Taxation est. · year 1
- Rental income
- $13,707
- − Mortgage interest
- −$3,305
- − Property taxes
- −$1,104
- − Insurance
- −$295
- − Repairs & maintenance
- −$1,097
- − Management
- −$1,097
- − Depreciation
- −$1,716
- Taxable income
- $5,093
- Est. tax owed @ 24.0%
- −$1,222
- After-tax cash flow
- $4,494/yr
For passive investors: Depreciation is non-cash, so a rental often shows a tax loss while cash-flowing — sheltering income. Rental losses are passive: they offset passive income freely, and up to $25,000/yr can offset ordinary (W-2) income if you actively participate and your MAGI is under $100k (phasing out to $0 by $150k); unused losses carry forward. On sale, claimed depreciation is recaptured at up to 25%, and gains may owe capital-gains tax (a 1031 exchange can defer both). Figures are a year-1 estimate at your 24.0% rate — not tax advice; consult a CPA.
Schools (NCES district)
- District
- Kankakee SD 111
- NCES district ID
- 1720760
- Math proficiency
- 6% ▼ -7.00%
- Reading proficiency
- 13% ▼ -6.00%
- Median HH income
- $37,968
- Composite
- 8.03/100
- National rank
- #9921
- State rank
- #584 of 620 in IL
Livability — Kankakee
- Score
- 62/100
- State rank
- #832
- US rank
- #16432
Category grades
Schools grade is shown separately in the Schools card above.
Census & demographics
- Census place
- Kankakee, IL
- County
- Kankakee County · 61,801 people
- City population
- 33,128
- Metro
- Kankakee, IL
- Population (ZIP)
- 33,128
- Household income
- $58,309
- Rent vs Own
- Severe rent burden
- 1317.0
Population outlook (Kankakee County) Hauer SSP2
- Today (2025)
- 105,479 people
- By 2030
- 101,792 · -3.5%
- By 2040
- 93,479 · -11.4%
- By 2050
- 85,061 · -19.4%
- By 2075
- 67,314 · -36.2%
- By 2100
- 52,439 · -50.3%
Race, ethnicity, and origin ACS 2023
- Neighborhood character
- Diverse neighborhood (Simpson 0.65)
- Race & ethnicity
- White 47% Black 30% Hispanic / Latino 19% Two or more races 7%
- Hispanic origin (detail)
- Mexican 16%
- Common ancestry
- Lithuanian 4% Romanian 4% Slovak 1%
- Foreign-born
- 10% · Canada
- Languages at home
- 82% English-only · Spanish 16%
Political lean MEDSL · Kankakee
- 2024 margin
- Strong R (+20.8) · D 38.7% · R 59.5% · Other 1.8%
- 2008→2024 swing
- -25.4pp toward R · 2008: 4.6pp · 2024: -20.8pp
- All cycles
- 2024: R+20.8 2020: R+16.5 2016: R+13.3 2012: R+3.4 2008: D+4.6
Not yet ingested
- Civics
- —
Market trends
- HPI YoY
- ▼ -92.12%
- Current HPI
- 190.8755
- Rent YoY
- ▲ 4.38%
- Metro
- Kankakee, IL
- State GDP YoY
- ▲ 1.59%
- F500 in state
- 60
Industry mix (Fortune 500 HQ in IL)
| Industry | F500 HQs | Revenue |
|---|---|---|
| Insurance | 4 | $201B |
|
||
| Consumer Goods | 4 | $87B |
|
||
| Industrial Machinery | 3 | $64B |
|
||
| Healthcare | 2 | $55B |
|
||
| Retail / Pharmacy | 1 | $148B |
|
||
| Agriculture / Food | 1 | $86B |
|
||
Price history
3 events — show timeline
- 2026-06-15 Listed $59,000 MRED as Distributed by MLS Grid
- 2007-08-10 Listing Removed — MRED as Distributed by MLS Grid
- 2006-09-21 Listed — MRED as Distributed by MLS Grid
Property tax history
-15.3%/yrLatest (2015): $1,104 · -28.3% YoY. Source: county tax records.
Cash-flow waterfall
monthlySold comps — $/sqft
last 12 mo · ≤1 miLoading sold comps…