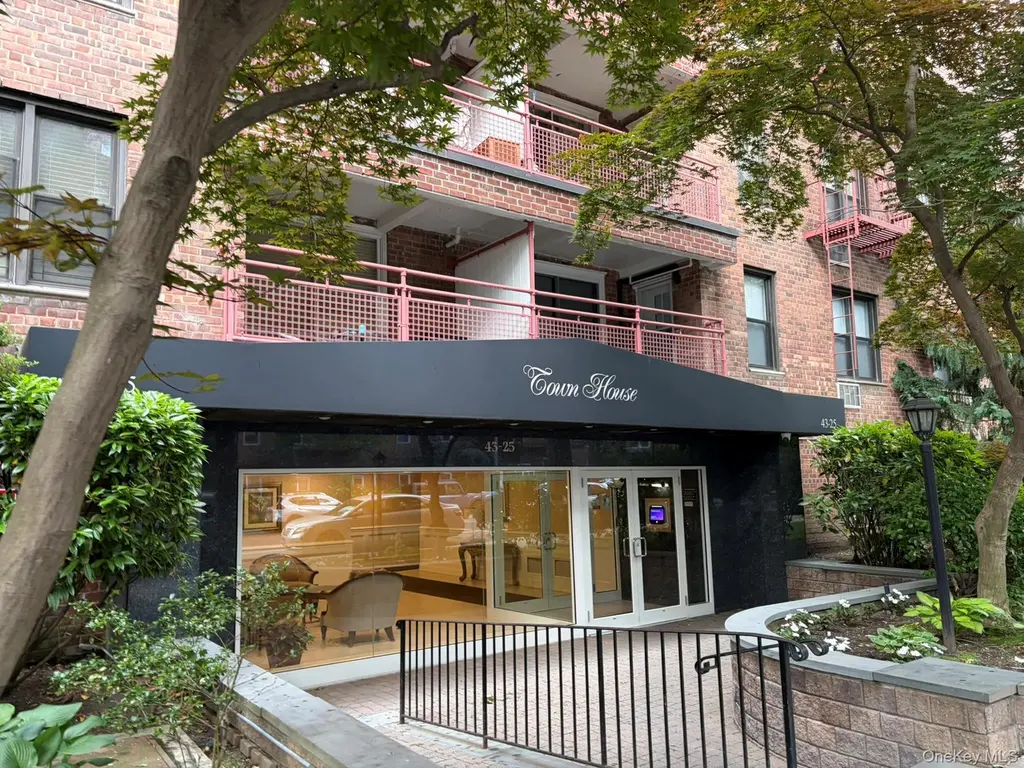
43-25 Douglaston Pkwy Unit 2B · New York, NY
Flood risk 1/10 · Minimal
- FEMA flood zone
- X (unshaded)
- Chance of flooding over 30 yrs
- 0.0%
- Est. flood insurance / yr
- $507 – $1,088
Fire risk 1/10 · Minimal
- Est. fire insurance / yr
- $691 – $1,283
Heat risk 6/10 · Moderate
- Hot days now (above 97°F)
- 7 days/yr
- Hot days in 30 yrs
- 15 days/yr
Wind risk 6/10 · Moderate
- Chance of severe wind over 30 yrs
- 27.0%
Air-quality risk 4/10 · Minor
- Unhealthy air days now
- 6 days/yr
- Unhealthy air days in 30 yrs
- 7 days/yr
Risk factors via First Street. Map © Google.
Why this score? — see what drove the F grade
The composite is a weighted blend of 9 inputs, each scored 0–100. Each bar is that input's sub-score; the figure is the points it added to the 100-point composite (weight × sub-score).
- ARV discount +7.5/15.0
- Cash flow +6.6/30.0
- 1% rule +5.3/10.0
- Schools +5.0/10.0
- Livability +3.8/5.0
- Rent growth +2.5/5.0
- Condition / age +2.5/5.0
- DSCR +0.9/10.0
- Appreciation +0.0/10.0
$258,000
🖨 Deal sheet (PDF) 📄 Offer letter ✓ Due diligence
Listing remarks MLS
Bright And Sunny Jr. 4, Renovated Kitchen And New Appliance. Convenient To Lirr And Northern Blvd.
Key facts
- Dining area
- Home office space
- Garage
Tags
Property features AI
Finance
- HOA & community: Has association
Exterior
- Parking: Assigned parking; Garage parking available; On-street parking; Waitlist for parking
- Utilities: Public sewer; Electricity connected; Water connected; Public trash collection
- Home design: Stock cooperative; One level unit within a 6-story building; Entry level: 2
- Construction: Brick construction
- Exterior features: Brick construction; Not waterfront; Near public transit, schools, and shops; Clubhouse in the community
Interior
- Kitchen: Dishwasher; Oven; Refrigerator
- Bedrooms: 4 total rooms (includes bedrooms and living spaces)
- Flooring: Hardwood floors
- Bathrooms: 1 full bathroom
- Heating & cooling: Baseboard heating; Steam heating; Wall/window air conditioning units
- Interior features: Elevator; Entrance foyer; Second-floor location; No basement; Dining area
- Laundry & utility: Utilities connected: electricity, water, sewer, trash collection
Neighborhood map
What this means for you Summary
Snapshot
- This is a 1-bed/1.0-bath condo listed at $258k.
Deal economics
- At list price, monthly cash flow is $-423 ($-5k/yr) — negative.
- The deal already cash-flows at list — no discount required.
- Meets the 1% rule at list price ($3k rent vs $258k).
- Cap rate 4.3% vs local median 2.6% in New York — top-decile yield for the area; either an underpriced asset or a hidden risk that comps aren't pricing in. Stress-test before assuming the spread holds.
Location & tenants
- Location reads 75/100 on livability (#268 in NY, #4,188 nationally) — a middle-class / working-renter tenant base. Strengths: amenities A+, commute A+, health & safety A; Watch: crime F, cost of living F.
- Zoned schools: Elm Tree Elementary School (math 27% / reading 52%, grade F, #1,444 of 2,108 statewide, top 71%, 806 students, 94% FRL); Is 227 Louis Armstrong (math 52% / reading 69%, grade B+, #153 of 729 statewide, top 21%, 1,528 students, 68% FRL); Midwood High School (math 94% / reading 96%, grade A+, #83 of 1,100 statewide, top 8%, 4,062 students, 73% FRL).
- Market conditions: 48 active listings in the ZIP; 12 comparable units currently listed for rent nearby; rentals at typical pace (median 21d on market — plan ~3-4 weeks tenant-placement turnaround); high-income renter base; 5,302 units permitted in Queens County in 2024 (4,918 in 5+ unit buildings).
Forward outlook
- Local home prices are declining (-3.0%/yr); year-one equity from $2k of loan paydown is wiped out by about $8k of value loss. Plan a longer hold.
- Queens County population projected at +16% by 2050 — long-run rental-demand tailwind backs the buy-and-hold thesis.
Negotiation context
- Only 12 days on market — expect competitive offers; lowballing is unlikely to land.
- 5 sale attempts since 14y ago; this cycle's ask is 3% above the opening price — seller raised mid-cycle; expect resistance to lowballs.
- Current owner paid $192k; 34% above their basis — modest negotiation headroom, anchor on the comps not their cost.
Risks & watch-outs
- Watch-outs: HOA is 28% of rent.
- Climate carrying-cost: major wind risk, 27% chance of damaging wind over 30y; extreme-heat days projected 7→15/yr by 2055 (HVAC capex compounding) — expect insurance premiums to compound above CPI over the hold.
Questions for the listing agent
- What do current leases actually rent for vs. the listed asking? Can we see a recent rent roll and the last 12 months of T-12 income?
- Built in 1961 — when were the roof, HVAC, electrical panel, plumbing, and water heater last replaced?
- What does the HOA fee cover, when was the last increase, and are there any pending special assessments or reserve-fund shortfalls?
- Any open or pending special assessments — roof, HVAC, plumbing, elevator, façade? What's the per-unit balance and payoff schedule, and is the seller paying it off at close or rolling it to the buyer?
- Is there a deadline driving the sale (1031 exchange, divorce, estate, relocation)? That informs how much negotiation room exists.
- Schools are B-rated — typically a magnet for longer-tenancy family renters. What's the average tenant stay here, and is there a school-zone premium baked into asking?
- Crime grade is F in this area — have there been break-ins, vandalism, or insurance claims at this property in the last 3 years? What carrier currently insures it and at what premium?
- The area grade is low — what's the realistic commute time and amenity access for the typical tenant pool here? Any planned neighborhood developments (good or bad) we should know about?
- What's the average days-on-market for RENTAL listings here right now (not sales)? A rising rental-DOM trend means longer vacancies and softer asking-rent achievability than the comps imply.
- What's the recent tenant-quality profile in this submarket — average credit score on applications, eviction rate, late-payment / NSF rate, and stable-employment percentage? A property-management company in the area should have these aggregated.
- How much new apartment / multifamily construction is in the pipeline within 1–3 miles? Heavy new supply (>2% of stock underway) typically softens rents 12–24 months out; light construction supports rent growth.
Investment metrics
- 1% rule
- 1.03% ✓
- Cap rate
- 4.33%
- Cash-on-cash
- -7.02%
- DSCR
- 0.69
- GRM
- 8.1
CMA / ARV
No comps found within radius.
Projected returns pro-forma
-3.0% appreciation · 3.0% rent growth · sell at horizon
- IRR
- -28.2%
- Equity multiple
- 0.06×
- Total profit
- $-68,229
- Equity at exit
- $38,469
- IRR
- -26.2%
- Equity multiple
- -0.27×
- Total profit
- $-92,055
- Equity at exit
- $22,307
Cash invested: $72,240 (down + closing). Projections, not guarantees.
Landlord ↔ Tenant lean methodology
- Overall (CITY)
- 0 Strongly Tenant-Friendly
- State New York
- 15 Strongly Tenant-Friendly · D+10
- County
- — inherits STATE
- City New York
- 0 Strongly Tenant-Friendly · D+34
ZIP-level market 11363
- Home prices YoY
- -23.3%
- Active inventory
- 48
- Price-to-rent
- 8.1×
Monthly cashflow live
- Estimated rent
- $2,664 high interval (Pro) →
- Mortgage (P&I)
- −$1,353
- Tax est. 1.5%
- −$322 /mo · $3,870/yr
- Insurance
- −$108
- HOA est. from 2 same-building comps
- −$744
- Vacancy / Maint / Mgmt
- −$559
- Net cashflow
- $-423
Break-even live
Sensitivity live
| Price | -10% $-244 | -5% $-334 | +0% $-423 | +5% $-512 | +10% $-601 |
|---|---|---|---|---|---|
| Rent | -10% $-633 | -5% $-528 | +0% $-423 | +5% $-317 | +10% $-212 |
| Rate | -1.0pp $-293 | -0.5pp $-357 | base $-423 | +0.5pp $-490 | +1.0pp $-558 |
UW: 25.0% down · 7.5% · 30yr · 1.5% tax · 5.0% vac · 8.0% maint · 8.0% mgmt
Financing live
Cash to close
- Down payment
- $64,500
- Closing costs
- $7,740
- Reserves months
- —
- Total cash needed
- —
Loan-product check · same deal, 3 products live
Conventional
25% down · 7.5% · 30yr
- Down + closing
- —
- Monthly P&I
- —
- Monthly cashflow
- —
- DSCR
- —
- Eligible?
- —
Personal DTI + credit; lowest rate.
DSCR
20% down · 8.5% · 30yr
- Down + closing
- —
- Monthly P&I
- —
- Monthly cashflow
- —
- DSCR
- —
- Eligible?
- —
No personal income docs; deal must DSCR.
Hard money
10% down · 12.0% · 12mo
- Down + closing
- —
- Monthly P&I
- —
- Monthly cashflow
- —
- DSCR
- —
- Eligible?
- —
Short-term bridge; refi at stabilization.
Rent comps 12 comps
| Address | Beds | Baths | Sqft | Rent | $/sqft | DOM | Units | Dist |
|---|---|---|---|---|---|---|---|---|
| 4420 Douglaston Pkwy Unit 5A Little Neck, NY | 2.0 | 1.0 | 900 | $3,200 | $3.56 | 0d | 1 | 0.08mi |
| 4230 Douglaston Pkwy Little Neck, NY | 1.0 | 1.0 | 700 | $1,800 | $2.57 | 20d | 1 | 0.09mi |
| 4212 Marathon Pkwy Little Neck, NY | 1.0 | 1.0 | 550 | $2,375 | $4.32 | 26d | 1 | 0.44mi |
| 240-53 68th Ave Unit 1st Floor Douglaston, NY | 2.0 | 1.0 | 900 | $2,500 | $2.78 | 26d | 1 | 1.18mi |
| 40-11 214th Pl Unit 2R Bayside, NY | 1.0 | 1.0 | 650 | $2,800 | $4.31 | 6d | 1 | 1.24mi |
| 214-16 40th Ave Unit 3rd Floor Flushing, NY | 2.0 | 1.0 | 900 | $2,800 | $3.11 | 26d | 1 | 1.26mi |
| 232-15 67th Ave Unit 1FL Flushing, NY | 2.0 | 2.0 | 900 | $2,900 | $3.22 | 5d | 1 | 1.29mi |
| 4 Chelsea Pl Apt 3F Great Neck, NY | 2.0 | 2.0 | 900 | $4,600 | $5.11 | 26d | 1 | 1.37mi |
| 141 Great Neck Rd Unit 2G Great Neck, NY | 2.0 | 1.5 | 1000 | $4,250 | $4.25 | 4d | 1 | 1.45mi |
| 50 Knightsbridge Rd Unit 2B Great Neck Plaza, NY | 2.0 | 1.0 | 850 | $3,450 | $4.06 | 6d | 1 | 1.48mi |
| 60 Knightsbridge Rd Unit 3F Great Neck Plaza, NY | 2.0 | 1.0 | 850 | $3,550 | $4.18 | 6d | 1 | 1.48mi |
| 70 Knightsbridge Rd Unit 3F Great Neck Plaza, NY | 2.0 | 1.0 | 850 | $3,450 | $4.06 | 45d | 1 | 1.49mi |
HOA detail condo
- Monthly dues
- $0 · $0/yr
- Assessments
- None detected in remarks — confirm with the listing agent.
Listing history 8 events
-
2026-06-21days on market $258,000 Active 12 DOM
-
2026-06-18days on market $258,000 Active 9 DOM
-
2026-06-17days on market $258,000 Active 8 DOM
-
2026-06-16days on market $258,000 Active 7 DOM
-
2026-06-15days on market $258,000 Active 6 DOM
-
2026-06-13pricedays on market $258,000 Active 4 DOM
-
2026-06-10remarks 688-char remark
-
2026-06-10$249,900 Active 1 DOM
ⓘ Source: listings_history table (triggers on properties + properties_extension) + one-shot
backfill from property_details.listing_events for pre-trigger history.
Climate risk First Street
- Flood 1/10 Low FEMA zone X (unshaded) · 0% chance over 30 yrs
- Wildfire 1/10 Low
- Heat 6/10 Major 7 d/yr ≥97°F today · 15 d/yr by 30 yrs out
- Wind 6/10 Major 27% chance of damaging wind over 30 yrs
- Air quality 4/10 Moderate 6 unhealthy d/yr today · 7 by 30 yrs out
Nearby sold comps map
Loading sold comps map…
Walkable amenities ~0.75 mi
Loading nearby amenities…
Taxation est. · year 1
- Rental income
- $31,964
- − Mortgage interest
- −$14,452
- − Property taxes
- −$3,870
- − Insurance
- −$1,290
- − Repairs & maintenance
- −$2,557
- − Management
- −$2,557
- − HOA
- −$8,928
- − Depreciation
- −$7,505
- Taxable loss
- −$9,195
- Est. tax savings @ 24.0%
- +$2,207
- After-tax cash flow
- $-2,865/yr
For passive investors: Depreciation is non-cash, so a rental often shows a tax loss while cash-flowing — sheltering income. Rental losses are passive: they offset passive income freely, and up to $25,000/yr can offset ordinary (W-2) income if you actively participate and your MAGI is under $100k (phasing out to $0 by $150k); unused losses carry forward. On sale, claimed depreciation is recaptured at up to 25%, and gains may owe capital-gains tax (a 1031 exchange can defer both). Figures are a year-1 estimate at your 24.0% rate — not tax advice; consult a CPA.
Schools (NCES district)
No district data.
Livability — New York
- Score
- 75/100
- State rank
- #268
- US rank
- #4188
Category grades
Schools grade is shown separately in the Schools card above.
Census & demographics
- Census place
- New York, NY
- County
- Queens County · 1,914,869 people
- City population
- 7,731,280
- Metro
- New York-Newark-Jersey City, NY-NJ-PA
- Population (ZIP)
- 7,223
- Household income
- $125,015
- Rent vs Own
- Severe rent burden
- 262.0
Population outlook (Queens County) Hauer SSP2
- Today (2025)
- 2,546,320 people
- By 2030
- 2,643,059 · +3.8%
- By 2040
- 2,815,563 · +10.6%
- By 2050
- 2,944,423 · +15.6%
- By 2075
- 3,123,338 · +22.7%
- By 2100
- 3,098,688 · +21.7%
Race, ethnicity, and origin ACS 2023
- Neighborhood character
- Diverse neighborhood (Simpson 0.61)
- Race & ethnicity
- White 54% Asian 29% Hispanic / Latino 12% Two or more races 12% Native American 1%
- Hispanic origin (detail)
- Puerto Rican 1% Cuban 1% Dominican 2%
- Common ancestry
- Romanian 4% Italian 3% Scotch-Irish 2%
- Foreign-born
- 29% · China, Canada, South Korea
- Languages at home
- 56% English-only · Chinese 15% Spanish 10% Other Indo-European 8%
Political lean MEDSL · Queens
- 2024 margin
- Strong D (+24.6) · D 62.3% · R 37.7%
- 2008→2024 swing
- -26.2pp toward R · 2008: 50.8pp · 2024: 24.6pp
- All cycles
- 2024: D+24.6 2020: D+45.2 2016: D+53.4 2012: D+58.5 2008: D+50.8
Not yet ingested
- Civics
- —
Market trends
- HPI YoY
- ▼ -71.14%
- Current HPI
- 234.1655
- Rent YoY
- —
- Metro
- New York-Newark-Jersey City, NY-NJ-PA
- State GDP YoY
- ▲ 2.60%
- F500 in state
- 92
Industry mix (Fortune 500 HQ in NY)
| Industry | F500 HQs | Revenue |
|---|---|---|
| Financial Services | 10 | $950B |
|
||
| Consumer Goods | 9 | $162B |
|
||
| Insurance | 4 | $225B |
|
||
| Telecommunications | 2 | $144B |
|
||
| Pharmaceuticals | 2 | $112B |
|
||
| Media / Entertainment | 2 | $69B |
|
||
Price history
+15.2% since first listed10 events — show timeline
- 2026-06-09 Listed $249,900 OneKey® MLS as Distributed by MLS Grid
- 2013-09-24 Sold (MLS) $192,500 OneKey® MLS as Distributed by MLS Grid
- 2013-09-24 Sold (MLS) $192,500 MLSLI
- 2013-06-25 Pending — MLSLI
- 2013-05-16 Listed $212,000 MLSLI
- 2013-05-16 Listed $212,000 OneKey® MLS as Distributed by MLS Grid
- 2013-03-20 Listing Removed — OneKey® MLS as Distributed by MLS Grid
- 2012-11-27 Listed $217,000 OneKey® MLS as Distributed by MLS Grid
- 2012-10-31 Listing Removed — OneKey® MLS as Distributed by MLS Grid
- 2012-04-06 Listed $217,000 OneKey® MLS as Distributed by MLS Grid
Cash-flow waterfall
monthlySold comps — $/sqft
last 12 mo · ≤1 miLoading sold comps…