 Duplex
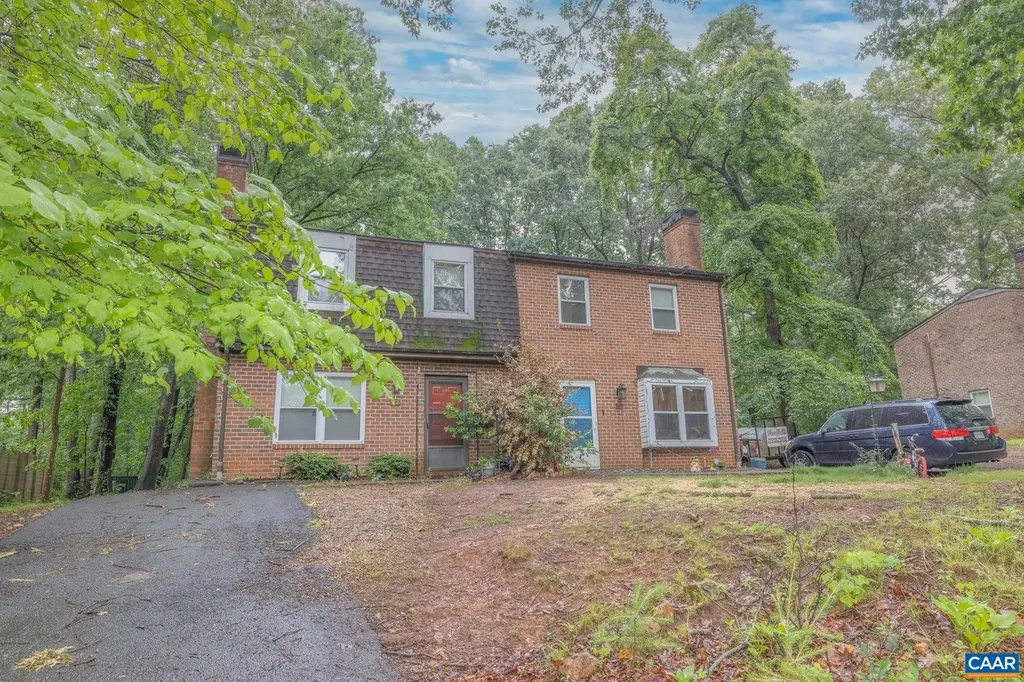
288 Lake Saponi Dr · Ruckersville, VA
Flood risk 1/10 · Minimal
- FEMA flood zone
- X (unshaded)
- Chance of flooding over 30 yrs
- 0.0%
- Est. flood insurance / yr
- $507 – $1,088
Fire risk 4/10 · Minor
- Est. fire insurance / yr
- $666 – $1,236
Heat risk 6/10 · Moderate
- Hot days now (above 103°F)
- 7 days/yr
- Hot days in 30 yrs
- 17 days/yr
Wind risk 2/10 · Minimal
- Chance of severe wind over 30 yrs
- 3.0%
Air-quality risk 1/10 · Minimal
- Unhealthy air days now
- 0 days/yr
- Unhealthy air days in 30 yrs
- 0 days/yr
Risk factors via First Street. Map © Google.
Why this score? — see what drove the C+ grade
The composite is a weighted blend of 9 inputs, each scored 0–100. Each bar is that input's sub-score; the figure is the points it added to the 100-point composite (weight × sub-score).
- Cash flow +26.8/30.0
- DSCR +9.2/10.0
- ARV discount +7.5/15.0
- 1% rule +7.2/10.0
- Schools +4.5/10.0
- Livability +3.3/5.0
- Rent growth +2.5/5.0
- Condition / age +2.2/5.0
- Appreciation +0.0/10.0
$400,000
🖨 Deal sheet 📄 Offer letter ✓ Due diligence
Multi-family units
County records classify this as Multi-Family (2-4 Unit). Listing-text estimate: 2 units. confirmed
Listing remarks
Great investment opportunity available! Buy this duplex and have your neighbor paying most of your mortgage! Two units: each with 3 bedrooms, 1.5 baths and 1,200 SF. The right unit has been updated with LVP flooring, kitchen cabinets, counters, appliances and water heater. The first floor includes the living room, dining room, kitchen, half bath, laundry and mud room area. Walk out to a level backyard. Upstairs you'll find three bedrooms, a full bath and hardwood floors. Septic was pumped in 2025. The left unit is in good condition but updates could definitely increase rental potential. Floor plan is the same in each unit just reversed. Both units have wood-burning fireplaces, attached shed
Key facts
- Level backyard
- Septic was pumped
- Attached sheds
Tags
Property features AI
Finance
- Other: Lot size approximately 0.45 acre
- Financial info: Property is a 2-unit duplex; Tenants pay electricity, water, sewer, trash collection, snow removal, and minor interior maintenance
Exterior
- Security: Surveillance system
- Utilities: Public water; Septic tank for sewer; Cable available
- Home design: Duplex (multi-family); Above- and below-grade area information from public records
- Construction: Slab foundation; Composition/shingle roof
- Exterior features: Storage structure on property; Public road frontage
Interior
- Kitchen: Dishwasher; Electric cooktop; Refrigerator
- Bedrooms: Two 3-bedroom units (each unit is a 3-bedroom)
- Flooring: Hardwood; Luxury vinyl plank; Parquet; Vinyl
- Bathrooms: Each unit has 2 bathrooms
- Heating & cooling: Heat pump for heating and cooling
- Interior features: Surveillance system
- Laundry & utility: Washer hookup; Dryer hookup
Neighborhood map
What this means for you Summary
Snapshot
- This is a 2 × 3.0-bed/1.5-bath units multifamily listed at $400k. Condition is rated fair.
Deal economics
- At list price, monthly cash flow is $1k ($13k/yr) — positive. Per door: $545/mo.
- The deal already cash-flows at list — no discount required.
- Meets the 1% rule at list price ($5k rent vs $400k).
- Cap rate 9.6% vs local median 4.7% in Ruckersville — top-decile yield for the area; either an underpriced asset or a hidden risk that comps aren't pricing in. Stress-test before assuming the spread holds.
Location & tenants
- Location reads 66/100 on livability (#318 in VA) — a middle-class / working-renter tenant base. Strengths: crime A+, employment A, housing A-; Watch: amenities F, commute F, health & safety F.
- Greene County Public School District (town): math 40% / reading 64% proficiency, ranked #88 of 131 in VA (top 67%) — acceptable for families but not a draw, mixed tenant base, ~2y average lease.
- Zoned schools: Ruckersville Elementary (math 54% / reading 62%, grade C+, #583 of 1,108 statewide, top 53%, 506 students, 68% FRL); William Monroe Middle (math 36% / reading 65%, grade C, #226 of 342 statewide, top 67%, 675 students, 67% FRL); William Monroe High (math 40% / reading 78%, grade C+, #256 of 319 statewide, top 81%, 957 students, 67% FRL) — zoned schools average 68% FRL vs 32% district-wide (36 pts higher); higher-poverty schools than district average — tighter screening recommended.
- Market conditions: 184 active listings in the ZIP; high-income renter base; 204 units permitted in Greene County in 2024 (34 in 5+ unit buildings).
- At $4,878/mo this rent would consume 50% of the median local household income ($118k/yr) (locally 42% of renters already pay >50% of income on rent) — very limited rent-growth headroom before tenants either downsize or default.
Forward outlook
- Local home prices are declining (-3.0%/yr); year-one equity from $3k of loan paydown is wiped out by about $12k of value loss. Plan a longer hold.
- Greene County population projected at +6% by 2050 — modest demand growth; plan on rents tracking national, not racing it.
- At projected returns (-3.0% appreciation + 3.0% rent growth), your $112k cash investment doubles in ~10 years — after that, you're playing with house money.
Negotiation context
- Only 7 days on market — expect competitive offers; lowballing is unlikely to land.
Risks & watch-outs
- Climate carrying-cost: extreme-heat days projected 7→17/yr by 2055 (HVAC capex compounding) — expect insurance premiums to compound above CPI over the hold.
Questions for the listing agent
- Can we see the unit-by-unit rent roll, current vacancy, and any below-market leases? What's the average tenancy length?
- What capital expenditures (roof, boiler, parking lot, exteriors) have been made in the last 5 years, and what's planned in the next 2?
- Have any recent inspections been done? Can we get a copy of the seller's disclosures and any deferred-maintenance estimates?
- Is there a deadline driving the sale (1031 exchange, divorce, estate, relocation)? That informs how much negotiation room exists.
- What's the average days-on-market for RENTAL listings here right now (not sales)? A rising rental-DOM trend means longer vacancies and softer asking-rent achievability than the comps imply.
- What's the recent tenant-quality profile in this submarket — average credit score on applications, eviction rate, late-payment / NSF rate, and stable-employment percentage? A property-management company in the area should have these aggregated.
- How much new apartment / multifamily construction is in the pipeline within 1–3 miles? Heavy new supply (>2% of stock underway) typically softens rents 12–24 months out; light construction supports rent growth.
Investment metrics
- 1% rule
- 1.22% ✓
- Cap rate
- 9.56%
- Cash-on-cash
- 11.67%
- DSCR
- 1.52
- GRM
- 6.8
CMA / ARV
No comps found within radius.
Projected returns pro-forma
-3.0% appreciation · 3.0% rent growth · sell at horizon
- IRR
- 1.1%
- Equity multiple
- 1.04×
- Total profit
- $4,635
- Equity at exit
- $59,641
- IRR
- 10.7%
- Equity multiple
- 1.84×
- Total profit
- $93,671
- Equity at exit
- $34,585
Cash invested: $112,000 (down + closing). Projections, not guarantees.
Landlord ↔ Tenant lean methodology
- Overall (STATE)
- 55 Moderately Landlord-Leaning
- State Virginia
- 55 Moderately Landlord-Leaning · D+2
- County
- — inherits STATE
- City
- — inherits STATE
ZIP-level market 22923
- Home prices YoY
- -3.6%
- Active inventory
- 184
- Price-to-rent
- 13.7×
Monthly cashflow live
- Estimated rent
- $4,878 high interval (Pro) →
- Mortgage (P&I)
- −$2,098
- Tax est. 1.5%
- −$500 /mo · $6,000/yr
- Insurance
- −$167
- HOA
- −$0
- Vacancy / Maint / Mgmt
- −$1,024
- Net cashflow
- $1,089
Break-even live
2-unit breakdown (identical units grouped — click to expand)
| Units | Beds | Baths | Est. rent |
|---|---|---|---|
| 2× units | 3.0 | 1.5 | $4,878 |
| #1 | 3.0 | 1.5 | $2,439 |
| #2 | 3.0 | 1.5 | $2,439 |
| Total (2 units) | $4,878 | ||
UW: 25.0% down · 7.5% · 30yr · 1.5% tax · 5.0% vac · 8.0% maint · 8.0% mgmt
Financing live
Cash to close
- Down payment
- $100,000
- Closing costs
- $12,000
- Reserves months
- —
- Total cash needed
- —
Loan-product check · same deal, 3 products live
Conventional
25% down · 7.5% · 30yr
- Down + closing
- —
- Monthly P&I
- —
- Monthly cashflow
- —
- DSCR
- —
- Eligible?
- —
Personal DTI + credit; lowest rate.
DSCR
20% down · 8.5% · 30yr
- Down + closing
- —
- Monthly P&I
- —
- Monthly cashflow
- —
- DSCR
- —
- Eligible?
- —
No personal income docs; deal must DSCR.
Hard money
10% down · 12.0% · 12mo
- Down + closing
- —
- Monthly P&I
- —
- Monthly cashflow
- —
- DSCR
- —
- Eligible?
- —
Short-term bridge; refi at stabilization.
Listing history 7 events
-
2026-06-14statusdays on market $400,000 Pending 7 DOM
-
2026-06-13days on market $400,000 Active 6 DOM
-
2026-06-10days on market $400,000 Active 4 DOM
-
2026-06-09days on market $400,000 Active 3 DOM
-
2026-06-08days on market $400,000 Active 2 DOM
-
2026-06-07remarks 699-char remark
-
2026-06-07$400,000 Active 1 DOM
ⓘ Source: listings_history table (triggers on properties + properties_extension) + one-shot
backfill from property_details.listing_events for pre-trigger history.
Climate risk First Street
- Flood 1/10 Low FEMA zone X (unshaded) · 0% chance over 30 yrs
- Wildfire 4/10 Moderate
- Heat 6/10 Major 7 d/yr ≥103°F today · 17 d/yr by 30 yrs out
- Wind 2/10 Low 3% chance of damaging wind over 30 yrs
- Air quality 1/10 Low 0 unhealthy d/yr today · 0 by 30 yrs out
Nearby sold comps map
Loading sold comps map…
Walkable amenities ~0.75 mi
Loading nearby amenities…
Taxation est. · year 1
- Rental income
- $58,536
- − Mortgage interest
- −$22,406
- − Property taxes
- −$6,000
- − Insurance
- −$2,000
- − Repairs & maintenance
- −$4,683
- − Management
- −$4,683
- − Depreciation
- −$11,636
- Taxable income
- $7,128
- Est. tax owed @ 24.0%
- −$1,711
- After-tax cash flow
- $11,361/yr
For passive investors: Depreciation is non-cash, so a rental often shows a tax loss while cash-flowing — sheltering income. Rental losses are passive: they offset passive income freely, and up to $25,000/yr can offset ordinary (W-2) income if you actively participate and your MAGI is under $100k (phasing out to $0 by $150k); unused losses carry forward. On sale, claimed depreciation is recaptured at up to 25%, and gains may owe capital-gains tax (a 1031 exchange can defer both). Figures are a year-1 estimate at your 24.0% rate — not tax advice; consult a CPA.
Condition & rehab AI · 13 photos
The property is in fair condition with moderate repairs and maintenance needed. Upgrading the kitchen and bathrooms, along with exterior painting and landscaping, would significantly increase its value.
Repairs flagged
- Moderate Kitchen cabinets — Older cabinets with visible wear and tear.
- Moderate Kitchen appliances — Older appliances with visible wear and tear.
- Moderate Kitchen countertops — Older countertops with visible wear and tear.
- Moderate Bathroom fixtures — Simple fixtures with dated design.
- Moderate Exterior paint — Brick siding appears weathered.
- Moderate Interior paint — Paint appears faded in some areas.
- Moderate Landscaping — Some overgrown areas.
Value-add opportunities
- Both Kitchen renovation — Updating the kitchen will improve both resale and rental value.
- Both Bathroom renovation — Updating the bathrooms will improve both resale and rental value.
- Both Exterior painting — Repainting the exterior will improve curb appeal and rental value.
- Both Landscaping — Landscaping will improve curb appeal and rental value.
Renovation cost estimate screening
| Repair item | Severity | Est. cost |
|---|---|---|
| Kitchen cabinets · Older cabinets with visible wear and tear. | Moderate | $3,000–15,000 |
| Kitchen appliances · Older appliances with visible wear and tear. | Moderate | $3,000–15,000 |
| Kitchen countertops · Older countertops with visible wear and tear. | Moderate | $3,000–15,000 |
| Bathroom fixtures · Simple fixtures with dated design. | Moderate | $3,000–15,000 |
| Exterior paint · Brick siding appears weathered. | Moderate | $3,000–15,000 |
| Interior paint · Paint appears faded in some areas. | Moderate | $3,000–15,000 |
| Landscaping · Some overgrown areas. | Moderate | $3,000–15,000 |
| Total estimated repair cost · 7 items | $21,000–105,000 |
Value-add ROI direction
- Both Kitchen renovation — Updating the kitchen will improve both resale and rental value. ↑
- Both Bathroom renovation — Updating the bathrooms will improve both resale and rental value. ↑
- Both Exterior painting — Repainting the exterior will improve curb appeal and rental value. ↑
- Both Landscaping — Landscaping will improve curb appeal and rental value. ↑
ⓘ Cost ranges are severity-bucket heuristics (US national rule-of-thumb). Get contractor quotes + a written scope before underwriting a rehab budget.
Schools (NCES district)
- District
- Greene County Public School District
- NCES district ID
- 5101710
- Math proficiency
- 40% ▼ -37.00%
- Reading proficiency
- 64% ▼ -7.00%
- Median HH income
- $59,129
- Composite
- 45.22/100
- National rank
- #2668
- State rank
- #88 of 131 in VA
Livability — Ruckersville
- Score
- 66/100
- State rank
- #318
- US rank
- #11455
Category grades
Schools grade is shown separately in the Schools card above.
Census & demographics
- County
- Orange County · 21,992 people
- Metro
- Charlottesville, VA
- Population (ZIP)
- 6,435
- Household income
- $118,125
- Rent vs Own
- Severe rent burden
- 42.0
Population outlook (Greene County) Hauer SSP2
- Today (2025)
- 20,465 people
- By 2030
- 20,958 · +2.4%
- By 2040
- 21,619 · +5.6%
- By 2050
- 21,699 · +6.0%
- By 2075
- 21,656 · +5.8%
- By 2100
- 20,156 · -1.5%
Race, ethnicity, and origin ACS 2023
- Neighborhood character
- Predominantly White (89%)
- Race & ethnicity
- White 89% Black 5% Two or more races 5% Asian 1%
- Common ancestry
- Slovak 5% Portuguese 3% Italian 3%
- Foreign-born
- 3%
- Languages at home
- 97% English-only · Other Asian/Pacific 1% French/Haitian/Cajun 1% German/W. Germanic 1%
Political lean MEDSL · Greene
- 2024 margin
- Strong R (+24.7) · D 37.0% · R 61.7% · Other 1.2%
- 2008→2024 swing
- -2.9pp toward R · 2008: -21.9pp · 2024: -24.7pp
- All cycles
- 2024: R+24.7 2020: R+23.9 2016: R+31.8 2012: R+25.3 2008: R+21.9
Not yet ingested
- Civics
- —
Market trends
- HPI YoY
- ▼ -11.41%
- Current HPI
- 303.0348
- Rent YoY
- —
- Metro
- Charlottesville, VA
- State GDP YoY
- ▲ 2.40%
- F500 in state
- 50
Industry mix (Fortune 500 HQ in VA)
| Industry | F500 HQs | Revenue |
|---|---|---|
| Aerospace / Defense | 4 | $236B |
|
||
| Technology / Defense | 3 | $32B |
|
||
| Financial Services | 2 | $176B |
|
||
| Utilities | 2 | $27B |
|
||
| Insurance | 2 | $25B |
|
||
| Technology | 2 | $15B |
|
||
Price history
1 event — show timeline
- 2026-06-06 Listed $400,000 CAAR
Cash-flow waterfall
monthlySold comps — $/sqft
last 12 mo · ≤1 miLoading sold comps…