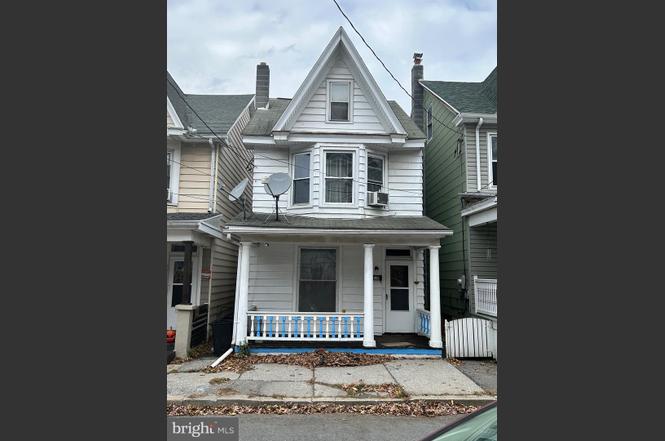
539 Arlington St · Tamaqua, PA
Flood risk 1/10 · Minimal
- FEMA flood zone
- X (unshaded)
- Chance of flooding over 30 yrs
- 0.0%
- Est. flood insurance / yr
- $473 – $860
Fire risk 3/10 · Minor
- Est. fire insurance / yr
- $511 – $949
Heat risk 3/10 · Minor
- Hot days now (above 95°F)
- 8 days/yr
- Hot days in 30 yrs
- 17 days/yr
Wind risk 4/10 · Minor
- Chance of severe wind over 30 yrs
- 8.0%
Air-quality risk 2/10 · Minimal
- Unhealthy air days now
- 1 days/yr
- Unhealthy air days in 30 yrs
- 2 days/yr
Risk factors via First Street. Map © Google.
Why this score? — see what drove the D+ grade
The composite is a weighted blend of 9 inputs, each scored 0–100. Each bar is that input's sub-score; the figure is the points it added to the 100-point composite (weight × sub-score).
- Cash flow +14.2/30.0
- ARV discount +12.4/15.0
- 1% rule +5.0/10.0
- DSCR +4.3/10.0
- Livability +4.0/5.0
- Schools +3.6/10.0
- Rent growth +2.5/5.0
- Condition / age +2.5/5.0
- Appreciation +0.0/10.0
$129,900
🖨 Deal sheet 📄 Offer letter ✓ Due diligence
Listing remarks
Tamaqua 4 BR single with detached 2 car garage with upper area storage. Vintage features, hardwood floors and original woodwork. With a little TLC this home could be a charmer. Kitchen has a full array of appliances, center peninsula, cozy breakfast nook, a framed out space for a half bath or laundry area. Full basement with walk out to fenced yard. Owner occupied so 24 hour notice appreciated. Motivated Seller. Currently mortgage is assumable.
Key facts
- Cozy breakfast nook
- Center peninsula
- Original woodwork
Tags
Neighborhood map
What this means for you Summary
Snapshot
- This is a 3-bed/1.0-bath single-family listed at $130k.
Deal economics
- At list price, monthly cash flow is $22 ($269/yr) — positive.
- The deal already cash-flows at list — no discount required.
- To meet the 1% rule (rent ≥ 1% of price), the offer needs to be $130k (0.2% below list).
- Recommended offer: $114k (12.0% below list) — sets the bar for market timing.
Location & tenants
- Location reads 80/100 on livability (#209 in PA, #1,844 nationally) — a professional / high-income tenant draw. Strengths: amenities A+, cost of living A+, housing A+; Watch: commute D+, employment F.
- Tamaqua Area SD (rural): math 31% / reading 53% proficiency, ranked #331 of 539 in PA (top 61%) — families likely to look elsewhere, expect single-tenant / working-renter base with shorter leases.
- Zoned schools: Tamaqua El Sch (math 35% / reading 56%, grade D-, #801 of 1,518 statewide, top 53%, 695 students, 68% FRL); Tamaqua Area Ms (math 20% / reading 46%, grade F, #346 of 512 statewide, top 69%, 433 students, 61% FRL); Tamaqua Area Shs (math 47% / reading 62%, grade C-, #99 of 437 statewide, top 23%, 691 students, 50% FRL) — zoned schools average 60% FRL vs 37% district-wide (23 pts higher); higher-poverty schools than district average — tighter screening recommended.
- Market conditions: 75 active listings in the ZIP; 5 comparable units currently listed for rent nearby; rentals lingering (median 44d on market — plan ~5-8 weeks vacancy on turnover, expect pricing pressure); 60% of comp listings sitting > 30 days — soft ceiling on asking rent; 169 units permitted in Schuylkill County in 2024 (0 in 5+ unit buildings).
Forward outlook
- Local home prices are declining (-3.0%/yr); year-one equity from $898 of loan paydown is wiped out by about $4k of value loss. Plan a longer hold.
- Schuylkill County population projected at -16% by 2050 — secular population decline; favor cash flow + early exit over multi-decade hold.
Negotiation context
- It's been on market 138 days — a 12% lower offer ($114k) is reasonable based on typical stale-listing flexibility.
- 11 sale attempts since 20y ago with the ask held roughly flat each time — persistent listings suggest the price (not the market) is what's stuck; bring a comps-based counter.
- Current owner paid $70k; list at $130k implies a 86% gain — meaningful room to come down on a strong offer.
Risks & watch-outs
- Watch-outs: built in 1900 — expect roof / HVAC / electrical / plumbing capex.
Questions for the listing agent
- It's been on market 138 days. Have you received any prior offers? Is the seller open to a 12% concession, seller financing, or rate buy-down credit?
- Built in 1900 — when were the roof, HVAC, electrical panel, plumbing, and water heater last replaced?
- Why hasn't it sold? Are there any deal-killer items the seller is aware of (foundation, flood, title, zoning, code violations)?
- Is there a deadline driving the sale (1031 exchange, divorce, estate, relocation)? That informs how much negotiation room exists.
- The area grade is low — what's the realistic commute time and amenity access for the typical tenant pool here? Any planned neighborhood developments (good or bad) we should know about?
- What's the average days-on-market for RENTAL listings here right now (not sales)? A rising rental-DOM trend means longer vacancies and softer asking-rent achievability than the comps imply.
- What's the recent tenant-quality profile in this submarket — average credit score on applications, eviction rate, late-payment / NSF rate, and stable-employment percentage? A property-management company in the area should have these aggregated.
- How much new for-sale + rental construction is in the pipeline within 1–3 miles? Heavy new supply typically softens prices + rents 12–24 months out; constrained supply supports both.
Investment metrics
- 1% rule
- 1.00% ✗
- Cap rate
- 6.50%
- Cash-on-cash
- 0.74%
- DSCR
- 1.03
- GRM
- 8.4
CMA / ARV
- ARV (on-the-fly)
- $145,920
- Comps found
- 12
Show comp detail 12 sales within ~0.75 mi
| Address | Dist | Beds/Ba | Sqft | Sold | Price | $/sf | Match |
|---|---|---|---|---|---|---|---|
| 310 Biddle St | 0.38mi | 4/1.0 (+1) | 1,492 (-3%) | 14mo | $107,500 | $72 | 61 |
| 514 Arlington St | 0.05mi | 4/2.0 (+1) | 1,650 (+7%) | 20mo | $200,000 | $121 | 60 |
| 524 W Willing St | 0.36mi | 3/1.0 | 1,385 (-10%) | 9mo | $185,000 | $134 | 60 |
| 446 Biddle St | 0.29mi | 3/1.5 | 1,306 (-15%) | 4mo | $110,000 | $84 | 56 |
| 306 E Elm St | 0.51mi | 3/1.5 | 1,636 (+6%) | 14mo | $170,000 | $104 | 52 |
| 111 Lafayette St | 0.68mi | 3/1.5 | 1,572 (+2%) | 16mo | $140,000 | $89 | 50 |
| 65 S Nescopec St | 0.69mi | 3/1.5 | 1,472 (-4%) | 13mo | $151,000 | $103 | 48 |
| 215 Schuylkill Ave | 0.45mi | 4/1.5 (+1) | 1,680 (+9%) | 19mo | $160,000 | $95 | 40 |
| 101 Clay St | 0.67mi | 4/2.0 (+1) | 1,652 (+8%) | 9mo | $215,000 | $130 | 39 |
| 154 W Spruce St | 0.73mi | 3/1.5 | 1,440 (-6%) | 18mo | $40,000 | $28 | 38 |
| 517 Rolling Mill Ave | 0.70mi | 3/1.5 | 1,676 (+9%) | 18mo | $159,900 | $95 | 35 |
| 412 Washington St | 0.71mi | 3/2.0 | 1,667 (+8%) | 21mo | $159,000 | $95 | 31 |
Match score weights: distance 35% · size 25% · config 20% · recency 20%. Top-matched comps best support the ARV.
Projected returns pro-forma
-3.0% appreciation · 3.0% rent growth · sell at horizon
- IRR
- -15.0%
- Equity multiple
- 0.46×
- Total profit
- $-19,537
- Equity at exit
- $19,369
- IRR
- -6.3%
- Equity multiple
- 0.59×
- Total profit
- $-14,834
- Equity at exit
- $11,231
Cash invested: $36,372 (down + closing). Projections, not guarantees.
Landlord ↔ Tenant lean methodology
- Overall (STATE)
- 62 Landlord-Friendly
- State Pennsylvania
- 62 Landlord-Friendly · EVEN
- County
- — inherits STATE
- City
- — inherits STATE
ZIP-level market 18252
- Home prices YoY
- -15.4%
- Active inventory
- 75
- Price-to-rent
- 8.4×
Monthly cashflow live
- Estimated rent
- $1,296 high interval (Pro) →
- Mortgage (P&I)
- −$681
- Tax from tax record
- −$266 /mo · $3,191/yr
- Insurance
- −$54
- HOA
- −$0
- Vacancy / Maint / Mgmt
- −$272
- Net cashflow
- $22
Break-even live
UW: 25.0% down · 7.5% · 30yr · 1.5% tax · 5.0% vac · 8.0% maint · 8.0% mgmt
Financing live
Cash to close
- Down payment
- $32,475
- Closing costs
- $3,897
- Reserves months
- —
- Total cash needed
- —
Loan-product check · same deal, 3 products live
Conventional
25% down · 7.5% · 30yr
- Down + closing
- —
- Monthly P&I
- —
- Monthly cashflow
- —
- DSCR
- —
- Eligible?
- —
Personal DTI + credit; lowest rate.
DSCR
20% down · 8.5% · 30yr
- Down + closing
- —
- Monthly P&I
- —
- Monthly cashflow
- —
- DSCR
- —
- Eligible?
- —
No personal income docs; deal must DSCR.
Hard money
10% down · 12.0% · 12mo
- Down + closing
- —
- Monthly P&I
- —
- Monthly cashflow
- —
- DSCR
- —
- Eligible?
- —
Short-term bridge; refi at stabilization.
Rent comps 5 comps
| Address | Beds | Baths | Sqft | Rent | $/sqft | DOM | Units | Dist |
|---|---|---|---|---|---|---|---|---|
| 234 Mauch Chunk St Unit 2 Tamaqua, PA | 3.0 | 1.0 | 1100 | $1,425 | $1.30 | 23d | 1 | 0.37mi |
| 128 E Broad St Unit 128B Tamaqua, PA | 3.0 | 1.0 | 1623 | $1,450 | $0.89 | 43d | 1 | 0.45mi |
| 128 E Broad St Unit 128C Tamaqua, PA | 2.0 | 1.0 | 1055 | $1,200 | $1.14 | 43d | 1 | 0.45mi |
| 435 E Union St Tamaqua, PA | 3.0 | 1.0 | 1560 | $1,275 | $0.82 | 14d | 1 | 0.45mi |
| 223 Schuylkill Ave Tamaqua, PA | 3.0 | 1.0 | 1100 | $1,050 | $0.95 | 43d | 1 | 0.46mi |
Listing history 29 events
-
2026-05-18historical
-
2026-04-10status Pending
-
2025-11-23$129,900 Active
-
2025-11-23$129,900 Active
-
2024-02-07historical
-
2024-02-07historical
-
2024-01-02price $145,000
-
2024-01-02price $145,000
-
2023-11-11$149,000 Active
-
2023-11-11$149,000 Active
-
2016-09-26soldstatus $69,900
-
2016-09-26soldstatus $69,900
-
2016-09-26soldstatus $69,900
-
2016-07-22historical
-
2016-05-13$69,900
-
2016-05-13$69,900
-
2016-01-22historical
-
2012-12-31historical
-
2012-12-07$47,942
-
2012-12-01historical
-
2012-05-24$84,900
-
2012-05-24$84,900
-
2007-07-20soldstatus $98,000
-
2007-07-20soldstatus $98,000
-
2007-07-20soldstatus $98,000
-
2006-10-04$109,500
-
2006-10-04historical
-
2006-10-04$98,000
-
2005-09-19soldstatus $15,000
ⓘ Source: listings_history table (triggers on properties + properties_extension) + one-shot
backfill from property_details.listing_events for pre-trigger history.
Tax reassessment forecast PA · Partial reset (capped growth)
- Current annual tax
- $3,191 · $266/mo
- Projected year-2 tax
- $3,191 · $266/mo
- Expected delta
- $0/yr ($0/mo · 0.0%)
ⓘ Screening estimate from a state-policy table — verify with the county assessor before closing.
Climate risk First Street
- Flood 1/10 Low FEMA zone X (unshaded) · 0% chance over 30 yrs
- Wildfire 3/10 Moderate
- Heat 3/10 Moderate 8 d/yr ≥95°F today · 17 d/yr by 30 yrs out
- Wind 4/10 Moderate 8% chance of damaging wind over 30 yrs
- Air quality 2/10 Low 1 unhealthy d/yr today · 2 by 30 yrs out
Nearby sold comps map
Loading sold comps map…
Walkable amenities ~0.75 mi
Loading nearby amenities…
Taxation est. · year 1
- Rental income
- $15,550
- − Mortgage interest
- −$7,276
- − Property taxes
- −$3,191
- − Insurance
- −$650
- − Repairs & maintenance
- −$1,244
- − Management
- −$1,244
- − Depreciation
- −$3,779
- Taxable loss
- −$1,834
- Est. tax savings @ 24.0%
- +$440
- After-tax cash flow
- $709/yr
For passive investors: Depreciation is non-cash, so a rental often shows a tax loss while cash-flowing — sheltering income. Rental losses are passive: they offset passive income freely, and up to $25,000/yr can offset ordinary (W-2) income if you actively participate and your MAGI is under $100k (phasing out to $0 by $150k); unused losses carry forward. On sale, claimed depreciation is recaptured at up to 25%, and gains may owe capital-gains tax (a 1031 exchange can defer both). Figures are a year-1 estimate at your 24.0% rate — not tax advice; consult a CPA.
Schools (NCES district)
- District
- Tamaqua Area SD
- NCES district ID
- 4223220
- Math proficiency
- 31% ▼ -9.00%
- Reading proficiency
- 53% ▼ -8.00%
- Median HH income
- $45,184
- Composite
- 35.61/100
- National rank
- #4893
- State rank
- #331 of 539 in PA
Livability — Tamaqua
- Score
- 80/100
- State rank
- #209
- US rank
- #1844
Category grades
Schools grade is shown separately in the Schools card above.
Census & demographics
- Census place
- Tamaqua, PA
- Population (ZIP)
- 11,065
Population outlook (Schuylkill County) Hauer SSP2
- Today (2025)
- 137,447 people
- By 2030
- 133,121 · -3.1%
- By 2040
- 124,172 · -9.7%
- By 2050
- 115,611 · -15.9%
- By 2075
- 100,796 · -26.7%
- By 2100
- 86,667 · -36.9%
Race, ethnicity, and origin ACS 2023
- Neighborhood character
- Predominantly White (87%)
- Race & ethnicity
- White 87% Hispanic / Latino 9% Two or more races 8%
- Hispanic origin (detail)
- Mexican 3% Puerto Rican 3% Salvadoran 2%
- Common ancestry
- Romanian 11% Iranian 3% Polish 2%
- Foreign-born
- 2% · Canada, Dominican Republic
- Languages at home
- 97% English-only · Spanish 2%
Political lean MEDSL · Schuylkill
- 2024 margin
- Solid R (+42.1) · D 28.5% · R 70.6%
- 2008→2024 swing
- -33.4pp toward R · 2008: -8.7pp · 2024: -42.1pp
- All cycles
- 2024: R+42.1 2020: R+39.9 2016: R+43.4 2012: R+13.4 2008: R+8.7
Not yet ingested
- Civics
- —
Market trends
- HPI YoY
- ▼ -35.53%
- Current HPI
- 194.8976
- Rent YoY
- —
- Metro
- —
- State GDP YoY
- ▲ 1.68%
- F500 in state
- 34
Industry mix (Fortune 500 HQ in PA)
| Industry | F500 HQs | Revenue |
|---|---|---|
| Healthcare | 2 | $309B |
|
||
| Insurance | 2 | $27B |
|
||
| Telecommunications / Media | 1 | $124B |
|
||
| Industrial Distribution | 1 | $22B |
|
||
| Financial Services | 1 | $20B |
|
||
| Chemicals / Materials | 1 | $18B |
|
||
Price history
+766.0% since first listed29 events — show timeline
- 2026-05-18 Listing Removed — GLVRMLS
- 2026-04-10 Pending — BRIGHT MLS
- 2025-11-23 Listed $129,900 BRIGHT MLS
- 2025-11-23 Listed $129,900 GLVRMLS
- 2024-02-07 Listing Removed — GLVRMLS
- 2024-02-07 Listing Removed — BRIGHT MLS
- 2024-01-02 Price Changed $145,000 GLVRMLS
- 2024-01-02 Price Changed $145,000 BRIGHT MLS
- 2023-11-11 Listed $149,000 BRIGHT MLS
- 2023-11-11 Listed $149,000 GLVRMLS
- 2016-09-26 Sold (Public Records) $69,900 Public Records
- 2016-09-26 Sold (MLS) $69,900 BRIGHT MLS
- 2016-09-26 Sold (MLS) $69,900 GLVRMLS
- 2016-07-22 Listing Removed — BRIGHT MLS
- 2016-05-13 Listed $69,900 BRIGHT MLS
- 2016-05-13 Listed $69,900 GLVRMLS
- 2016-01-22 Listing Removed — BRIGHT MLS
- 2012-12-31 Listing Removed — GLVRMLS
- 2012-12-07 Listed $47,942 GLVRMLS
- 2012-12-01 Listing Removed — GLVRMLS
- 2012-05-24 Listed $84,900 GLVRMLS
- 2012-05-24 Listed $84,900 BRIGHT MLS
- 2007-07-20 Sold (Public Records) $98,000 Public Records
- 2007-07-20 Sold (MLS) $98,000 BRIGHT MLS
- 2007-07-20 Sold (MLS) $98,000 GLVRMLS
- 2006-10-04 Listed $98,000 BRIGHT MLS
- 2006-10-04 Listing Removed — BRIGHT MLS
- 2006-10-04 Listed $109,500 GLVRMLS
- 2005-09-19 Sold (Public Records) $15,000 Public Records
Property tax history
+2.7%/yrLatest (2025): $3,191 · +7.9% YoY. Source: county tax records.
Cash-flow waterfall
monthlySold comps — $/sqft
last 12 mo · ≤1 miLoading sold comps…