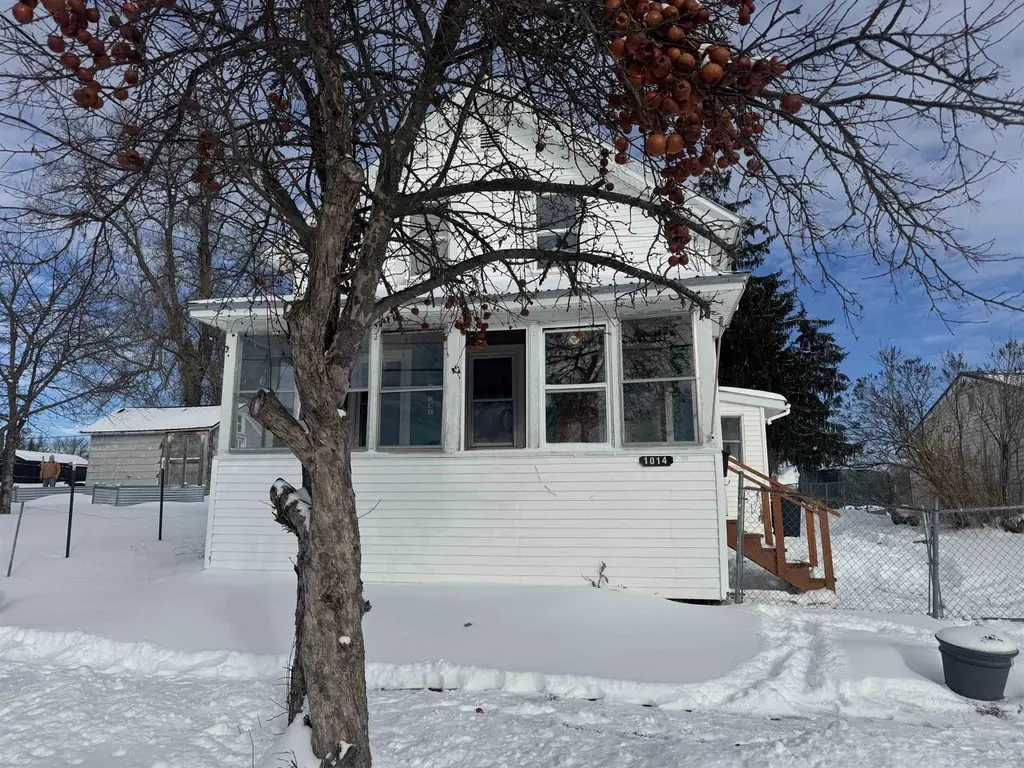
1014 Mechanic St · Ogdensburg, NY
Flood risk 1/10 · Minimal
- FEMA flood zone
- X
- Chance of flooding over 30 yrs
- 0.0%
- Est. flood insurance / yr
- $473 – $860
Fire risk 1/10 · Minimal
- Est. fire insurance / yr
- $691 – $1,283
Heat risk 2/10 · Minimal
- Hot days now (above 93°F)
- 7 days/yr
- Hot days in 30 yrs
- 15 days/yr
Wind risk 1/10 · Minimal
- Chance of severe wind over 30 yrs
- —
Air-quality risk 2/10 · Minimal
- Unhealthy air days now
- 1 days/yr
- Unhealthy air days in 30 yrs
- 1 days/yr
Risk factors via First Street. Map © Google.
Why this score? — see what drove the A- grade
The composite is a weighted blend of 9 inputs, each scored 0–100. Each bar is that input's sub-score; the figure is the points it added to the 100-point composite (weight × sub-score).
- Cash flow +30.0/30.0
- ARV discount +15.0/15.0
- 1% rule +10.0/10.0
- DSCR +10.0/10.0
- Appreciation +5.5/10.0
- Schools +3.3/10.0
- Livability +3.3/5.0
- Rent growth +2.5/5.0
- Condition / age +2.5/5.0
$77,000
🖨 Deal sheet (PDF) 📄 Offer letter ✓ Due diligence
Listing remarks MLS
Welcome to 1014 Mechanic Street located in the city of Ogdensburg. Close to the school other amenities offered in the Area. This home offers two upstairs bedrooms and a full bath and on the main floor there is a double living room, kitchen, dining room, another full bath and laundry. Off the laundry and bathroom, there is another room which could be used in many options such as bedroom, office with outside entrance, in-law sweet and more. The very large fenced in yard is perfect for children, pets or family gatherings. Come and check it out. Call your realtor and come and check it out.
Key facts
- Double living room
- Outside entrance
- Fenced in yard
Tags
Neighborhood map
What this means for you Summary
Snapshot
- This is a 3-bed/2.0-bath single-family listed at $77k.
Deal economics
- At list price, monthly cash flow is $342 ($4k/yr) — positive.
- The deal already cash-flows at list — no discount required.
- Meets the 1% rule at list price ($1k rent vs $77k).
- Recommended offer: $68k (12.0% below list) — sets the bar for market timing.
- Cap rate 11.6% vs local median 5.3% in Ogdensburg — top-decile yield for the area; either an underpriced asset or a hidden risk that comps aren't pricing in. Stress-test before assuming the spread holds.
Location & tenants
- Location reads 66/100 on livability (#624 in NY) — a middle-class / working-renter tenant base. Strengths: cost of living A+, housing A+, health & safety A+; Watch: employment D+, schools D-, crime F.
- Ogdensburg City School District (town): math 34% / reading 46% proficiency, ranked #531 of 590 in NY (top 90%) — families likely to look elsewhere, expect single-tenant / working-renter base with shorter leases.
- Market conditions: 133 active listings in the ZIP; 215 units permitted in St. Lawrence County in 2024 (0 in 5+ unit buildings).
Forward outlook
- In year one you build about $1k of equity ($532 loan paydown + $822 appreciation (1.1% local appreciation)).
- St. Lawrence County population projected at -14% by 2050 — secular population decline; favor cash flow + early exit over multi-decade hold.
- At projected returns (1.1% appreciation + 3.0% rent growth), your $22k cash investment doubles in ~4 years — after that, you're playing with house money.
Negotiation context
- It's been on market 147 days — a 12% lower offer ($68k) is reasonable based on typical stale-listing flexibility.
- 3 sale attempts since 10y ago with the ask held roughly flat each time — persistent listings suggest the price (not the market) is what's stuck; bring a comps-based counter.
- Current owner paid $25k; list at $77k implies a 208% gain — meaningful room to come down on a strong offer.
Risks & watch-outs
- Watch-outs: built in 1890 — expect roof / HVAC / electrical / plumbing capex.
Questions for the listing agent
- It's been on market 147 days. Have you received any prior offers? Is the seller open to a 12% concession, seller financing, or rate buy-down credit?
- Built in 1890 — when were the roof, HVAC, electrical panel, plumbing, and water heater last replaced?
- Why hasn't it sold? Are there any deal-killer items the seller is aware of (foundation, flood, title, zoning, code violations)?
- Is there a deadline driving the sale (1031 exchange, divorce, estate, relocation)? That informs how much negotiation room exists.
- Schools are D-rated, which usually means shorter tenancies and higher turnover. Who's the typical renter profile here, and what's been the actual vacancy rate?
- Crime grade is F in this area — have there been break-ins, vandalism, or insurance claims at this property in the last 3 years? What carrier currently insures it and at what premium?
- What's the average days-on-market for RENTAL listings here right now (not sales)? A rising rental-DOM trend means longer vacancies and softer asking-rent achievability than the comps imply.
- What's the recent tenant-quality profile in this submarket — average credit score on applications, eviction rate, late-payment / NSF rate, and stable-employment percentage? A property-management company in the area should have these aggregated.
- How much new for-sale + rental construction is in the pipeline within 1–3 miles? Heavy new supply typically softens prices + rents 12–24 months out; constrained supply supports both.
Investment metrics
- 1% rule
- 1.54% ✓
- Cap rate
- 11.62%
- Cash-on-cash
- 19.02%
- DSCR
- 1.85
- GRM
- 5.4
CMA / ARV
- ARV (median comp)
- $92,318
- List price
- $77,000
- Delta
- -16.59%
- Verdict
- UNDERPRICED
- Comps
- 20 within 1.0 mi
Show comp detail 12 sales within ~0.75 mi
| Address | Dist | Beds/Ba | Sqft | Sold | Price | $/sf | Match |
|---|---|---|---|---|---|---|---|
| 1011 New York Ave | 0.34mi | 3/1.0 | 1,384 (-3%) | 6mo | $116,000 | $84 | 70 |
| 625 Mansion Ave | 0.43mi | 3/2.0 | 1,366 (-4%) | 3mo | $80,000 | $59 | 70 |
| 1114 Pickering St | 0.17mi | 4/1.0 (+1) | 1,550 (+9%) | 6mo | $17,000 | $11 | 64 |
| 906 Franklin St | 0.39mi | 3/1.0 | 1,328 (-7%) | 4mo | $47,000 | $35 | 63 |
| 924 Caroline St | 0.31mi | 3/2.0 | 1,578 (+11%) | 6mo | $86,500 | $55 | 63 |
| 931 Elizabeth St | 0.43mi | 3/1.0 | 1,550 (+9%) | 6mo | $88,000 | $57 | 56 |
| 428 Pine St | 0.55mi | 3/1.0 | 1,497 (+5%) | 7mo | $159,900 | $107 | 56 |
| 616 Elizabeth St | 0.57mi | 4/1.5 (+1) | 1,492 (+5%) | 4mo | $78,000 | $52 | 55 |
| 418 St. Lawrence Ave | 0.59mi | 4/1.0 (+1) | 1,450 (+2%) | 9mo | $124,000 | $86 | 54 |
| 2 Grove St | 0.23mi | 2/1.0 (-1) | 1,226 (-14%) | 4mo | $57,500 | $47 | 53 |
| 624 Morris St | 0.62mi | 3/1.5 | 1,300 (-9%) | 6mo | $42,000 | $32 | 49 |
| 403 Rensselaer Ave | 0.63mi | 3/2.0 | 1,596 (+12%) | 3mo | $130,000 | $81 | 49 |
Match score weights: distance 35% · size 25% · config 20% · recency 20%. Top-matched comps best support the ARV.
Projected returns pro-forma
1.07% appreciation · 3.0% rent growth · sell at horizon
- IRR
- 21.3%
- Equity multiple
- 2.09×
- Total profit
- $23,511
- Equity at exit
- $26,556
- IRR
- 24.2%
- Equity multiple
- 3.95×
- Total profit
- $63,498
- Equity at exit
- $35,500
Cash invested: $21,560 (down + closing). Projections, not guarantees.
Landlord ↔ Tenant lean methodology
- Overall (STATE)
- 15 Strongly Tenant-Friendly
- State New York
- 15 Strongly Tenant-Friendly · D+10
- County
- — inherits STATE
- City
- — inherits STATE
ZIP-level market 13669
- Home prices YoY
- 0.4%
- Active inventory
- 133
- Price-to-rent
- 5.4×
Monthly cashflow live
- Estimated rent
- $1,187 medium interval (Pro) →
- Mortgage (P&I)
- −$404
- Tax from tax record
- −$160 /mo · $1,925/yr
- Insurance
- −$32
- HOA
- −$0
- Vacancy / Maint / Mgmt
- −$249
- Net cashflow
- $342
Break-even live
Sensitivity live
| Price | -10% $385 | -5% $363 | +0% $342 | +5% $320 | +10% $298 |
|---|---|---|---|---|---|
| Rent | -10% $248 | -5% $295 | +0% $342 | +5% $389 | +10% $435 |
| Rate | -1.0pp $380 | -0.5pp $361 | base $342 | +0.5pp $322 | +1.0pp $301 |
UW: 25.0% down · 7.5% · 30yr · 1.5% tax · 5.0% vac · 8.0% maint · 8.0% mgmt
Financing live
Cash to close
- Down payment
- $19,250
- Closing costs
- $2,310
- Reserves months
- —
- Total cash needed
- —
Loan-product check · same deal, 3 products live
Conventional
25% down · 7.5% · 30yr
- Down + closing
- —
- Monthly P&I
- —
- Monthly cashflow
- —
- DSCR
- —
- Eligible?
- —
Personal DTI + credit; lowest rate.
DSCR
20% down · 8.5% · 30yr
- Down + closing
- —
- Monthly P&I
- —
- Monthly cashflow
- —
- DSCR
- —
- Eligible?
- —
No personal income docs; deal must DSCR.
Hard money
10% down · 12.0% · 12mo
- Down + closing
- —
- Monthly P&I
- —
- Monthly cashflow
- —
- DSCR
- —
- Eligible?
- —
Short-term bridge; refi at stabilization.
Listing history 17 events
-
2026-06-13days on market $77,000 Active 147 DOM
-
2026-06-12days on market $77,000 Active 146 DOM
-
2026-06-09days on market $77,000 Active 143 DOM
-
2026-06-08days on market $77,000 Active 142 DOM
-
2026-06-07days on market $77,000 Active 141 DOM
-
2026-06-07days on market $77,000 Active 140 DOM
-
2026-06-04days on market $77,000 Active 137 DOM
-
2026-06-02days on market $77,000 Active 136 DOM
-
2026-06-01days on market $77,000 Active 135 DOM
-
2026-05-31days on market $77,000 Active 134 DOM
-
2026-03-31historical
-
2026-01-17$77,000 Active 592-char remark
Show marketing remark (592 chars)
Welcome to 1014 Mechanic Street located in the city of Ogdensburg. Close to the school other amenities offered in the Area. This home offers two upstairs bedrooms and a full bath and on the main floor there is a double living room, kitchen, dining room, another full bath and laundry. Off the laundry and bathroom, there is another room which could be used in many options such as bedroom, office with outside entrance, in-law sweet and more. The very large fenced in yard is perfect for children, pets or family gatherings. Come and check it out. Call your realtor and come and check it out.
-
2025-11-07price $77,000
-
2025-09-21price $84,000
-
2025-09-20$840 Active
-
2017-11-17soldstatus $25,000
-
2016-08-22$25,000
ⓘ Source: listings_history table (triggers on properties + properties_extension) + one-shot
backfill from property_details.listing_events for pre-trigger history.
Tax reassessment forecast NY · Partial reset (capped growth)
- Current annual tax
- $1,925 · $160/mo
- Projected year-2 tax
- $1,925 · $160/mo
- Expected delta
- $0/yr ($0/mo · -0.0%)
ⓘ Screening estimate from a state-policy table — verify with the county assessor before closing.
Climate risk First Street
- Flood 1/10 Low FEMA zone X · 0% chance over 30 yrs
- Wildfire 1/10 Low
- Heat 2/10 Low 7 d/yr ≥93°F today · 15 d/yr by 30 yrs out
- Wind 1/10 Low
- Air quality 2/10 Low 1 unhealthy d/yr today · 1 by 30 yrs out
Nearby sold comps map
Loading sold comps map…
Walkable amenities ~0.75 mi
Loading nearby amenities…
Taxation est. · year 1
- Rental income
- $14,247
- − Mortgage interest
- −$4,313
- − Property taxes
- −$1,925
- − Insurance
- −$385
- − Repairs & maintenance
- −$1,140
- − Management
- −$1,140
- − Depreciation
- −$2,240
- Taxable income
- $3,105
- Est. tax owed @ 24.0%
- −$745
- After-tax cash flow
- $3,355/yr
For passive investors: Depreciation is non-cash, so a rental often shows a tax loss while cash-flowing — sheltering income. Rental losses are passive: they offset passive income freely, and up to $25,000/yr can offset ordinary (W-2) income if you actively participate and your MAGI is under $100k (phasing out to $0 by $150k); unused losses carry forward. On sale, claimed depreciation is recaptured at up to 25%, and gains may owe capital-gains tax (a 1031 exchange can defer both). Figures are a year-1 estimate at your 24.0% rate — not tax advice; consult a CPA.
Schools (NCES district)
- District
- Ogdensburg City School District
- NCES district ID
- 3621660
- Math proficiency
- 34% ▼ -15.00%
- Reading proficiency
- 46% ▲ 6.00%
- Median HH income
- $38,253
- Composite
- 33.33/100
- National rank
- #5497
- State rank
- #531 of 590 in NY
Livability — Ogdensburg
- Score
- 66/100
- State rank
- #624
- US rank
- #11365
Category grades
Schools grade is shown separately in the Schools card above.
Census & demographics
- Census place
- Ogdensburg, NY
- Population (ZIP)
- 15,615
Population outlook (St. Lawrence County) Hauer SSP2
- Today (2025)
- 110,027 people
- By 2030
- 107,455 · -2.3%
- By 2040
- 100,492 · -8.7%
- By 2050
- 94,254 · -14.3%
- By 2075
- 80,175 · -27.1%
- By 2100
- 63,140 · -42.6%
Race, ethnicity, and origin ACS 2023
- Neighborhood character
- Predominantly White (91%)
- Race & ethnicity
- White 91% Black 4% Two or more races 3% Hispanic / Latino 2%
- Common ancestry
- Lithuanian 10% Polish 6% Slovak 3%
- Foreign-born
- 3% · Canada, China, Jamaica
- Languages at home
- 89% English-only · German/W. Germanic 9% Spanish 1%
Political lean MEDSL · St. Lawrence
- 2024 margin
- R (+18.0) · D 41.0% · R 59.0%
- 2008→2024 swing
- -34.3pp toward R · 2008: 16.3pp · 2024: -18.0pp
- All cycles
- 2024: R+18.0 2020: R+11.7 2016: R+10.8 2012: D+16.6 2008: D+16.3
Not yet ingested
- Civics
- —
Market trends
- HPI YoY
- ▲ 1.07%
- Current HPI
- 264.0261
- Rent YoY
- —
- Metro
- —
- State GDP YoY
- ▲ 2.60%
- F500 in state
- 92
Industry mix (Fortune 500 HQ in NY)
| Industry | F500 HQs | Revenue |
|---|---|---|
| Financial Services | 10 | $950B |
|
||
| Consumer Goods | 9 | $162B |
|
||
| Insurance | 4 | $225B |
|
||
| Telecommunications | 2 | $144B |
|
||
| Pharmaceuticals | 2 | $112B |
|
||
| Media / Entertainment | 2 | $69B |
|
||
Price history
+208.0% since first listed7 events — show timeline
- 2026-03-31 Listing Removed — CNYIS
- 2026-01-17 Listed $77,000 SLCMLS
- 2025-11-07 Price Changed $77,000 CNYIS
- 2025-09-21 Price Changed $84,000 CNYIS
- 2025-09-20 Listed $840 CNYIS
- 2017-11-17 Sold (MLS) $25,000 SLCMLS
- 2016-08-22 Listed $25,000 SLCMLS
Property tax history
+7.1%/yrLatest (2025): $1,925 · +0.7% YoY. Source: county tax records.
Cash-flow waterfall
monthlySold comps — $/sqft
last 12 mo · ≤1 miLoading sold comps…