7519 Dorr St #9 · Holland, OH
Flood risk 2/10 · Minimal
- FEMA flood zone
- X (unshaded)
- Chance of flooding over 30 yrs
- 0.05%
- Est. flood insurance / yr
- $507 – $1,088
Fire risk 1/10 · Minimal
- Est. fire insurance / yr
- $713 – $1,323
Heat risk 3/10 · Minor
- Hot days now (above 99°F)
- 7 days/yr
- Hot days in 30 yrs
- 16 days/yr
Wind risk 2/10 · Minimal
- Chance of severe wind over 30 yrs
- —
Air-quality risk 2/10 · Minimal
- Unhealthy air days now
- 1 days/yr
- Unhealthy air days in 30 yrs
- 2 days/yr
Risk factors via First Street. Map © Google.
Why this score? — see what drove the B grade
The composite is a weighted blend of 9 inputs, each scored 0–100. Each bar is that input's sub-score; the figure is the points it added to the 100-point composite (weight × sub-score).
- Cash flow +30.0/30.0
- 1% rule +10.0/10.0
- DSCR +10.0/10.0
- ARV discount +7.5/15.0
- Schools +4.5/10.0
- Livability +4.0/5.0
- Rent growth +3.1/5.0
- Condition / age +2.5/5.0
- Appreciation +0.0/10.0
$49,900
🖨 Deal sheet 📄 Offer letter ✓ Due diligence
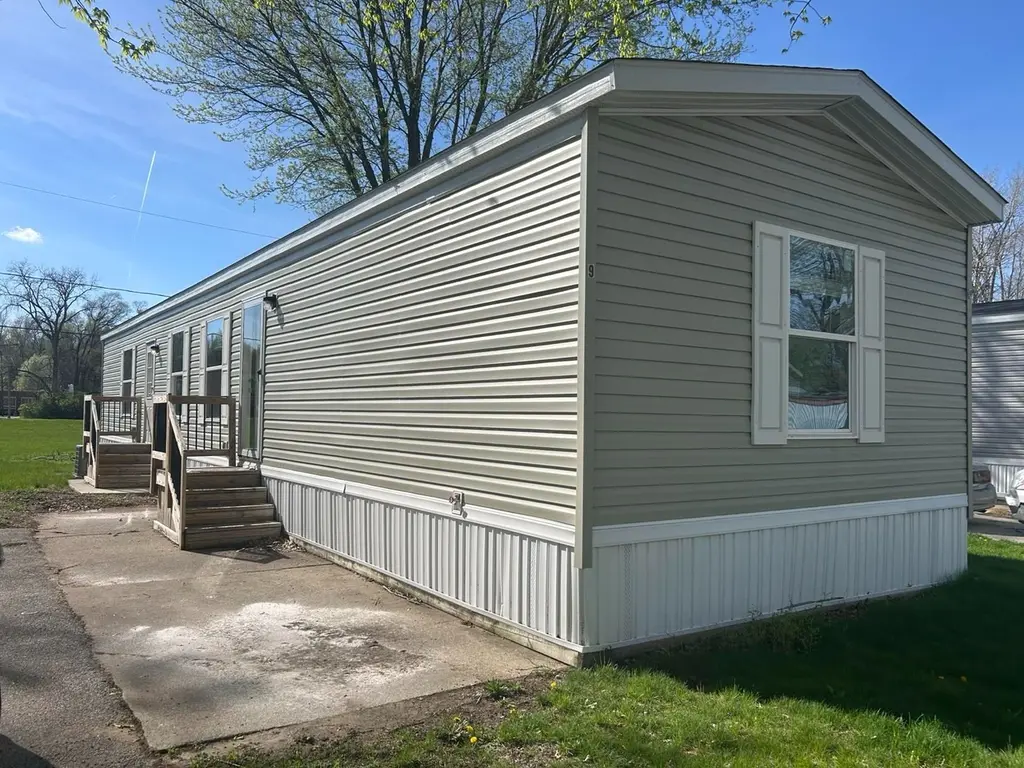
Listing remarks
Welcome to this well-maintained 3-bedroom, 2-bathroom home located in the desirable Royal Village community in Toledo, Ohio. Offering 1,056 square feet of thoughtfully designed living space, this home provides a comfortable and functional layout perfect for everyday living. Inside, you'll find a spacious living area that flows seamlessly into the kitchen and dining space, making it ideal for both relaxing and entertaining. The primary bedroom includes its own private bathroom, while two additional bedrooms offer flexibility for family, guests, or a home office. This home delivers a great combination of modern comfort and affordability in a convenient location. Situated within Royal Village,
Key facts
- Built 2026
- Listed 51 days
Property features AI
Finance
- Other: Address: 7519 Dorr St #9, Toledo, OH 43615; Inventory type: Spec; Plan name: CLAYTON BLAZER
- Financial info: List price $49,900
Exterior
- Utilities: Natural gas heating; Forced air; Cooling available
- Home design: Spec new construction (Plan: CLAYTON BLAZER); Active listing
- Construction: Living area approximately 1,056; Shake roof
- Exterior features: Shake roof
Interior
- Kitchen: Dishwasher; Refrigerator
- Bedrooms: 3 bedrooms
- Bathrooms: 2 bathrooms
- Heating & cooling: Natural gas forced air heating; Cooling present (type: Other)
- Interior features: Dishwasher; Refrigerator
Neighborhood map
What this means for you Summary
Snapshot
- This is a 3-bed/2.0-bath single-family listed at $50k.
Deal economics
- At list price, monthly cash flow is $663 ($8k/yr) — positive.
- The deal already cash-flows at list — no discount required.
- Meets the 1% rule at list price ($1k rent vs $50k).
- Recommended offer: $48k (3.0% below list) — sets the bar for market timing.
- Cap rate 22.2% vs local median 2.4% in Holland — top-decile yield for the area; either an underpriced asset or a hidden risk that comps aren't pricing in. Stress-test before assuming the spread holds.
Location & tenants
- Location reads 80/100 on livability (#110 in OH, #1,661 nationally) — a professional / high-income tenant draw. Strengths: cost of living A+, housing A+, health & safety A+; Watch: crime C-, commute F.
- Springfield Local (suburban): math 47% / reading 57% proficiency, ranked #404 of 656 in OH (top 62%) — acceptable for families but not a draw, mixed tenant base, ~2y average lease.
- Market conditions: Rents rising (+2.6%/yr); 114 active listings in the ZIP; 6 comparable units currently listed for rent nearby; rentals at typical pace (median 14d on market — plan ~3-4 weeks tenant-placement turnaround); 415 units permitted in Lucas County in 2024 (122 in 5+ unit buildings).
Forward outlook
- Local home prices are declining (-3.0%/yr); year-one equity from $345 of loan paydown is wiped out by about $1k of value loss. Plan a longer hold.
- Lucas County population projected at -16% by 2050 — secular population decline; favor cash flow + early exit over multi-decade hold.
- At projected returns (-3.0% appreciation + 2.6% rent growth), your $14k cash investment doubles in ~2 years — after that, you're playing with house money.
Negotiation context
- It's been on market 51 days — a 3% lower offer ($48k) is reasonable based on typical stale-listing flexibility.
Questions for the listing agent
- It's been on market 51 days. Have you received any prior offers? Is the seller open to a 3% concession, seller financing, or rate buy-down credit?
- Is there a deadline driving the sale (1031 exchange, divorce, estate, relocation)? That informs how much negotiation room exists.
- Schools are B-rated — typically a magnet for longer-tenancy family renters. What's the average tenant stay here, and is there a school-zone premium baked into asking?
- What's the average days-on-market for RENTAL listings here right now (not sales)? A rising rental-DOM trend means longer vacancies and softer asking-rent achievability than the comps imply.
- What's the recent tenant-quality profile in this submarket — average credit score on applications, eviction rate, late-payment / NSF rate, and stable-employment percentage? A property-management company in the area should have these aggregated.
- How much new for-sale + rental construction is in the pipeline within 1–3 miles? Heavy new supply typically softens prices + rents 12–24 months out; constrained supply supports both.
Investment metrics
- 1% rule
- 2.56% ✓
- Cap rate
- 22.24%
- Cash-on-cash
- 56.95%
- DSCR
- 3.53
- GRM
- 3.3
CMA / ARV
No comps found within radius.
Projected returns pro-forma
-3.0% appreciation · 2.59% rent growth · sell at horizon
- IRR
- 54.9%
- Equity multiple
- 3.41×
- Total profit
- $33,645
- Equity at exit
- $7,440
- IRR
- 59.9%
- Equity multiple
- 6.84×
- Total profit
- $81,628
- Equity at exit
- $4,314
Cash invested: $13,972 (down + closing). Projections, not guarantees.
Landlord ↔ Tenant lean methodology
- Overall (STATE)
- 73 Landlord-Friendly
- State Ohio
- 73 Landlord-Friendly · R+6
- County
- — inherits STATE
- City
- — inherits STATE
ZIP-level market 43615
- Home prices YoY
- -31.9%
- Rents YoY
- 2.6%
- Active inventory
- 114
- Price-to-rent
- 3.3×
Monthly cashflow live
- Estimated rent
- $1,276 high interval (Pro) →
- Mortgage (P&I)
- −$262
- Tax est. 1.5%
- −$62 /mo · $748/yr
- Insurance
- −$21
- HOA
- −$0
- Vacancy / Maint / Mgmt
- −$268
- Net cashflow
- $663
Break-even live
UW: 25.0% down · 7.5% · 30yr · 1.5% tax · 5.0% vac · 8.0% maint · 8.0% mgmt
Financing live
Cash to close
- Down payment
- $12,475
- Closing costs
- $1,497
- Reserves months
- —
- Total cash needed
- —
Loan-product check · same deal, 3 products live
Conventional
25% down · 7.5% · 30yr
- Down + closing
- —
- Monthly P&I
- —
- Monthly cashflow
- —
- DSCR
- —
- Eligible?
- —
Personal DTI + credit; lowest rate.
DSCR
20% down · 8.5% · 30yr
- Down + closing
- —
- Monthly P&I
- —
- Monthly cashflow
- —
- DSCR
- —
- Eligible?
- —
No personal income docs; deal must DSCR.
Hard money
10% down · 12.0% · 12mo
- Down + closing
- —
- Monthly P&I
- —
- Monthly cashflow
- —
- DSCR
- —
- Eligible?
- —
Short-term bridge; refi at stabilization.
Rent comps 6 comps
| Address | Beds | Baths | Sqft | Rent | $/sqft | DOM | Units | Dist |
|---|---|---|---|---|---|---|---|---|
| 1210 Country View Pl Toledo, OH | 2.0 | 1.0–2.0 | 966 | $1,130 | $1.17 | 14d | 1 | 0.73mi |
| 2150 N McCord Rd Toledo, OH | 1.0–2.0 | 1.0 | 765 | $1,315 | $1.72 | 14d | 6 | 1.21mi |
| 1800 N McCord Rd Toledo, OH | 2.0 | 1.0 | 934 | $900 | $0.96 | 14d | 1 | 1.23mi |
| 6535 Dorr St Toledo, OH | 1.0–2.0 | 1.0–2.0 | 895 | $1,000 | $1.12 | 21d | 1 | 1.27mi |
| 6633 W Bancroft St Toledo, OH | 1.0–3.0 | 1.0 | 941 | $1,179 | $1.25 | 14d | 1 | 1.27mi |
| 2130 Country Trace Pl Toledo, OH | 2.0 | 1.0–2.0 | 917 | $1,050 | $1.14 | 14d | 1 | 1.36mi |
Listing history 14 events
-
2026-06-18days on market $49,900 Active 51 DOM
-
2026-06-17days on market $49,900 Active 50 DOM
-
2026-06-16days on market $49,900 Active 49 DOM
-
2026-06-15days on market $49,900 Active 48 DOM
-
2026-06-14days on market $49,900 Active 46 DOM
-
2026-06-10days on market $49,900 Active 43 DOM
-
2026-06-09days on market $49,900 Active 42 DOM
-
2026-06-08days on market $49,900 Active 41 DOM
-
2026-06-07days on market $49,900 Active 40 DOM
-
2026-06-03days on market $49,900 Active 36 DOM
-
2026-06-02days on market $49,900 Active 35 DOM
-
2026-06-01days on market $49,900 Active 34 DOM
-
2026-05-31days on market $49,900 Active 33 DOM
-
2026-05-30days on market $49,900 Active 32 DOM
ⓘ Source: listings_history table (triggers on properties + properties_extension) + one-shot
backfill from property_details.listing_events for pre-trigger history.
Climate risk First Street
- Flood 2/10 Low FEMA zone X (unshaded) · 5% chance over 30 yrs
- Wildfire 1/10 Low
- Heat 3/10 Moderate 7 d/yr ≥99°F today · 16 d/yr by 30 yrs out
- Wind 2/10 Low
- Air quality 2/10 Low 1 unhealthy d/yr today · 2 by 30 yrs out
Nearby sold comps map
Loading sold comps map…
Walkable amenities ~0.75 mi
Loading nearby amenities…
Taxation est. · year 1
- Rental income
- $15,311
- − Mortgage interest
- −$2,795
- − Property taxes
- −$748
- − Insurance
- −$250
- − Repairs & maintenance
- −$1,225
- − Management
- −$1,225
- − Depreciation
- −$1,452
- Taxable income
- $7,617
- Est. tax owed @ 24.0%
- −$1,828
- After-tax cash flow
- $6,130/yr
For passive investors: Depreciation is non-cash, so a rental often shows a tax loss while cash-flowing — sheltering income. Rental losses are passive: they offset passive income freely, and up to $25,000/yr can offset ordinary (W-2) income if you actively participate and your MAGI is under $100k (phasing out to $0 by $150k); unused losses carry forward. On sale, claimed depreciation is recaptured at up to 25%, and gains may owe capital-gains tax (a 1031 exchange can defer both). Figures are a year-1 estimate at your 24.0% rate — not tax advice; consult a CPA.
Schools (NCES district)
- District
- Springfield Local
- NCES district ID
- 3904822
- Math proficiency
- 47% ▼ -17.00%
- Reading proficiency
- 57% ▼ -11.00%
- Median HH income
- $54,807
- Composite
- 44.87/100
- National rank
- #2719
- State rank
- #404 of 656 in OH
Livability — Holland
- Score
- 80/100
- State rank
- #110
- US rank
- #1661
Category grades
Schools grade is shown separately in the Schools card above.
Census & demographics
- County
- Lucas County · 380,724 people
- City population
- 16,207
- Metro
- Toledo, OH
- Population (ZIP)
- 40,146
- Household income
- $57,713
- Rent vs Own
- Severe rent burden
- 1683.0
Population outlook (Lucas County) Hauer SSP2
- Today (2025)
- 420,751 people
- By 2030
- 410,187 · -2.5%
- By 2040
- 384,019 · -8.7%
- By 2050
- 355,125 · -15.6%
- By 2075
- 291,683 · -30.7%
- By 2100
- 233,670 · -44.5%
Race, ethnicity, and origin ACS 2023
- Neighborhood character
- Majority White (62%)
- Race & ethnicity
- White 62% Black 26% Two or more races 6% Hispanic / Latino 4% Asian 3%
- Common ancestry
- Romanian 7% Lithuanian 3% Slovak 2%
- Foreign-born
- 5% · China, Canada
- Languages at home
- 93% English-only · Arabic 2% Spanish 1% Chinese 1%
Political lean MEDSL · Lucas
- 2024 margin
- D (+12.6) · D 55.8% · R 43.2%
- 2008→2024 swing
- -18.9pp toward R · 2008: 31.4pp · 2024: 12.6pp
- All cycles
- 2024: D+12.6 2020: D+16.8 2016: D+17.4 2012: D+30.4 2008: D+31.4
Not yet ingested
- Civics
- —
Market trends
- HPI YoY
- ▼ -96.44%
- Current HPI
- 205.95
- Rent YoY
- ▲ 2.59%
- Metro
- Toledo, OH
- State GDP YoY
- ▲ 1.98%
- F500 in state
- 48
Industry mix (Fortune 500 HQ in OH)
| Industry | F500 HQs | Revenue |
|---|---|---|
| Insurance | 3 | $145B |
|
||
| Industrial Machinery | 3 | $49B |
|
||
| Financial Services | 3 | $24B |
|
||
| Consumer Goods | 2 | $93B |
|
||
| Aerospace / Defense | 2 | $47B |
|
||
| Utilities | 2 | $33B |
|
||
Cash-flow waterfall
monthlySold comps — $/sqft
last 12 mo · ≤1 miLoading sold comps…