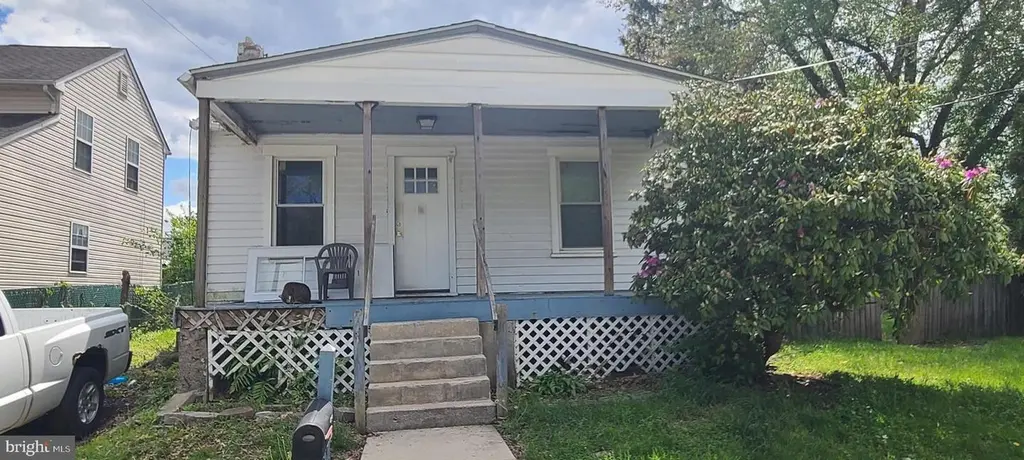
407 5th St · New Castle, DE
Flood risk 1/10 · Minimal
- FEMA flood zone
- X (unshaded)
- Chance of flooding over 30 yrs
- 0.0%
- Est. flood insurance / yr
- $473 – $860
Fire risk 2/10 · Minimal
- Est. fire insurance / yr
- $476 – $884
Heat risk 8/10 · Major
- Hot days now (above 102°F)
- 7 days/yr
- Hot days in 30 yrs
- 15 days/yr
Wind risk 6/10 · Moderate
- Chance of severe wind over 30 yrs
- 27.0%
Air-quality risk 3/10 · Minor
- Unhealthy air days now
- 3 days/yr
- Unhealthy air days in 30 yrs
- 5 days/yr
Risk factors via First Street. Map © Google.
Why this score? — see what drove the B- grade
The composite is a weighted blend of 9 inputs, each scored 0–100. Each bar is that input's sub-score; the figure is the points it added to the 100-point composite (weight × sub-score).
- Cash flow +30.0/30.0
- 1% rule +10.0/10.0
- DSCR +10.0/10.0
- ARV discount +7.5/15.0
- Livability +3.6/5.0
- Rent growth +2.5/5.0
- Condition / age +2.5/5.0
- Schools +2.1/10.0
- Appreciation +0.0/10.0
$146,000
🖨 Deal sheet 📄 Offer letter ✓ Due diligence
Listing remarks
Attention investors, builders and rehabbers. Estate sale being sold strictly AS-IS, WHERE-IS, with no repairs, credits, or concessions to be made by the Seller. The existing dwelling is in severe disrepair and will require a complete renovation or may be best suited for demolition and redevelopment, subject to the buyer's own due diligence and any required municipal approvals. The property is not considered a typical owner-occupant opportunity and is best suited for experienced investors seeking their next project. Value is primarily in the land and redevelopment potential. Due to the condition of the home, cash offers or other non-traditional financing are strongly preferred. The Estate ha
Key facts
- 8,000 sq ft lot
- Built 1938
- Listed 3 days
Property features AI
Exterior
- Parking: Driveway; Off-street parking
- Utilities: Public water; Private sewer; Electric service available; Natural gas available
- Home design: Detached structure
- Construction: Wood siding and vinyl siding; Asphalt roof; Poured concrete foundation; Built according to assessor records
- Exterior features: Front yard, rear yard and side yards; Deck(s); Porch(es); Street lights; Wood and chain link fencing
Interior
- Kitchen: Cooktop; Microwave; Single oven; Refrigerator
- Bedrooms: Two main-level bedrooms; One bedroom on the upper level
- Flooring: Carpet
- Bathrooms: Three full bathrooms (one on main level, one on upper level, one on lower level)
- Heating & cooling: Central air conditioning (electric); Central heating; Electric baseboard heat; Hot water heated by natural gas
- Interior features: Attic; Ceiling fans; Family room off the kitchen; Master bathroom; Recessed lighting; Drywall walls and ceilings
- Laundry & utility: Laundry in the basement
Neighborhood map
What this means for you Summary
Snapshot
- This is a 4-bed/1.0-bath single-family listed at $146k.
Deal economics
- At list price, monthly cash flow is $827 ($10k/yr) — positive.
- The deal already cash-flows at list — no discount required.
- Meets the 1% rule at list price ($2k rent vs $146k).
- Cap rate 13.1% vs local median 4.7% in New Castle — top-decile yield for the area; either an underpriced asset or a hidden risk that comps aren't pricing in. Stress-test before assuming the spread holds.
Location & tenants
- Location reads 72/100 on livability (#13 in DE) — a middle-class / working-renter tenant base. Strengths: employment A+, housing A+, cost of living A; Watch: schools D, crime F, commute F.
- Colonial School District (suburban): math 15% / reading 30% proficiency, ranked #23 of 26 in DE (top 88%) — low school quality limits family demand, transient renter base, plan for 1-2y turnover.
- Market conditions: 141 active listings in the ZIP; 1 comparable units currently listed for rent nearby; solid renter incomes; 1,367 units permitted in New Castle County in 2024 (201 in 5+ unit buildings).
- This rent runs 37% of the median local income ($75k/yr) — at the standard rent-burdened threshold; future hikes will face affordability resistance.
Forward outlook
- Local home prices are declining (-3.0%/yr); year-one equity from $1k of loan paydown is wiped out by about $4k of value loss. Plan a longer hold.
- New Castle County population projected at +9% by 2050 — modest demand growth; plan on rents tracking national, not racing it.
- At projected returns (-3.0% appreciation + 3.0% rent growth), your $41k cash investment doubles in ~5 years — after that, you're playing with house money.
Negotiation context
- Only 3 days on market — expect competitive offers; lowballing is unlikely to land.
- 2 sale attempts since 29y ago with the ask held roughly flat each time — persistent listings suggest the price (not the market) is what's stuck; bring a comps-based counter.
- Current owner paid $40k; list at $146k implies a 265% gain — meaningful room to come down on a strong offer.
Risks & watch-outs
- Watch-outs: built in 1938 — expect roof / HVAC / electrical / plumbing capex.
- Climate carrying-cost: major wind risk, 27% chance of damaging wind over 30y; extreme-heat days projected 7→15/yr by 2055 (HVAC capex compounding) — expect insurance premiums to compound above CPI over the hold.
Questions for the listing agent
- Built in 1938 — when were the roof, HVAC, electrical panel, plumbing, and water heater last replaced?
- Is there a deadline driving the sale (1031 exchange, divorce, estate, relocation)? That informs how much negotiation room exists.
- Schools are D-rated, which usually means shorter tenancies and higher turnover. Who's the typical renter profile here, and what's been the actual vacancy rate?
- Crime grade is F in this area — have there been break-ins, vandalism, or insurance claims at this property in the last 3 years? What carrier currently insures it and at what premium?
- What's the average days-on-market for RENTAL listings here right now (not sales)? A rising rental-DOM trend means longer vacancies and softer asking-rent achievability than the comps imply.
- What's the recent tenant-quality profile in this submarket — average credit score on applications, eviction rate, late-payment / NSF rate, and stable-employment percentage? A property-management company in the area should have these aggregated.
- How much new for-sale + rental construction is in the pipeline within 1–3 miles? Heavy new supply typically softens prices + rents 12–24 months out; constrained supply supports both.
Investment metrics
- 1% rule
- 1.59% ✓
- Cap rate
- 13.09%
- Cash-on-cash
- 24.27%
- DSCR
- 2.08
- GRM
- 5.2
CMA / ARV
- ARV (on-the-fly)
- $354,600
- Comps found
- 12
Show comp detail 12 sales within ~0.75 mi
| Address | Dist | Beds/Ba | Sqft | Sold | Price | $/sf | Match |
|---|---|---|---|---|---|---|---|
| 406 West Ave | 0.12mi | 4/1.0 | 1,825 (+1%) | 10mo | $300,000 | $164 | 83 |
| 408 10th St | 0.21mi | 3/1.5 (-1) | 1,775 (-1%) | 11mo | $359,000 | $202 | 72 |
| 800 East Ave | 0.14mi | 3/1.0 (-1) | 1,675 (-7%) | 7mo | $299,900 | $179 | 71 |
| 408 East Ave | 0.07mi | 3/2.5 (-1) | 1,725 (-4%) | 11mo | $380,000 | $220 | 70 |
| 204 East Ave | 0.17mi | 3/2.5 (-1) | 1,700 (-6%) | 7mo | $370,000 | $218 | 66 |
| 409 10th St | 0.23mi | 3/2.5 (-1) | 1,750 (-3%) | 11mo | $365,000 | $209 | 64 |
| 203 East Ave | 0.15mi | 3/3.0 (-1) | 1,600 (-11%) | 8mo | $365,000 | $228 | 55 |
| 406 10th St | 0.20mi | 3/2.5 (-1) | 1,950 (+8%) | 13mo | $369,900 | $190 | 55 |
| 402 Third St | 0.12mi | 3/2.5 (-1) | 1,950 (+8%) | 22mo | $375,000 | $192 | 51 |
| 303 4th St | 0.11mi | 3/1.5 (-1) | 1,600 (-11%) | 23mo | $280,000 | $175 | 51 |
| 21 Cahalan Rd | 0.36mi | 3/1.0 (-1) | 1,900 (+6%) | 22mo | $203,000 | $107 | 50 |
| 31 Memorial Dr | 0.60mi | 3/2.5 (-1) | 2,031 (+13%) | 2mo | $399,900 | $197 | 38 |
Match score weights: distance 35% · size 25% · config 20% · recency 20%. Top-matched comps best support the ARV.
Projected returns pro-forma
-3.0% appreciation · 3.0% rent growth · sell at horizon
- IRR
- 17.6%
- Equity multiple
- 1.71×
- Total profit
- $29,040
- Equity at exit
- $21,769
- IRR
- 26.1%
- Equity multiple
- 3.28×
- Total profit
- $93,242
- Equity at exit
- $12,623
Cash invested: $40,880 (down + closing). Projections, not guarantees.
Landlord ↔ Tenant lean methodology
- Overall (STATE)
- 70 Landlord-Friendly
- State Delaware
- 70 Landlord-Friendly · D+7
- County
- — inherits STATE
- City
- — inherits STATE
ZIP-level market 19720
- Active inventory
- 141
- Price-to-rent
- 5.2×
Monthly cashflow live
- Estimated rent
- $2,324 medium interval (Pro) →
- Mortgage (P&I)
- −$766
- Tax est. 1.5%
- −$182 /mo · $2,190/yr
- Insurance
- −$61
- HOA
- −$0
- Vacancy / Maint / Mgmt
- −$488
- Net cashflow
- $827
Break-even live
UW: 25.0% down · 7.5% · 30yr · 1.5% tax · 5.0% vac · 8.0% maint · 8.0% mgmt
Financing live
Cash to close
- Down payment
- $36,500
- Closing costs
- $4,380
- Reserves months
- —
- Total cash needed
- —
Loan-product check · same deal, 3 products live
Conventional
25% down · 7.5% · 30yr
- Down + closing
- —
- Monthly P&I
- —
- Monthly cashflow
- —
- DSCR
- —
- Eligible?
- —
Personal DTI + credit; lowest rate.
DSCR
20% down · 8.5% · 30yr
- Down + closing
- —
- Monthly P&I
- —
- Monthly cashflow
- —
- DSCR
- —
- Eligible?
- —
No personal income docs; deal must DSCR.
Hard money
10% down · 12.0% · 12mo
- Down + closing
- —
- Monthly P&I
- —
- Monthly cashflow
- —
- DSCR
- —
- Eligible?
- —
Short-term bridge; refi at stabilization.
Rent comps 1 comps
| Address | Beds | Baths | Sqft | Rent | $/sqft | DOM | Units | Dist |
|---|---|---|---|---|---|---|---|---|
| 13 Arbutus Ave Unit 1 New Castle, DE | 3.0 | 2.0 | 1600 | $2,650 | $1.66 | 18d | 1 | 1.35mi |
Listing history 3 events
-
2026-06-13statusdays on market $146,000 Pending 3 DOM
-
2026-06-10remarks 699-char remark
-
2026-06-10$146,000 Active 1 DOM
ⓘ Source: listings_history table (triggers on properties + properties_extension) + one-shot
backfill from property_details.listing_events for pre-trigger history.
Climate risk First Street
- Flood 1/10 Low FEMA zone X (unshaded) · 0% chance over 30 yrs
- Wildfire 2/10 Low
- Heat 8/10 Severe 7 d/yr ≥102°F today · 15 d/yr by 30 yrs out
- Wind 6/10 Major 27% chance of damaging wind over 30 yrs
- Air quality 3/10 Moderate 3 unhealthy d/yr today · 5 by 30 yrs out
Nearby sold comps map
Loading sold comps map…
Walkable amenities ~0.75 mi
Loading nearby amenities…
Taxation est. · year 1
- Rental income
- $27,886
- − Mortgage interest
- −$8,178
- − Property taxes
- −$2,190
- − Insurance
- −$730
- − Repairs & maintenance
- −$2,231
- − Management
- −$2,231
- − Depreciation
- −$4,247
- Taxable income
- $8,079
- Est. tax owed @ 24.0%
- −$1,939
- After-tax cash flow
- $7,983/yr
For passive investors: Depreciation is non-cash, so a rental often shows a tax loss while cash-flowing — sheltering income. Rental losses are passive: they offset passive income freely, and up to $25,000/yr can offset ordinary (W-2) income if you actively participate and your MAGI is under $100k (phasing out to $0 by $150k); unused losses carry forward. On sale, claimed depreciation is recaptured at up to 25%, and gains may owe capital-gains tax (a 1031 exchange can defer both). Figures are a year-1 estimate at your 24.0% rate — not tax advice; consult a CPA.
Schools (NCES district)
- District
- Colonial School District
- NCES district ID
- 1000230
- Math proficiency
- 15% ▼ -10.00%
- Reading proficiency
- 30% ▼ -9.00%
- Median HH income
- $58,622
- Composite
- 20.75/100
- National rank
- #8517
- State rank
- #23 of 26 in DE
Livability — New Castle
- Score
- 72/100
- State rank
- #13
- US rank
- #5905
Category grades
Schools grade is shown separately in the Schools card above.
Census & demographics
- County
- New Castle County · 483,412 people
- City population
- 62,392
- Metro
- Philadelphia-Camden-Wilmington, PA-NJ-DE-MD
- Population (ZIP)
- 62,392
- Household income
- $75,403
- Rent vs Own
- Severe rent burden
- 1852.0
Population outlook (New Castle County) Hauer SSP2
- Today (2025)
- 594,686 people
- By 2030
- 609,164 · +2.4%
- By 2040
- 632,154 · +6.3%
- By 2050
- 649,068 · +9.1%
- By 2075
- 687,771 · +15.7%
- By 2100
- 694,961 · +16.9%
Race, ethnicity, and origin ACS 2023
- Neighborhood character
- Diverse neighborhood (Simpson 0.67)
- Race & ethnicity
- Black 42% White 35% Hispanic / Latino 17% Two or more races 7% Asian 2%
- Hispanic origin (detail)
- Mexican 9% Puerto Rican 6% Dominican 2%
- Common ancestry
- Romanian 4% Lithuanian 1% Swedish 1%
- Foreign-born
- 12% · Canada
- Languages at home
- 82% English-only · Spanish 13% French/Haitian/Cajun 1% Other Indo-European 1%
Political lean MEDSL · New Castle
- 2024 margin
- Solid D (+32.6) · D 65.5% · R 32.9% · Other 1.6%
- 2008→2024 swing
- -8.1pp toward R · 2008: 40.6pp · 2024: 32.6pp
- All cycles
- 2024: D+32.6 2020: D+37.1 2016: D+29.6 2012: D+34.1 2008: D+40.6
Not yet ingested
- Civics
- —
Market trends
- HPI YoY
- ▼ -261.00%
- Current HPI
- 255.0404
- Rent YoY
- —
- Metro
- Philadelphia-Camden-Wilmington, PA-NJ-DE-MD
- State GDP YoY
- —
- F500 in state
- 0
Price history
+265.0% since first listed4 events — show timeline
- 2026-06-09 Listed $146,000 BRIGHT MLS
- 1997-03-13 Listing Removed — BRIGHT MLS
- 1997-03-13 Listed $85,000 BRIGHT MLS
- 1986-03-01 Sold (Public Records) $40,000 Public Records
Property tax history
+3.1%/yrLatest (2024): $29 · -0.1% YoY. Source: county tax records.
Cash-flow waterfall
monthlySold comps — $/sqft
last 12 mo · ≤1 miLoading sold comps…