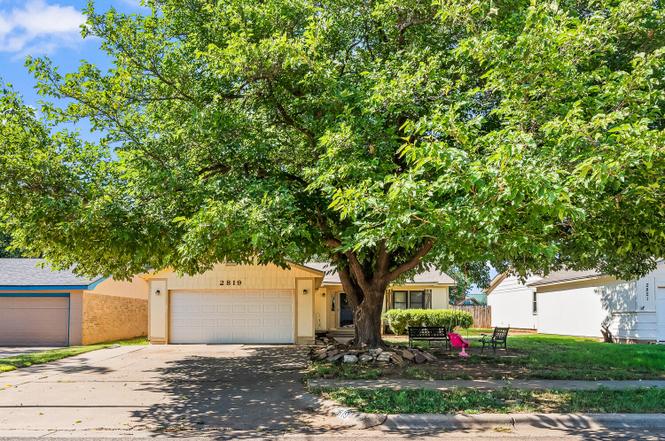
2819 91st St · Lubbock, TX
Flood risk 1/10 · Minimal
- FEMA flood zone
- X (unshaded)
- Chance of flooding over 30 yrs
- 0.0%
- Est. flood insurance / yr
- $507 – $1,088
Fire risk 1/10 · Minimal
- Est. fire insurance / yr
- $1,222 – $2,270
Heat risk 5/10 · Moderate
- Hot days now (above 99°F)
- 7 days/yr
- Hot days in 30 yrs
- 21 days/yr
Wind risk 2/10 · Minimal
- Chance of severe wind over 30 yrs
- —
Air-quality risk 2/10 · Minimal
- Unhealthy air days now
- 1 days/yr
- Unhealthy air days in 30 yrs
- 1 days/yr
Risk factors via First Street. Map © Google.
Why this score? — see what drove the C grade
The composite is a weighted blend of 9 inputs, each scored 0–100. Each bar is that input's sub-score; the figure is the points it added to the 100-point composite (weight × sub-score).
- Cash flow +24.6/30.0
- DSCR +7.9/10.0
- ARV discount +7.5/15.0
- 1% rule +6.8/10.0
- Livability +4.0/5.0
- Schools +3.1/10.0
- Rent growth +3.0/5.0
- Condition / age +2.5/5.0
- Appreciation +0.0/10.0
$125,000
🖨 Deal sheet 📄 Offer letter ✓ Due diligence
Listing remarks MLS
Do not miss out on this beautiful 3/2/2 located in University Pines. The neighborhood is very well kept and this one has so much curb appeal with a huge shade tree in front. MANY UPDATES - new stove being installed on Saturday, freshly painted as well and brand new carpet just installed this weekend. . Additionally, the AC is running through the attic to the inside of the home which is better than the original concept that many of the homes have in this area and it was just serviced this weekend as well. This home is truly immaculate inside and out and a must see for all. Price is set at $144,950.00 . ..
Key facts
- Large backyard
- Functional layout
- Quiet neighborhood
Tags
Neighborhood map
What this means for you Summary
Snapshot
- This is a 3-bed/2.0-bath single-family listed at $125k.
Deal economics
- At list price, monthly cash flow is $257 ($3k/yr) — positive.
- The deal already cash-flows at list — no discount required.
- Meets the 1% rule at list price ($1k rent vs $125k).
- Recommended offer: $110k (12.0% below list) — sets the bar for market timing.
Location & tenants
- Location reads 80/100 on livability (#37 in TX, #1,749 nationally) — a professional / high-income tenant draw. Strengths: commute A+, cost of living A+, housing A+; Watch: employment C-, crime F.
- Lubbock ISD (urban): math 36% / reading 39% proficiency, ranked #481 of 826 in TX (top 58%) — families likely to look elsewhere, expect single-tenant / working-renter base with shorter leases; 60% free/reduced lunch — lower-income household profile, screen leases tightly.
- Zoned schools: Waters El (math 41% / reading 42%, grade F, #1,437 of 4,322 statewide, top 34%, 507 students, 71% FRL); Evans Middle (math 34% / reading 43%, grade F, #704 of 1,662 statewide, top 43%, 799 students, 58% FRL); Monterey H S (math 28% / reading 37%, grade F, #1,029 of 1,632 statewide, top 64%, 2,114 students, 72% FRL).
- Market conditions: Rents rising (+2.1%/yr); 663 active listings in the ZIP; 40 comparable units currently listed for rent nearby; rentals at typical pace (median 22d on market — plan ~3-4 weeks tenant-placement turnaround); 42% of comp listings sitting > 30 days — soft ceiling on asking rent; solid renter incomes; 2,219 units permitted in Lubbock County in 2024 (252 in 5+ unit buildings).
Forward outlook
- Local home prices are declining (-3.0%/yr); year-one equity from $864 of loan paydown is wiped out by about $4k of value loss. Plan a longer hold.
- Lubbock County population projected at +39% by 2050 — long-run rental-demand tailwind backs the buy-and-hold thesis.
Negotiation context
- It's been on market 280 days — a 12% lower offer ($110k) is reasonable based on typical stale-listing flexibility.
- 3 sale attempts since 5y ago; this cycle's ask has dropped $45k (26%) from the opening price — seller is motivated, your offer sets the floor, not the list.
Risks & watch-outs
- Climate carrying-cost: extreme-heat days projected 7→21/yr by 2055 (HVAC capex compounding) — expect insurance premiums to compound above CPI over the hold.
Questions for the listing agent
- It's been on market 280 days. Have you received any prior offers? Is the seller open to a 12% concession, seller financing, or rate buy-down credit?
- Built in 1978 — when were the roof, HVAC, electrical panel, plumbing, and water heater last replaced?
- Why hasn't it sold? Are there any deal-killer items the seller is aware of (foundation, flood, title, zoning, code violations)?
- Is there a deadline driving the sale (1031 exchange, divorce, estate, relocation)? That informs how much negotiation room exists.
- Schools are D-rated, which usually means shorter tenancies and higher turnover. Who's the typical renter profile here, and what's been the actual vacancy rate?
- Crime grade is F in this area — have there been break-ins, vandalism, or insurance claims at this property in the last 3 years? What carrier currently insures it and at what premium?
- What's the average days-on-market for RENTAL listings here right now (not sales)? A rising rental-DOM trend means longer vacancies and softer asking-rent achievability than the comps imply.
- What's the recent tenant-quality profile in this submarket — average credit score on applications, eviction rate, late-payment / NSF rate, and stable-employment percentage? A property-management company in the area should have these aggregated.
- How much new for-sale + rental construction is in the pipeline within 1–3 miles? Heavy new supply typically softens prices + rents 12–24 months out; constrained supply supports both.
Investment metrics
- 1% rule
- 1.18% ✓
- Cap rate
- 8.76%
- Cash-on-cash
- 8.83%
- DSCR
- 1.39
- GRM
- 7.0
CMA / ARV
No comps found within radius.
Projected returns pro-forma
-3.0% appreciation · 2.13% rent growth · sell at horizon
- IRR
- -3.9%
- Equity multiple
- 0.85×
- Total profit
- $-5,089
- Equity at exit
- $18,638
- IRR
- 4.7%
- Equity multiple
- 1.33×
- Total profit
- $11,719
- Equity at exit
- $10,808
Cash invested: $35,000 (down + closing). Projections, not guarantees.
Landlord ↔ Tenant lean methodology
- Overall (STATE)
- 87 Strongly Landlord-Friendly
- State Texas
- 87 Strongly Landlord-Friendly · R+5
- County
- — inherits STATE
- City
- — inherits STATE
ZIP-level market 79423
- Rents YoY
- 2.1%
- Active inventory
- 663
- Price-to-rent
- 7.0×
Monthly cashflow live
- Estimated rent
- $1,478 high interval (Pro) →
- Mortgage (P&I)
- −$656
- Tax from tax record
- −$202 /mo · $2,427/yr
- Insurance
- −$52
- HOA
- −$0
- Vacancy / Maint / Mgmt
- −$310
- Net cashflow
- $257
Break-even live
UW: 25.0% down · 7.5% · 30yr · 1.5% tax · 5.0% vac · 8.0% maint · 8.0% mgmt
Financing live
Cash to close
- Down payment
- $31,250
- Closing costs
- $3,750
- Reserves months
- —
- Total cash needed
- —
Loan-product check · same deal, 3 products live
Conventional
25% down · 7.5% · 30yr
- Down + closing
- —
- Monthly P&I
- —
- Monthly cashflow
- —
- DSCR
- —
- Eligible?
- —
Personal DTI + credit; lowest rate.
DSCR
20% down · 8.5% · 30yr
- Down + closing
- —
- Monthly P&I
- —
- Monthly cashflow
- —
- DSCR
- —
- Eligible?
- —
No personal income docs; deal must DSCR.
Hard money
10% down · 12.0% · 12mo
- Down + closing
- —
- Monthly P&I
- —
- Monthly cashflow
- —
- DSCR
- —
- Eligible?
- —
Short-term bridge; refi at stabilization.
Rent comps 40 comps
| Address | Beds | Baths | Sqft | Rent | $/sqft | DOM | Units | Dist |
|---|---|---|---|---|---|---|---|---|
| 2415 93rd St Lubbock, TX | 3.0 | 2.0 | 1692 | $1,650 | $0.98 | 21d | 1 | 0.40mi |
| 8219 Elkridge Ave Lubbock, TX | 3.0 | 2.0 | 1405 | $1,475 | $1.05 | 44d | 1 | 0.50mi |
| 3101 99th St Unit 1 Lubbock, TX | 3.0 | 2.0 | 1694 | $1,350 | $0.80 | 44d | 1 | 0.52mi |
| 8216 Elkridge Ave Lubbock, TX | 3.0 | 2.0 | 1412 | $1,550 | $1.10 | 21d | 1 | 0.54mi |
| 9001 Indiana Ave Unit C Lubbock, TX | 2.0 | 1.0 | 1100 | $699 | $0.64 | 44d | 1 | 0.58mi |
| 2403 87th St Unit B Lubbock, TX | 3.0 | 2.0 | 1158 | $1,300 | $1.12 | 14d | 1 | 0.60mi |
| 2401 87th St Unit A Lubbock, TX | 3.0 | 2.0 | 1000 | $1,125 | $1.12 | 14d | 1 | 0.62mi |
| 2218 88th St Lubbock, TX | 3.0 | 2.0 | 1311 | $1,450 | $1.11 | 44d | 1 | 0.67mi |
| 2612 81st St Unit B Lubbock, TX | 2.0 | 2.0 | 1150 | $1,100 | $0.96 | 44d | 1 | 0.71mi |
| 2204 93rd St Lubbock, TX | 3.0 | 2.0 | 1258 | $1,325 | $1.05 | 14d | 1 | 0.75mi |
| 2303 84th St Lubbock, TX | 3.0 | 1.5 | 1128 | $1,100 | $0.98 | 21d | 1 | 0.81mi |
| 8606 Avenue V Unit V Lubbock, TX | 2.0 | 2.0 | 1025 | $1,075 | $1.05 | 44d | 1 | 0.82mi |
| 9715 Joliet Ave Lubbock, TX | 2.0 | 2.0 | 1589 | $1,400 | $0.88 | 44d | 1 | 0.84mi |
| 8604 Jordan Dr Lubbock, TX | 3.0 | 2.0 | 1855 | $1,900 | $1.02 | 44d | 1 | 0.86mi |
| 8214 Vernon Ave Unit B Lubbock, TX | 2.0 | 1.0 | 928 | $1,100 | $1.19 | 21d | 1 | 0.86mi |
| 9803 Avenue V Unit A Lubbock, TX | 3.0 | 2.0 | 1500 | $1,500 | $1.00 | 21d | 1 | 0.89mi |
| 3417 83rd Dr Lubbock, TX | 3.0 | 2.0 | 1642 | $1,650 | $1.00 | 21d | 1 | 0.91mi |
| 9702 Avenue U Lubbock, TX | 3.0 | 2.0 | 1265 | $1,195 | $0.94 | 44d | 1 | 0.93mi |
| 2909 106th St Lubbock, TX | 4.0 | 2.0 | 1646 | $1,750 | $1.06 | 21d | 1 | 0.93mi |
| 9803 Uvalde Ave Unit A Lubbock, TX | 2.0 | 2.0 | 1474 | $1,425 | $0.97 | 14d | 1 | 0.94mi |
| 3311 79th St Lubbock, TX | 2.0 | 1.0 | 1391 | $1,249 | $0.90 | 44d | 1 | 0.98mi |
| 2530 107th Dr Lubbock, TX | 3.0 | 2.0 | 1265 | $1,449 | $1.15 | 44d | 1 | 0.98mi |
| 8601 Memphis Dr Unit A 8 Lubbock, TX | 2.0 | 1.5 | 1069 | $1,150 | $1.08 | 44d | 1 | 1.00mi |
| 9818 Jordan Ave Unit B Lubbock, TX | 3.0 | 2.0 | 1497 | $1,500 | $1.00 | 44d | 1 | 1.00mi |
| 3107 75th St Unit B Lubbock, TX | 2.0 | 2.0 | 1400 | $1,250 | $0.89 | 21d | 1 | 1.05mi |
| 2022 102nd St Unit B Lubbock, TX | 3.0 | 2.0 | 1500 | $1,550 | $1.03 | 14d | 1 | 1.09mi |
| 8217 Avenue U Lubbock, TX | 1.0–2.0 | 1.0–2.0 | 873 | $1,570 | $1.80 | 14d | 28 | 1.10mi |
| 2011 100th St Lubbock, TX | 4.0 | 2.0 | 1698 | $1,750 | $1.03 | 14d | 1 | 1.12mi |
| 10317 Vernon Dr Lubbock, TX | 3.0 | 2.0 | 1786 | $2,800 | $1.57 | 21d | 1 | 1.14mi |
| 7414 Elgin Ave Lubbock, TX | 1.0–2.0 | 1.0 | 708 | $995 | $1.41 | 14d | 16 | 1.15mi |
| 3102 110th St Unit B Lubbock, TX | 3.0 | 2.0 | 1200 | $1,250 | $1.04 | 21d | 1 | 1.15mi |
| 3106 110th St Lubbock, TX | 3.0 | 2.0 | 1151 | $1,275 | $1.11 | 14d | 1 | 1.16mi |
| 2523 110th St Lubbock, TX | 3.0 | 2.0 | 1127 | $1,500 | $1.33 | 44d | 1 | 1.16mi |
| 3203 109th St Unit B Lubbock, TX | 3.0 | 2.0 | 1400 | $1,300 | $0.93 | 44d | 1 | 1.16mi |
| 3108 110th St Lubbock, TX | 3.0 | 2.0 | 1231 | $1,325 | $1.08 | 21d | 1 | 1.16mi |
| 3101 110th St Unit A Lubbock, TX | 3.0 | 2.0 | 1193 | $1,225 | $1.03 | 21d | 1 | 1.18mi |
| 2518 111th St Lubbock, TX | 3.0 | 2.0 | 1400 | $1,450 | $1.04 | 21d | 1 | 1.18mi |
| 8108 Sherman Ave Lubbock, TX | 3.0 | 2.0 | 1306 | $1,400 | $1.07 | 44d | 1 | 1.20mi |
| 3108 111th St Unit A Lubbock, TX | 3.0 | 2.0 | 1400 | $1,300 | $0.93 | 44d | 1 | 1.21mi |
| 3203 110th St Unit B Lubbock, TX | 3.0 | 2.0 | 1191 | $1,350 | $1.13 | 21d | 1 | 1.22mi |
Listing history 16 events
-
2026-04-24status Pending
-
2026-04-21price $125,000
-
2026-03-18price $134,000
-
2026-01-06status Active
-
2026-01-01historical
-
2025-08-11price $160,000
-
2025-07-14$170,000 Active
-
2021-10-11soldstatus
-
2021-10-08soldstatus 611-char remark
Show marketing remark (611 chars)
Do not miss out on this beautiful 3/2/2 located in University Pines. The neighborhood is very well kept and this one has so much curb appeal with a huge shade tree in front. MANY UPDATES - new stove being installed on Saturday, freshly painted as well and brand new carpet just installed this weekend. . Additionally, the AC is running through the attic to the inside of the home which is better than the original concept that many of the homes have in this area and it was just serviced this weekend as well. This home is truly immaculate inside and out and a must see for all. Price is set at $144,950.00 . ..
-
2021-08-16$144,950 611-char remark
Show marketing remark (611 chars)
Do not miss out on this beautiful 3/2/2 located in University Pines. The neighborhood is very well kept and this one has so much curb appeal with a huge shade tree in front. MANY UPDATES - new stove being installed on Saturday, freshly painted as well and brand new carpet just installed this weekend. . Additionally, the AC is running through the attic to the inside of the home which is better than the original concept that many of the homes have in this area and it was just serviced this weekend as well. This home is truly immaculate inside and out and a must see for all. Price is set at $144,950.00 . ..
-
2017-11-03soldstatus
-
2017-11-03soldstatus
-
2016-10-31soldstatus
-
2010-08-16soldstatus
-
1998-05-18soldstatus
-
1986-09-01soldstatus
ⓘ Source: listings_history table (triggers on properties + properties_extension) + one-shot
backfill from property_details.listing_events for pre-trigger history.
Tax reassessment forecast TX · Resets to sale price
- Current annual tax
- $2,427 · $202/mo
- Projected year-2 tax
- $2,427 · $202/mo
- Expected delta
- $0/yr ($0/mo · 0.0%)
ⓘ Screening estimate from a state-policy table — verify with the county assessor before closing.
Climate risk First Street
- Flood 1/10 Low FEMA zone X (unshaded) · 0% chance over 30 yrs
- Wildfire 1/10 Low
- Heat 5/10 Major 7 d/yr ≥99°F today · 21 d/yr by 30 yrs out
- Wind 2/10 Low
- Air quality 2/10 Low 1 unhealthy d/yr today · 1 by 30 yrs out
Nearby sold comps map
Loading sold comps map…
Walkable amenities ~0.75 mi
Loading nearby amenities…
Taxation est. · year 1
- Rental income
- $17,731
- − Mortgage interest
- −$7,002
- − Property taxes
- −$2,427
- − Insurance
- −$625
- − Repairs & maintenance
- −$1,419
- − Management
- −$1,419
- − Depreciation
- −$3,636
- Taxable income
- $1,204
- Est. tax owed @ 24.0%
- −$289
- After-tax cash flow
- $2,801/yr
For passive investors: Depreciation is non-cash, so a rental often shows a tax loss while cash-flowing — sheltering income. Rental losses are passive: they offset passive income freely, and up to $25,000/yr can offset ordinary (W-2) income if you actively participate and your MAGI is under $100k (phasing out to $0 by $150k); unused losses carry forward. On sale, claimed depreciation is recaptured at up to 25%, and gains may owe capital-gains tax (a 1031 exchange can defer both). Figures are a year-1 estimate at your 24.0% rate — not tax advice; consult a CPA.
Schools (NCES district)
- District
- Lubbock ISD
- NCES district ID
- 4828500
- Math proficiency
- 36% ▼ -8.00%
- Reading proficiency
- 39% ▼ -1.00%
- Median HH income
- $39,820
- Composite
- 31.44/100
- National rank
- #5984
- State rank
- #481 of 826 in TX
Livability — Lubbock
- Score
- 80/100
- State rank
- #37
- US rank
- #1749
Category grades
Schools grade is shown separately in the Schools card above.
Census & demographics
- Census place
- Lubbock, TX
- County
- Lubbock County · 293,542 people
- City population
- 283,030
- Metro
- Lubbock, TX
- Population (ZIP)
- 46,998
- Household income
- $84,933
- Rent vs Own
- Severe rent burden
- 1385.0
Population outlook (Lubbock County) Hauer SSP2
- Today (2025)
- 345,960 people
- By 2030
- 371,449 · +7.4%
- By 2040
- 424,539 · +22.7%
- By 2050
- 481,150 · +39.1%
- By 2075
- 633,467 · +83.1%
- By 2100
- 746,853 · +115.9%
Race, ethnicity, and origin ACS 2023
- Neighborhood character
- Majority White (61%)
- Race & ethnicity
- White 61% Hispanic / Latino 31% Two or more races 15% Black 4% Asian 2%
- Hispanic origin (detail)
- Mexican 26%
- Common ancestry
- Slovak 1% Italian 1% Serbian 1%
- Foreign-born
- 5% · Canada
- Languages at home
- 84% English-only · Spanish 13% Tagalog/Filipino 1% Other Asian/Pacific 1%
Political lean MEDSL · Lubbock
- 2024 margin
- Solid R (+39.5) · D 29.7% · R 69.2% · Other 1.0%
- 2008→2024 swing
- -2.8pp toward R · 2008: -36.7pp · 2024: -39.5pp
- All cycles
- 2024: R+39.5 2020: R+32.2 2016: R+38.4 2012: R+40.9 2008: R+36.7
Not yet ingested
- Civics
- —
Market trends
- HPI YoY
- ▼ -155.00%
- Current HPI
- 213.6491
- Rent YoY
- ▲ 2.13%
- Metro
- Lubbock, TX
- State GDP YoY
- ▲ 3.95%
- F500 in state
- 110
Industry mix (Fortune 500 HQ in TX)
| Industry | F500 HQs | Revenue |
|---|---|---|
| Energy | 16 | $1,198B |
|
||
| Technology | 5 | $198B |
|
||
| Engineering / Construction | 4 | $72B |
|
||
| Energy Services | 3 | $60B |
|
||
| Utilities | 3 | $41B |
|
||
| Healthcare | 2 | $330B |
|
||
Price history
-13.8% since first listed16 events — show timeline
- 2026-04-24 Pending — LARMLS
- 2026-04-21 Price Changed $125,000 LARMLS
- 2026-03-18 Price Changed $134,000 LARMLS
- 2026-01-06 Relisted — LARMLS
- 2026-01-01 Delisted — LARMLS
- 2025-08-11 Price Changed $160,000 LARMLS
- 2025-07-14 Listed $170,000 LARMLS
- 2021-10-11 Sold (Public Records) — Public Records
- 2021-10-08 Sold (MLS) — LARMLS
- 2021-08-16 Listed $144,950 LARMLS
- 2017-11-03 Sold (Public Records) — Public Records
- 2017-11-03 Sold (Public Records) — Public Records
- 2016-10-31 Sold (Public Records) — Public Records
- 2010-08-16 Sold (Public Records) — Public Records
- 1998-05-18 Sold (Public Records) — Public Records
- 1986-09-01 Sold (Public Records) — Public Records
Property tax history
+3.7%/yrLatest (2025): $2,427 · -6.6% YoY. Source: county tax records.
Cash-flow waterfall
monthlySold comps — $/sqft
last 12 mo · ≤1 miLoading sold comps…