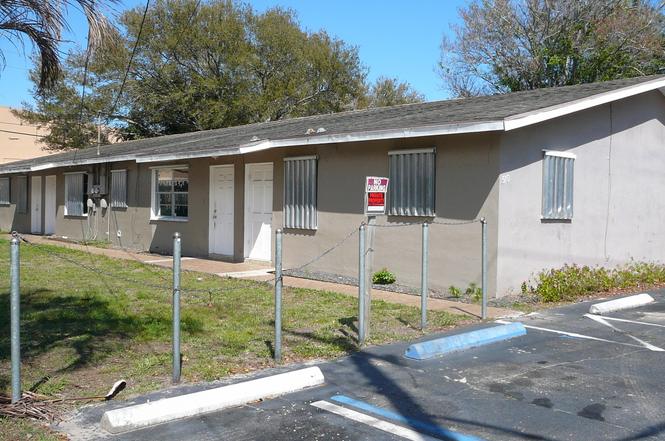
 Duplex
510 Gardenia Ave · Fort Pierce, FL
Flood risk 6/10 · Moderate
- FEMA flood zone
- X (unshaded)
- Chance of flooding over 30 yrs
- 0.69%
- Est. flood insurance / yr
- $507 – $1,088
Fire risk 1/10 · Minimal
- Est. fire insurance / yr
- $947 – $1,759
Heat risk 10/10 · Severe
- Hot days now (above 106°F)
- 7 days/yr
- Hot days in 30 yrs
- 27 days/yr
Wind risk 10/10 · Severe
- Chance of severe wind over 30 yrs
- 99.0%
Air-quality risk 2/10 · Minimal
- Unhealthy air days now
- 1 days/yr
- Unhealthy air days in 30 yrs
- 1 days/yr
Risk factors via First Street. Map © Google.
Why this score? — see what drove the C+ grade
The composite is a weighted blend of 9 inputs, each scored 0–100. Each bar is that input's sub-score; the figure is the points it added to the 100-point composite (weight × sub-score).
- Cash flow +24.3/30.0
- DSCR +7.8/10.0
- ARV discount +7.5/15.0
- 1% rule +6.1/10.0
- Rent growth +4.4/5.0
- Livability +3.8/5.0
- Schools +3.7/10.0
- Condition / age +2.5/5.0
- Appreciation +0.0/10.0
$350,000
🖨 Deal sheet 📄 Offer letter ✓ Due diligence
Multi-family units
County records classify this as Multi-Family (2-4 Unit). Listing-text estimate: 2 units. confirmed
Listing remarks
HUGE CBS DUPLEX ZONED GENERAL COMMERCIAL WHICH IS A LEGAL NON CONFORMING USE WITH NEARLY 3000 SF OF LIVING TOTAL. 3 BEDROOMS, 2 BATHROOMS EACH SIDE. EACH UNIT HAS A MASTER BEDROOM WITH WALK-IN CLOSET, LARGE EAT IN KITCHEN, LIVING ROOM, LAUNDRY ROOM, AND A SEPARATE ENTRANCE TO A BEDROOM. IDEALLY LOCATED, ADJACENT TO THE SOUTH OF PUBLIX PLAZA AND BEHIND WELLS FARGO BANK, JUST SECONDS TO SHOPPING, RESTAURANTS AND BANKS. POTENTIAL GROSS INCOME $48,000 PER YEAR! BOTH UNITS ARE VACANT SO FINISHING TOUCHES CAN BE MADE IMMEDIATELY TO GENERATE OPTIMUM INCOME. THIS IS PRICED TO SELL QUICKLY! SINCE IT IS A LEGAL NON-CONFORMING USE, NO FINANCING CONTINGENCIES WILL BE CONSIDERED.
Key facts
- 7,753 sq ft lot
- Built 1974
- Listed 30 days
Neighborhood map
What this means for you Summary
Snapshot
- This is a 2 × 3-bed/1.0-bath units multifamily listed at $350k.
Deal economics
- At list price, monthly cash flow is $705 ($8k/yr) — positive. Per door: $353/mo.
- The deal already cash-flows at list — no discount required.
- Meets the 1% rule at list price ($4k rent vs $350k).
- Recommended offer: $345k (1.5% below list) — sets the bar for market timing.
- Cap rate 8.7% vs local median 3.7% in Fort Pierce — top-decile yield for the area; either an underpriced asset or a hidden risk that comps aren't pricing in. Stress-test before assuming the spread holds.
Location & tenants
- Location reads 76/100 on livability (#226 in FL, #3,360 nationally) — a middle-class / working-renter tenant base. Strengths: commute A+, cost of living A+, housing A+; Watch: crime D+, amenities F, employment F.
- St. Lucie (urban): math 40% / reading 48% proficiency, ranked #51 of 73 in FL (top 70%) — families likely to look elsewhere, expect single-tenant / working-renter base with shorter leases.
- Zoned schools: Weatherbee Elementary School (math 32% / reading 32%, grade F, #1,797 of 2,144 statewide, top 86%, 672 students, 90% FRL); Dan Mccarty Middle School (math 23% / reading 23%, grade F, #542 of 571 statewide, top 95%, 747 students, 88% FRL); Fort Pierce Central High School (math 15% / reading 45%, grade F, #441 of 667 statewide, top 67%, 3,091 students, 62% FRL) — zoned schools average 80% FRL vs 59% district-wide (21 pts higher); higher-poverty schools than district average — tighter screening recommended.
- Zoned-school proficiency averages 28% at this address vs 44% district-wide (-16 pts) — the specific schools serving this property underperform the St. Lucie average; the district grade overstates school quality for this exact location.
- Market conditions: Rents rising fast (+7.4%/yr); 336 active listings in the ZIP; 4,868 units permitted in St. Lucie County in 2024 (268 in 5+ unit buildings).
- At $3,885/mo this rent would consume 86% of the median local household income ($54k/yr) (locally 1086% of renters already pay >50% of income on rent) — very limited rent-growth headroom before tenants either downsize or default.
Forward outlook
- Local home prices are declining (-3.0%/yr); year-one equity from $2k of loan paydown is wiped out by about $10k of value loss. Plan a longer hold.
- St. Lucie County population projected at +20% by 2050 — long-run rental-demand tailwind backs the buy-and-hold thesis.
- At projected returns (-3.0% appreciation + 7.4% rent growth), your $98k cash investment doubles in ~8 years — after that, you're playing with house money.
Negotiation context
- It's been on market 30 days — a 2% lower offer ($345k) is reasonable based on typical stale-listing flexibility.
- Current owner paid $70k; list at $350k implies a 400% gain — meaningful room to come down on a strong offer.
Risks & watch-outs
- Climate carrying-cost: major flood risk; severe wind risk, 99% chance of damaging wind over 30y; extreme-heat days projected 7→27/yr by 2055 (HVAC capex compounding) — expect insurance premiums to compound above CPI over the hold.
Questions for the listing agent
- Can we see the unit-by-unit rent roll, current vacancy, and any below-market leases? What's the average tenancy length?
- What capital expenditures (roof, boiler, parking lot, exteriors) have been made in the last 5 years, and what's planned in the next 2?
- Built in 1974 — when were the roof, HVAC, electrical panel, plumbing, and water heater last replaced?
- Is there a deadline driving the sale (1031 exchange, divorce, estate, relocation)? That informs how much negotiation room exists.
- Schools are D-rated, which usually means shorter tenancies and higher turnover. Who's the typical renter profile here, and what's been the actual vacancy rate?
- Crime grade is D in this area — have there been break-ins, vandalism, or insurance claims at this property in the last 3 years? What carrier currently insures it and at what premium?
- What's the average days-on-market for RENTAL listings here right now (not sales)? A rising rental-DOM trend means longer vacancies and softer asking-rent achievability than the comps imply.
- What's the recent tenant-quality profile in this submarket — average credit score on applications, eviction rate, late-payment / NSF rate, and stable-employment percentage? A property-management company in the area should have these aggregated.
- How much new apartment / multifamily construction is in the pipeline within 1–3 miles? Heavy new supply (>2% of stock underway) typically softens rents 12–24 months out; light construction supports rent growth.
Investment metrics
- 1% rule
- 1.11% ✓
- Cap rate
- 8.71%
- Cash-on-cash
- 8.63%
- DSCR
- 1.38
- GRM
- 7.5
CMA / ARV
No comps found within radius.
Projected returns pro-forma
-3.0% appreciation · 7.42% rent growth · sell at horizon
- IRR
- 1.6%
- Equity multiple
- 1.06×
- Total profit
- $6,260
- Equity at exit
- $52,186
- IRR
- 15.1%
- Equity multiple
- 2.47×
- Total profit
- $144,511
- Equity at exit
- $30,262
Cash invested: $98,000 (down + closing). Projections, not guarantees.
Landlord ↔ Tenant lean methodology
- Overall (STATE)
- 87 Strongly Landlord-Friendly
- State Florida
- 87 Strongly Landlord-Friendly · R+3
- County
- — inherits STATE
- City
- — inherits STATE
ZIP-level market 34982
- Home prices YoY
- -33.4%
- Rents YoY
- 7.4%
- Active inventory
- 336
- Price-to-rent
- 15.0×
Monthly cashflow live
- Estimated rent
- $3,885 high interval (Pro) →
- Mortgage (P&I)
- −$1,835
- Tax from tax record
- −$383 /mo · $4,594/yr
- Insurance
- −$146
- HOA
- −$0
- Vacancy / Maint / Mgmt
- −$816
- Net cashflow
- $705
Break-even live
2-unit breakdown (identical units grouped — click to expand)
| Units | Beds | Baths | Est. rent |
|---|---|---|---|
| 2× units | 3 | 1 | $3,884 |
| #1 | 3 | 1 | $1,942 |
| #2 | 3 | 1 | $1,942 |
| Total (2 units) | $3,885 | ||
UW: 25.0% down · 7.5% · 30yr · 1.5% tax · 5.0% vac · 8.0% maint · 8.0% mgmt
Financing live
Cash to close
- Down payment
- $87,500
- Closing costs
- $10,500
- Reserves months
- —
- Total cash needed
- —
Loan-product check · same deal, 3 products live
Conventional
25% down · 7.5% · 30yr
- Down + closing
- —
- Monthly P&I
- —
- Monthly cashflow
- —
- DSCR
- —
- Eligible?
- —
Personal DTI + credit; lowest rate.
DSCR
20% down · 8.5% · 30yr
- Down + closing
- —
- Monthly P&I
- —
- Monthly cashflow
- —
- DSCR
- —
- Eligible?
- —
No personal income docs; deal must DSCR.
Hard money
10% down · 12.0% · 12mo
- Down + closing
- —
- Monthly P&I
- —
- Monthly cashflow
- —
- DSCR
- —
- Eligible?
- —
Short-term bridge; refi at stabilization.
Listing history 23 events
-
2026-06-18days on market $350,000 Active 30 DOM
-
2026-06-17days on market $350,000 Active 29 DOM
-
2026-06-16days on market $350,000 Active 28 DOM
-
2026-06-15days on market $350,000 Active 27 DOM
-
2026-06-14days on market $350,000 Active 25 DOM
-
2026-06-13remarks 675-char remark
-
2026-06-13days on market $350,000 Active 24 DOM
-
2026-06-10pricedays on market $350,000 Active 22 DOM
-
2026-06-09days on market $425,000 Active 21 DOM
-
2026-06-08days on market $425,000 Active 20 DOM
-
2026-06-07days on market $425,000 Active 19 DOM
-
2026-06-05days on market $425,000 Active 16 DOM
-
2026-06-03days on market $425,000 Active 15 DOM
-
2026-06-02days on market $425,000 Active 14 DOM
-
2026-06-01days on market $425,000 Active 13 DOM
-
2026-05-31days on market $425,000 Active 12 DOM
-
2026-05-30statusdays on market $425,000 Active 11 DOM
-
2026-03-11status Pending
-
2026-03-09status Pending
-
2026-03-02$425,000 Active
-
2000-03-01soldstatus $70,000
-
1991-05-01soldstatus $65,000
-
1974-04-01soldstatus $57,500
ⓘ Source: listings_history table (triggers on properties + properties_extension) + one-shot
backfill from property_details.listing_events for pre-trigger history.
Tax reassessment forecast FL · Resets to sale price
- Current annual tax
- $4,594 · $383/mo
- Projected year-2 tax
- $4,594 · $383/mo
- Expected delta
- $0/yr ($0/mo · 0.0%)
ⓘ Screening estimate from a state-policy table — verify with the county assessor before closing.
Climate risk First Street
- Flood 6/10 Major FEMA zone X (unshaded) · 69% chance over 30 yrs
- Wildfire 1/10 Low
- Heat 10/10 Extreme 7 d/yr ≥106°F today · 27 d/yr by 30 yrs out
- Wind 10/10 Extreme 99% chance of damaging wind over 30 yrs
- Air quality 2/10 Low 1 unhealthy d/yr today · 1 by 30 yrs out
Nearby sold comps map
Loading sold comps map…
Walkable amenities ~0.75 mi
Loading nearby amenities…
Taxation est. · year 1
- Rental income
- $46,620
- − Mortgage interest
- −$19,605
- − Property taxes
- −$4,594
- − Insurance
- −$1,750
- − Repairs & maintenance
- −$3,730
- − Management
- −$3,730
- − Depreciation
- −$10,182
- Taxable income
- $3,029
- Est. tax owed @ 24.0%
- −$727
- After-tax cash flow
- $7,733/yr
For passive investors: Depreciation is non-cash, so a rental often shows a tax loss while cash-flowing — sheltering income. Rental losses are passive: they offset passive income freely, and up to $25,000/yr can offset ordinary (W-2) income if you actively participate and your MAGI is under $100k (phasing out to $0 by $150k); unused losses carry forward. On sale, claimed depreciation is recaptured at up to 25%, and gains may owe capital-gains tax (a 1031 exchange can defer both). Figures are a year-1 estimate at your 24.0% rate — not tax advice; consult a CPA.
Schools (NCES district)
- District
- St. Lucie
- NCES district ID
- 1201770
- Math proficiency
- 40% ▼ -11.00%
- Reading proficiency
- 48% ▼ -4.00%
- Median HH income
- $44,737
- Composite
- 37.28/100
- National rank
- #4449
- State rank
- #51 of 73 in FL
Livability — Fort Pierce
- Score
- 76/100
- State rank
- #226
- US rank
- #3360
Category grades
Schools grade is shown separately in the Schools card above.
Census & demographics
- Census place
- Fort Pierce, FL
- County
- Saint Lucie County · 337,150 people
- City population
- 78,556
- Metro
- Port St. Lucie, FL
- Population (ZIP)
- 31,143
- Household income
- $54,082
- Rent vs Own
- Severe rent burden
- 1086.0
Population outlook (St. Lucie County) Hauer SSP2
- Today (2025)
- 338,016 people
- By 2030
- 355,687 · +5.2%
- By 2040
- 385,521 · +14.1%
- By 2050
- 406,106 · +20.1%
- By 2075
- 441,054 · +30.5%
- By 2100
- 436,885 · +29.2%
Race, ethnicity, and origin ACS 2023
- Neighborhood character
- Majority White (62%)
- Race & ethnicity
- White 62% Hispanic / Latino 22% Two or more races 12% Black 12%
- Hispanic origin (detail)
- Mexican 10% Puerto Rican 3% Cuban 3%
- Common ancestry
- Italian 7% Hispanic 2% Lithuanian 1%
- Foreign-born
- 12% · Canada
- Languages at home
- 80% English-only · Spanish 16% French/Haitian/Cajun 3%
Political lean MEDSL · St. Lucie
- 2024 margin
- Lean R (+9.1) · D 45.1% · R 54.2%
- 2008→2024 swing
- -21.2pp toward R · 2008: 12.1pp · 2024: -9.1pp
- All cycles
- 2024: R+9.1 2020: R+1.6 2016: R+2.5 2012: D+7.9 2008: D+12.1
Not yet ingested
- Civics
- —
Market trends
- HPI YoY
- ▼ -199.47%
- Current HPI
- 397.2649
- Rent YoY
- ▲ 7.42%
- Metro
- Port St. Lucie, FL
- State GDP YoY
- ▲ 3.28%
- F500 in state
- 36
Industry mix (Fortune 500 HQ in FL)
| Industry | F500 HQs | Revenue |
|---|---|---|
| Industrial Technology | 2 | $29B |
|
||
| Insurance | 2 | $17B |
|
||
| Retail | 1 | $60B |
|
||
| Technology Distribution | 1 | $58B |
|
||
| Homebuilding | 1 | $35B |
|
||
| Technology Manufacturing | 1 | $35B |
|
||
Price history
+639.1% since first listed6 events — show timeline
- 2026-03-11 Pending — Beaches MLS
- 2026-03-09 Pending — Beaches MLS
- 2026-03-02 Listed $425,000 Beaches MLS
- 2000-03-01 Sold (Public Records) $70,000 Public Records
- 1991-05-01 Sold (Public Records) $65,000 Public Records
- 1974-04-01 Sold (Public Records) $57,500 Public Records
Property tax history
+14.4%/yrLatest (2025): $4,594 · +8.2% YoY. Source: county tax records.
Cash-flow waterfall
monthlySold comps — $/sqft
last 12 mo · ≤1 miLoading sold comps…