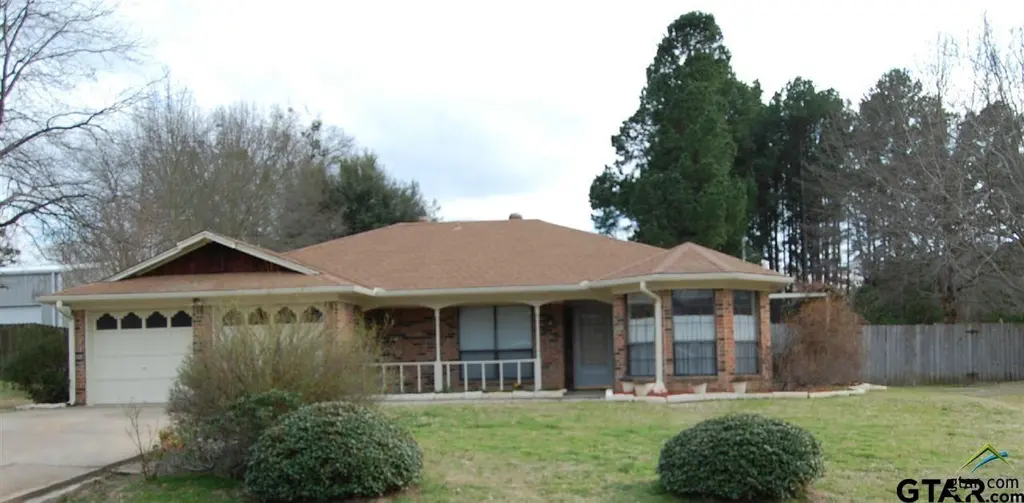
10585 Clear Cv · Tyler, TX
Flood risk 1/10 · Minimal
- FEMA flood zone
- X (unshaded)
- Chance of flooding over 30 yrs
- 0.0%
- Est. flood insurance / yr
- $507 – $1,088
Fire risk 4/10 · Minor
- Est. fire insurance / yr
- $1,222 – $2,270
Heat risk 7/10 · Major
- Hot days now (above 109°F)
- 7 days/yr
- Hot days in 30 yrs
- 26 days/yr
Wind risk 6/10 · Moderate
- Chance of severe wind over 30 yrs
- 62.0%
Air-quality risk 2/10 · Minimal
- Unhealthy air days now
- 0 days/yr
- Unhealthy air days in 30 yrs
- 1 days/yr
Risk factors via First Street. Map © Google.
Why this score? — see what drove the C- grade
The composite is a weighted blend of 9 inputs, each scored 0–100. Each bar is that input's sub-score; the figure is the points it added to the 100-point composite (weight × sub-score).
- Cash flow +20.6/30.0
- ARV discount +7.5/15.0
- DSCR +6.5/10.0
- 1% rule +5.6/10.0
- Livability +3.8/5.0
- Schools +3.3/10.0
- Condition / age +2.5/5.0
- Rent growth +2.0/5.0
- Appreciation +0.0/10.0
$190,000
🖨 Deal sheet 📄 Offer letter ✓ Due diligence
Listing remarks MLS
DEAL LOCATION! You will be instantly charmed by the inviting front porch and curb appeal of this home that is minutes from shopping, restaurants and entertainment. 3/2/2 with great floor plan & located on over sized lot. Spacious family room with high ceiling & wood burning fireplace with gas starter. Open and bright kitchen with neutral ceramic tile, pantry, breakfast bar & dining area with bay window. Nice master bedroom & bath with vanity, large walk in shower, & 2 walk-in closets. Large fenced back yard, patio, storage buildings. AC/Heat units new 2yrs. Roof about 4 yrs old. One owner since 1988. This home is move-in ready and truly a "MUST SEE". Jack, Hubbard, Robert E. Lee schools.
Key facts
- 0.44 acre lot
- 2 garage spots
- Built 1984
Neighborhood map
What this means for you Summary
Snapshot
- This is a 3-bed/2.0-bath single-family listed at $190k.
Deal economics
- At list price, monthly cash flow is $254 ($3k/yr) — positive.
- The deal already cash-flows at list — no discount required.
- Meets the 1% rule at list price ($2k rent vs $190k).
- Cap rate 7.9% vs local median 3.6% in Tyler — top-decile yield for the area; either an underpriced asset or a hidden risk that comps aren't pricing in. Stress-test before assuming the spread holds.
Location & tenants
- Location reads 75/100 on livability (#147 in TX, #4,181 nationally) — a middle-class / working-renter tenant base. Strengths: cost of living A+, housing A+, health & safety A+; Watch: employment C-, crime D+, commute F.
- Tyler ISD (urban): math 39% / reading 38% proficiency, ranked #449 of 826 in TX (top 54%) — families likely to look elsewhere, expect single-tenant / working-renter base with shorter leases; 66% free/reduced lunch — lower-income household profile, screen leases tightly.
- Zoned schools: Dr Bryan C Jack El (math 53% / reading 51%, grade C-, #742 of 4,322 statewide, top 19%, 685 students, 46% FRL); Three Lakes Middle (math 35% / reading 42%, grade F, #704 of 1,662 statewide, top 43%, 873 students, 64% FRL); Tyler Legacy H S (math 34% / reading 49%, grade F, #767 of 1,632 statewide, top 47%, 2,594 students, 58% FRL).
- Market conditions: Rents soft (-1.9%/yr); 649 active listings in the ZIP; 8 comparable units currently listed for rent nearby; rentals lingering (median 44d on market — plan ~5-8 weeks vacancy on turnover, expect pricing pressure); 75% of comp listings sitting > 30 days — soft ceiling on asking rent; solid renter incomes; 595 units permitted in Smith County in 2024 (45 in 5+ unit buildings).
- This rent runs 31% of the median local income ($79k/yr) — at the standard rent-burdened threshold; future hikes will face affordability resistance.
Forward outlook
- Local home prices are declining (-3.0%/yr); year-one equity from $1k of loan paydown is wiped out by about $6k of value loss. Plan a longer hold.
- Smith County population projected at +24% by 2050 — long-run rental-demand tailwind backs the buy-and-hold thesis.
Negotiation context
- Only 0 days on market — expect competitive offers; lowballing is unlikely to land.
- 2 sale attempts since 12y ago with the ask held roughly flat each time — persistent listings suggest the price (not the market) is what's stuck; bring a comps-based counter.
Risks & watch-outs
- Climate carrying-cost: major wind risk, 62% chance of damaging wind over 30y; extreme-heat days projected 7→26/yr by 2055 (HVAC capex compounding) — expect insurance premiums to compound above CPI over the hold.
Questions for the listing agent
- Is there a deadline driving the sale (1031 exchange, divorce, estate, relocation)? That informs how much negotiation room exists.
- Schools are D-rated, which usually means shorter tenancies and higher turnover. Who's the typical renter profile here, and what's been the actual vacancy rate?
- Crime grade is D in this area — have there been break-ins, vandalism, or insurance claims at this property in the last 3 years? What carrier currently insures it and at what premium?
- What's the average days-on-market for RENTAL listings here right now (not sales)? A rising rental-DOM trend means longer vacancies and softer asking-rent achievability than the comps imply.
- What's the recent tenant-quality profile in this submarket — average credit score on applications, eviction rate, late-payment / NSF rate, and stable-employment percentage? A property-management company in the area should have these aggregated.
- How much new for-sale + rental construction is in the pipeline within 1–3 miles? Heavy new supply typically softens prices + rents 12–24 months out; constrained supply supports both.
Investment metrics
- 1% rule
- 1.06% ✓
- Cap rate
- 7.90%
- Cash-on-cash
- 5.73%
- DSCR
- 1.25
- GRM
- 7.8
CMA / ARV
No comps found within radius.
Projected returns pro-forma
-3.0% appreciation · 0.0% rent growth · sell at horizon
- IRR
- -10.9%
- Equity multiple
- 0.61×
- Total profit
- $-20,491
- Equity at exit
- $28,330
- IRR
- -6.7%
- Equity multiple
- 0.63×
- Total profit
- $-19,718
- Equity at exit
- $16,428
Cash invested: $53,200 (down + closing). Projections, not guarantees.
Landlord ↔ Tenant lean methodology
- Overall (STATE)
- 87 Strongly Landlord-Friendly
- State Texas
- 87 Strongly Landlord-Friendly · R+5
- County
- — inherits STATE
- City
- — inherits STATE
ZIP-level market 75703
- Rents YoY
- -1.9%
- Active inventory
- 649
- Price-to-rent
- 7.8×
Monthly cashflow live
- Estimated rent
- $2,022 high interval (Pro) →
- Mortgage (P&I)
- −$996
- Tax from tax record
- −$268 /mo · $3,215/yr
- Insurance
- −$79
- HOA
- −$0
- Vacancy / Maint / Mgmt
- −$425
- Net cashflow
- $254
Break-even live
UW: 25.0% down · 7.5% · 30yr · 1.5% tax · 5.0% vac · 8.0% maint · 8.0% mgmt
Financing live
Cash to close
- Down payment
- $47,500
- Closing costs
- $5,700
- Reserves months
- —
- Total cash needed
- —
Loan-product check · same deal, 3 products live
Conventional
25% down · 7.5% · 30yr
- Down + closing
- —
- Monthly P&I
- —
- Monthly cashflow
- —
- DSCR
- —
- Eligible?
- —
Personal DTI + credit; lowest rate.
DSCR
20% down · 8.5% · 30yr
- Down + closing
- —
- Monthly P&I
- —
- Monthly cashflow
- —
- DSCR
- —
- Eligible?
- —
No personal income docs; deal must DSCR.
Hard money
10% down · 12.0% · 12mo
- Down + closing
- —
- Monthly P&I
- —
- Monthly cashflow
- —
- DSCR
- —
- Eligible?
- —
Short-term bridge; refi at stabilization.
Rent comps 8 comps
| Address | Beds | Baths | Sqft | Rent | $/sqft | DOM | Units | Dist |
|---|---|---|---|---|---|---|---|---|
| 16108 Echo Glen Dr Tyler, TX | 3.0 | 2.0 | 1225 | $1,795 | $1.47 | 43d | 1 | 0.47mi |
| 16104 Echo Glen Dr Unit 16104 Tyler, TX | 3.0 | 2.0 | 1199 | $1,690 | $1.41 | 43d | 1 | 0.48mi |
| 11086 County Road 167 Unit 11 Tyler, TX | 3.0 | 2.0 | 1495 | $1,900 | $1.27 | 43d | 1 | 0.56mi |
| 11201 County Road 166 Tyler, TX | 3.0 | 2.0 | 1635 | $2,595 | $1.59 | 43d | 1 | 0.73mi |
| 7352 Kingsport Ln Tyler, TX | 3.0 | 2.0 | 1875 | $4,500 | $2.40 | 13d | 1 | 0.86mi |
| 16744 Overland Stage Dr Tyler, TX | 3.0 | 2.0 | 1526 | $2,200 | $1.44 | 43d | 1 | 0.90mi |
| 1811 Spruce Pine Ln Tyler, TX | 3.0 | 2.0 | 1662 | $2,500 | $1.50 | 43d | 1 | 0.96mi |
| 1666 W Cumberland Rd Tyler, TX | 1.0–3.0 | 1.0–2.0 | 939 | $1,725 | $1.84 | 13d | 6 | 1.15mi |
Listing history 8 events
-
2026-05-08status Pending
-
2026-05-07historical
-
2026-05-07historical
-
2026-04-30$190,000
-
2014-03-18soldstatus
-
2014-03-14soldstatus 736-char remark
Show marketing remark (736 chars)
DEAL LOCATION! You will be instantly charmed by the inviting front porch and curb appeal of this home that is minutes from shopping, restaurants and entertainment. 3/2/2 with great floor plan & located on over sized lot. Spacious family room with high ceiling & wood burning fireplace with gas starter. Open and bright kitchen with neutral ceramic tile, pantry, breakfast bar & dining area with bay window. Nice master bedroom & bath with vanity, large walk in shower, & 2 walk-in closets. Large fenced back yard, patio, storage buildings. AC/Heat units new 2yrs. Roof about 4 yrs old. One owner since 1988. This home is move-in ready and truly a "MUST SEE". Jack, Hubbard, Robert E. Lee schools.
-
2014-02-21$124,000 736-char remark
Show marketing remark (736 chars)
DEAL LOCATION! You will be instantly charmed by the inviting front porch and curb appeal of this home that is minutes from shopping, restaurants and entertainment. 3/2/2 with great floor plan & located on over sized lot. Spacious family room with high ceiling & wood burning fireplace with gas starter. Open and bright kitchen with neutral ceramic tile, pantry, breakfast bar & dining area with bay window. Nice master bedroom & bath with vanity, large walk in shower, & 2 walk-in closets. Large fenced back yard, patio, storage buildings. AC/Heat units new 2yrs. Roof about 4 yrs old. One owner since 1988. This home is move-in ready and truly a "MUST SEE". Jack, Hubbard, Robert E. Lee schools.
-
1988-04-13soldstatus
ⓘ Source: listings_history table (triggers on properties + properties_extension) + one-shot
backfill from property_details.listing_events for pre-trigger history.
Tax reassessment forecast TX · Resets to sale price
- Current annual tax
- $3,215 · $268/mo
- Projected year-2 tax
- $3,477 · $290/mo
- Expected delta
- +$262/yr (+$22/mo · 8.2%)
ⓘ Screening estimate from a state-policy table — verify with the county assessor before closing.
Climate risk First Street
- Flood 1/10 Low FEMA zone X (unshaded) · 0% chance over 30 yrs
- Wildfire 4/10 Moderate
- Heat 7/10 Severe 7 d/yr ≥109°F today · 26 d/yr by 30 yrs out
- Wind 6/10 Major 62% chance of damaging wind over 30 yrs
- Air quality 2/10 Low 0 unhealthy d/yr today · 1 by 30 yrs out
Nearby sold comps map
Loading sold comps map…
Walkable amenities ~0.75 mi
Loading nearby amenities…
Taxation est. · year 1
- Rental income
- $24,264
- − Mortgage interest
- −$10,643
- − Property taxes
- −$3,215
- − Insurance
- −$950
- − Repairs & maintenance
- −$1,941
- − Management
- −$1,941
- − Depreciation
- −$5,527
- Taxable income
- $47
- Est. tax owed @ 24.0%
- −$11
- After-tax cash flow
- $3,036/yr
For passive investors: Depreciation is non-cash, so a rental often shows a tax loss while cash-flowing — sheltering income. Rental losses are passive: they offset passive income freely, and up to $25,000/yr can offset ordinary (W-2) income if you actively participate and your MAGI is under $100k (phasing out to $0 by $150k); unused losses carry forward. On sale, claimed depreciation is recaptured at up to 25%, and gains may owe capital-gains tax (a 1031 exchange can defer both). Figures are a year-1 estimate at your 24.0% rate — not tax advice; consult a CPA.
Schools (NCES district)
- District
- Tyler ISD
- NCES district ID
- 4843470
- Math proficiency
- 39% ▼ -4.00%
- Reading proficiency
- 38% ▼ -1.00%
- Median HH income
- $44,090
- Composite
- 32.69/100
- National rank
- #5650
- State rank
- #449 of 826 in TX
Livability — Tyler
- Score
- 75/100
- State rank
- #147
- US rank
- #4181
Category grades
Schools grade is shown separately in the Schools card above.
Census & demographics
- County
- Smith County · 180,570 people
- City population
- 127,842
- Metro
- Tyler, TX
- Population (ZIP)
- 46,039
- Household income
- $79,194
- Rent vs Own
- Severe rent burden
- 1585.0
Population outlook (Smith County) Hauer SSP2
- Today (2025)
- 248,890 people
- By 2030
- 261,665 · +5.1%
- By 2040
- 286,114 · +15.0%
- By 2050
- 308,006 · +23.8%
- By 2075
- 354,171 · +42.3%
- By 2100
- 372,828 · +49.8%
Race, ethnicity, and origin ACS 2023
- Neighborhood character
- Predominantly White (66%)
- Race & ethnicity
- White 66% Black 17% Hispanic / Latino 10% Two or more races 7% Asian 4%
- Hispanic origin (detail)
- Mexican 8%
- Common ancestry
- Slovak 3% Italian 2% Lithuanian 2%
- Foreign-born
- 7% · Canada, China, Vietnam
- Languages at home
- 89% English-only · Spanish 6% Other Indo-European 1% Tagalog/Filipino 1%
Political lean MEDSL · Smith
- 2024 margin
- Solid R (+45.1) · D 27.0% · R 72.1%
- 2008→2024 swing
- -5.6pp toward R · 2008: -39.5pp · 2024: -45.1pp
- All cycles
- 2024: R+45.1 2020: R+39.4 2016: R+43.9 2012: R+46.9 2008: R+39.5
Not yet ingested
- Civics
- —
Market trends
- HPI YoY
- ▼ -218.79%
- Current HPI
- 182.3842
- Rent YoY
- ▼ -1.95%
- Metro
- Tyler, TX
- State GDP YoY
- ▲ 3.95%
- F500 in state
- 110
Industry mix (Fortune 500 HQ in TX)
| Industry | F500 HQs | Revenue |
|---|---|---|
| Energy | 16 | $1,198B |
|
||
| Technology | 5 | $198B |
|
||
| Engineering / Construction | 4 | $72B |
|
||
| Energy Services | 3 | $60B |
|
||
| Utilities | 3 | $41B |
|
||
| Healthcare | 2 | $330B |
|
||
Price history
+53.2% since first listed8 events — show timeline
- 2026-05-08 Pending — GTAR
- 2026-05-07 Delisted — GTAR
- 2026-05-07 Delisted — GTAR
- 2026-04-30 Listed $190,000 GTAR
- 2014-03-18 Sold (Public Records) — Public Records
- 2014-03-14 Sold (MLS) — GTAR
- 2014-02-21 Listed $124,000 GTAR
- 1988-04-13 Sold (Public Records) — Public Records
Property tax history
+3.7%/yrLatest (2024): $3,215 · +13.8% YoY. Source: county tax records.
Cash-flow waterfall
monthlySold comps — $/sqft
last 12 mo · ≤1 miLoading sold comps…