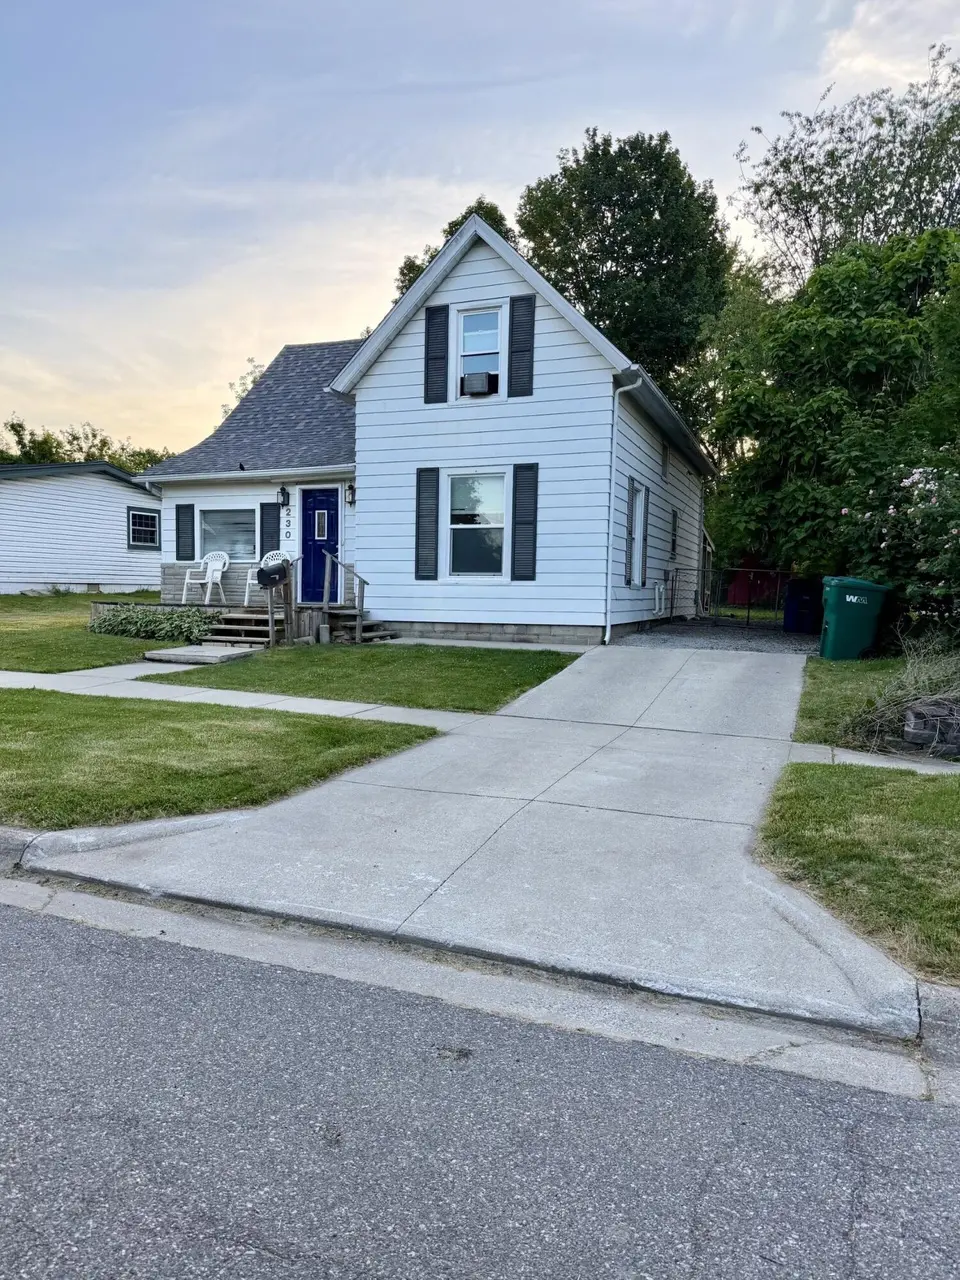
230 Cable St · La Porte, IN
Flood risk 6/10 · Moderate
- FEMA flood zone
- X (unshaded)
- Chance of flooding over 30 yrs
- 0.67%
- Est. flood insurance / yr
- $473 – $860
Fire risk 1/10 · Minimal
- Est. fire insurance / yr
- $717 – $1,331
Heat risk 2/10 · Minimal
- Hot days now (above 99°F)
- 7 days/yr
- Hot days in 30 yrs
- 15 days/yr
Wind risk 2/10 · Minimal
- Chance of severe wind over 30 yrs
- —
Air-quality risk 2/10 · Minimal
- Unhealthy air days now
- 2 days/yr
- Unhealthy air days in 30 yrs
- 2 days/yr
Risk factors via First Street. Map © Google.
Why this score? — see what drove the B grade
The composite is a weighted blend of 9 inputs, each scored 0–100. Each bar is that input's sub-score; the figure is the points it added to the 100-point composite (weight × sub-score).
- Cash flow +30.0/30.0
- ARV discount +13.3/15.0
- DSCR +10.0/10.0
- 1% rule +9.0/10.0
- Livability +3.7/5.0
- Schools +3.5/10.0
- Rent growth +2.5/5.0
- Condition / age +2.5/5.0
- Appreciation +0.0/10.0
$155,000
🖨 Deal sheet 📄 Offer letter ✓ Due diligence
Listing remarks MLS
Unfinished SF: 420, Annual Maint Incl: None (Assessor), Interior Features: Formal Dining Room, Main Floor Bathroom
Key facts
- Off street parking
- Nice sized yard
- Large living room
Tags
Property features AI
Finance
- Other: Vacant at time of listing
Exterior
- Parking: No designated parking
- Security: No security features listed
- Utilities: Electricity connected (100 amp service); Natural gas connected; Public water; Public sewer
- Home design: Two-level home; Built in 1925
- Construction: Aluminum siding; Shingle roof; Has basement (unfinished)
- Exterior features: Rear porch; City view; Shed(s)
Interior
- Kitchen: Gas range; Refrigerator
- Bedrooms: Primary bedroom; Bedroom 2; Bedroom 3
- Flooring: Carpet; Vinyl
- Bathrooms: 1 full bathroom
- Heating & cooling: Forced air heating; No cooling system
- Interior features: Main-level laundry; Unfinished basement; No other interior-specific features listed
- Laundry & utility: Washer; Dryer; Laundry on main level
Neighborhood map
What this means for you Summary
Snapshot
- This is a 3-bed/1.0-bath single-family listed at $155k.
Deal economics
- At list price, monthly cash flow is $730 ($9k/yr) — positive.
- The deal already cash-flows at list — no discount required.
- Meets the 1% rule at list price ($2k rent vs $155k).
- Cap rate 11.9% vs local median 3.7% in La Porte — top-decile yield for the area; either an underpriced asset or a hidden risk that comps aren't pricing in. Stress-test before assuming the spread holds.
Location & tenants
- Location reads 74/100 on livability (#81 in IN, #4,852 nationally) — a middle-class / working-renter tenant base. Strengths: amenities A+, cost of living A+, housing A+; Watch: commute F, employment F.
- Laporte Community School Corporation (urban): math 37% / reading 44% proficiency, ranked #139 of 301 in IN (top 46%) — families likely to look elsewhere, expect single-tenant / working-renter base with shorter leases.
- Zoned schools: Hailmann Elementary School (math 42% / reading 42%, grade F, #434 of 994 statewide, top 48%, 343 students, 74% FRL); Laporte Middle School (math 27% / reading 42%, grade F, #167 of 330 statewide, top 52%, 941 students, 61% FRL) — zoned schools average 67% FRL vs 44% district-wide (23 pts higher); higher-poverty schools than district average — tighter screening recommended.
- Market conditions: 260 active listings in the ZIP; 3 comparable units currently listed for rent nearby; rentals lingering (median 44d on market — plan ~5-8 weeks vacancy on turnover, expect pricing pressure); 100% of comp listings sitting > 30 days — soft ceiling on asking rent; 216 units permitted in LaPorte County in 2024 (75 in 5+ unit buildings).
- This rent runs 35% of the median local income ($74k/yr) — at the standard rent-burdened threshold; future hikes will face affordability resistance.
Forward outlook
- Local home prices are declining (-3.0%/yr); year-one equity from $1k of loan paydown is wiped out by about $5k of value loss. Plan a longer hold.
- LaPorte County population projected to shrink 7% by 2050 — rents likely to lag national; underwrite the cash flow, not the appreciation.
- At projected returns (-3.0% appreciation + 3.0% rent growth), your $43k cash investment doubles in ~7 years — after that, you're playing with house money.
Negotiation context
- Only 6 days on market — expect competitive offers; lowballing is unlikely to land.
- 3 sale attempts since 11y ago with the ask held roughly flat each time — persistent listings suggest the price (not the market) is what's stuck; bring a comps-based counter.
- Current owner paid $28k; list at $155k implies a 464% gain — meaningful room to come down on a strong offer.
Risks & watch-outs
- Watch-outs: built in 1925 — expect roof / HVAC / electrical / plumbing capex.
- Climate carrying-cost: major flood risk — expect insurance premiums to compound above CPI over the hold.
Questions for the listing agent
- Built in 1925 — when were the roof, HVAC, electrical panel, plumbing, and water heater last replaced?
- Is there a deadline driving the sale (1031 exchange, divorce, estate, relocation)? That informs how much negotiation room exists.
- What's the average days-on-market for RENTAL listings here right now (not sales)? A rising rental-DOM trend means longer vacancies and softer asking-rent achievability than the comps imply.
- What's the recent tenant-quality profile in this submarket — average credit score on applications, eviction rate, late-payment / NSF rate, and stable-employment percentage? A property-management company in the area should have these aggregated.
- How much new for-sale + rental construction is in the pipeline within 1–3 miles? Heavy new supply typically softens prices + rents 12–24 months out; constrained supply supports both.
Investment metrics
- 1% rule
- 1.40% ✓
- Cap rate
- 11.94%
- Cash-on-cash
- 20.18%
- DSCR
- 1.90
- GRM
- 5.9
CMA / ARV
- ARV (on-the-fly)
- $178,155
- Comps found
- 12
Show comp detail 12 sales within ~0.75 mi
| Address | Dist | Beds/Ba | Sqft | Sold | Price | $/sf | Match |
|---|---|---|---|---|---|---|---|
| 506 Park St | 0.21mi | 3/1.0 | 1,548 (-4%) | 12mo | $103,000 | $67 | 74 |
| 506 Pulaski St | 0.27mi | 3/1.5 | 1,740 (+8%) | 5mo | $240,000 | $138 | 67 |
| 40 Toronto St | 0.31mi | 4/1.0 (+1) | 1,560 (-3%) | 12mo | $145,000 | $93 | 66 |
| 204 Jefferson Ave | 0.67mi | 3/1.5 | 1,556 (-3%) | 2mo | $120,000 | $77 | 60 |
| 311 Niles St | 0.70mi | 3/2.0 | 1,600 (-0%) | 10mo | $253,900 | $159 | 54 |
| 711 E Jefferson Ave | 0.63mi | 3/2.0 | 1,632 (+2%) | 11mo | $230,000 | $141 | 54 |
| 302 Bond St | 0.54mi | 3/1.5 | 1,777 (+11%) | 2mo | $165,000 | $93 | 54 |
| 333 Planett St | 0.58mi | 2/1.5 (-1) | 1,677 (+4%) | 11mo | $125,000 | $75 | 50 |
| 609 Niles St | 0.74mi | 2/1.0 (-1) | 1,470 (-8%) | 1mo | $52,000 | $35 | 46 |
| 305 Oberreich St | 0.55mi | 3/1.5 | 1,378 (-14%) | 8mo | $203,000 | $147 | 42 |
| 511 E Lincolnway | 0.39mi | 4/2.0 (+1) | 1,809 (+13%) | 12mo | $199,900 | $111 | 41 |
| 214 Oberreich St | 0.51mi | 4/2.5 (+1) | 1,830 (+14%) | 11mo | $228,800 | $125 | 32 |
Match score weights: distance 35% · size 25% · config 20% · recency 20%. Top-matched comps best support the ARV.
Projected returns pro-forma
-3.0% appreciation · 3.0% rent growth · sell at horizon
- IRR
- 12.4%
- Equity multiple
- 1.49×
- Total profit
- $21,358
- Equity at exit
- $23,111
- IRR
- 21.3%
- Equity multiple
- 2.81×
- Total profit
- $78,391
- Equity at exit
- $13,402
Cash invested: $43,400 (down + closing). Projections, not guarantees.
Landlord ↔ Tenant lean methodology
- Overall (STATE)
- 90 Strongly Landlord-Friendly
- State Indiana
- 90 Strongly Landlord-Friendly · R+11
- County
- — inherits STATE
- City
- — inherits STATE
ZIP-level market 46350
- Active inventory
- 260
- Price-to-rent
- 5.9×
Monthly cashflow live
- Estimated rent
- $2,175 medium interval (Pro) →
- Mortgage (P&I)
- −$813
- Tax from tax record
- −$110 /mo · $1,326/yr
- Insurance
- −$65
- HOA
- −$0
- Vacancy / Maint / Mgmt
- −$457
- Net cashflow
- $730
Break-even live
UW: 25.0% down · 7.5% · 30yr · 1.5% tax · 5.0% vac · 8.0% maint · 8.0% mgmt
Financing live
Cash to close
- Down payment
- $38,750
- Closing costs
- $4,650
- Reserves months
- —
- Total cash needed
- —
Loan-product check · same deal, 3 products live
Conventional
25% down · 7.5% · 30yr
- Down + closing
- —
- Monthly P&I
- —
- Monthly cashflow
- —
- DSCR
- —
- Eligible?
- —
Personal DTI + credit; lowest rate.
DSCR
20% down · 8.5% · 30yr
- Down + closing
- —
- Monthly P&I
- —
- Monthly cashflow
- —
- DSCR
- —
- Eligible?
- —
No personal income docs; deal must DSCR.
Hard money
10% down · 12.0% · 12mo
- Down + closing
- —
- Monthly P&I
- —
- Monthly cashflow
- —
- DSCR
- —
- Eligible?
- —
Short-term bridge; refi at stabilization.
Rent comps 3 comps
| Address | Beds | Baths | Sqft | Rent | $/sqft | DOM | Units | Dist |
|---|---|---|---|---|---|---|---|---|
| 207 New York St La Porte, IN | 2.0 | 1.0 | 1600 | $3,200 | $2.00 | 43d | 1 | 0.49mi |
| 1105 Woodward St La Porte, IN | 3.0 | 1.0 | 1142 | $1,495 | $1.31 | 43d | 1 | 0.96mi |
| 400 Hiawatha Ave La Porte, IN | 1.0–2.0 | 1.0–1.5 | 909 | $1,204 | $1.32 | 43d | 2 | 1.46mi |
Listing history 6 events
-
2026-06-10status $155,000 Pending 6 DOM
-
2026-06-09days on market $155,000 Active 6 DOM
-
2026-06-08days on market $155,000 Active 5 DOM
-
2026-06-07days on market $155,000 Active 4 DOM
-
2026-06-05remarks 150-char remark
-
2026-06-05$155,000 Active 1 DOM
ⓘ Source: listings_history table (triggers on properties + properties_extension) + one-shot
backfill from property_details.listing_events for pre-trigger history.
Tax reassessment forecast IN · Partial reset (capped growth)
- Current annual tax
- $1,326 · $110/mo
- Projected year-2 tax
- $1,326 · $110/mo
- Expected delta
- $0/yr ($0/mo · 0.0%)
ⓘ Screening estimate from a state-policy table — verify with the county assessor before closing.
Climate risk First Street
- Flood 6/10 Major FEMA zone X (unshaded) · 67% chance over 30 yrs
- Wildfire 1/10 Low
- Heat 2/10 Low 7 d/yr ≥99°F today · 15 d/yr by 30 yrs out
- Wind 2/10 Low
- Air quality 2/10 Low 2 unhealthy d/yr today · 2 by 30 yrs out
Nearby sold comps map
Loading sold comps map…
Walkable amenities ~0.75 mi
Loading nearby amenities…
Taxation est. · year 1
- Rental income
- $26,095
- − Mortgage interest
- −$8,682
- − Property taxes
- −$1,326
- − Insurance
- −$775
- − Repairs & maintenance
- −$2,088
- − Management
- −$2,088
- − Depreciation
- −$4,509
- Taxable income
- $6,627
- Est. tax owed @ 24.0%
- −$1,590
- After-tax cash flow
- $7,169/yr
For passive investors: Depreciation is non-cash, so a rental often shows a tax loss while cash-flowing — sheltering income. Rental losses are passive: they offset passive income freely, and up to $25,000/yr can offset ordinary (W-2) income if you actively participate and your MAGI is under $100k (phasing out to $0 by $150k); unused losses carry forward. On sale, claimed depreciation is recaptured at up to 25%, and gains may owe capital-gains tax (a 1031 exchange can defer both). Figures are a year-1 estimate at your 24.0% rate — not tax advice; consult a CPA.
Schools (NCES district)
- District
- Laporte Community School Corporation
- NCES district ID
- 1805580
- Math proficiency
- 37% ▼ -13.00%
- Reading proficiency
- 44% ▼ -11.00%
- Median HH income
- $46,761
- Composite
- 34.58/100
- National rank
- #5162
- State rank
- #139 of 301 in IN
Livability — La Porte
- Score
- 74/100
- State rank
- #81
- US rank
- #4852
Category grades
Schools grade is shown separately in the Schools card above.
Census & demographics
- Census place
- La Porte, IN
- County
- La Porte County · 88,580 people
- City population
- 44,763
- Metro
- Michigan City-La Porte, IN
- Population (ZIP)
- 44,763
- Household income
- $74,307
- Rent vs Own
- Severe rent burden
- 835.0
Population outlook (LaPorte County) Hauer SSP2
- Today (2025)
- 109,757 people
- By 2030
- 108,288 · -1.3%
- By 2040
- 105,070 · -4.3%
- By 2050
- 102,330 · -6.8%
- By 2075
- 97,009 · -11.6%
- By 2100
- 86,459 · -21.2%
Race, ethnicity, and origin ACS 2023
- Neighborhood character
- Predominantly White (82%)
- Race & ethnicity
- White 82% Two or more races 8% Hispanic / Latino 8% Black 3%
- Hispanic origin (detail)
- Mexican 6%
- Common ancestry
- Romanian 11% Iranian 3% Italian 2%
- Foreign-born
- 4% · Canada
- Languages at home
- 93% English-only · Spanish 4% Russian/Polish/Slavic 1% German/W. Germanic 1%
Political lean MEDSL · LaPorte
- 2024 margin
- R (+14.1) · D 42.1% · R 56.2% · Other 1.7%
- 2008→2024 swing
- -19.1pp toward R · 2008: 5.0pp · 2024: -14.1pp
- All cycles
- 2024: R+14.1 2020: R+7.2 2016: R+6.4 2012: D+12.6 2008: D+5.0
Not yet ingested
- Civics
- —
Market trends
- HPI YoY
- ▼ -142.94%
- Current HPI
- 209.2564
- Rent YoY
- —
- Metro
- Michigan City-La Porte, IN
- State GDP YoY
- ▲ 2.90%
- F500 in state
- 18
Industry mix (Fortune 500 HQ in IN)
| Industry | F500 HQs | Revenue |
|---|---|---|
| Industrial Machinery | 2 | $37B |
|
||
| Healthcare | 1 | $177B |
|
||
| Pharmaceuticals | 1 | $45B |
|
||
| Metals / Steel | 1 | $18B |
|
||
| Agriculture | 1 | $17B |
|
||
| Packaging | 1 | $12B |
|
||
Price history
+455.6% since first listed5 events — show timeline
- 2026-06-03 Listed $155,000 NIRA MLS as Distributed by MLS Grid
- 2015-07-02 Sold (MLS) $27,500 IRMLS
- 2015-07-02 Sold (MLS) $27,500 NIRA MLS as Distributed by MLS Grid
- 2015-05-31 Listed $27,900 IRMLS
- 2015-05-31 Listed $27,900 NIRA MLS as Distributed by MLS Grid
Property tax history
-0.2%/yrLatest (2024): $1,326 · -0.7% YoY. Source: county tax records.
Cash-flow waterfall
monthlySold comps — $/sqft
last 12 mo · ≤1 miLoading sold comps…