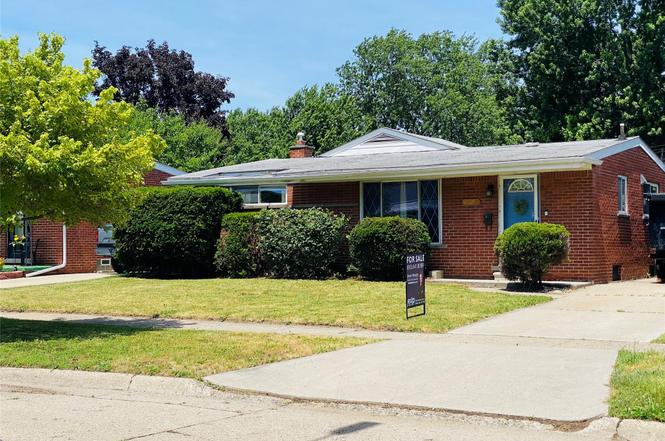
1545 Cynthia Ave · Madison Heights, MI
Flood risk 1/10 · Minimal
- FEMA flood zone
- X (unshaded)
- Chance of flooding over 30 yrs
- 0.0%
- Est. flood insurance / yr
- $473 – $860
Fire risk 1/10 · Minimal
- Est. fire insurance / yr
- $784 – $1,456
Heat risk 3/10 · Minor
- Hot days now (above 97°F)
- 7 days/yr
- Hot days in 30 yrs
- 15 days/yr
Wind risk 2/10 · Minimal
- Chance of severe wind over 30 yrs
- —
Air-quality risk 3/10 · Minor
- Unhealthy air days now
- 3 days/yr
- Unhealthy air days in 30 yrs
- 5 days/yr
Risk factors via First Street. Map © Google.
Why this score? — see what drove the D+ grade
The composite is a weighted blend of 9 inputs, each scored 0–100. Each bar is that input's sub-score; the figure is the points it added to the 100-point composite (weight × sub-score).
- Cash flow +13.4/30.0
- ARV discount +13.1/15.0
- DSCR +4.0/10.0
- Livability +4.0/5.0
- 1% rule +3.9/10.0
- Schools +3.3/10.0
- Rent growth +3.2/5.0
- Condition / age +2.5/5.0
- Appreciation +0.0/10.0
$259,900
🖨 Deal sheet 📄 Offer letter ✓ Due diligence
Listing remarks MLS
Some houses feel bigger than the square footage says. This is one of them. Step inside 1545 Cynthia and you'll immediately notice the vaulted ceilings, recessed lighting, and gorgeous hardwood floors that make the living room feel bright and inviting. The kitchen has a warm, welcoming feel with butcher block countertops, stainless appliances, and plenty of space for everything from weeknight dinners to holiday baking marathons. The primary suite gives you something that's surprisingly hard to find in this price range: your own private full bath. Add two more bedrooms, a second full bath, and a finished basement that's ready for movie nights, game days, a home gym, or that hobby you've been telling yourself you'll start someday. Outside, the large backyard and concrete patio create the perfect setting for summer cookouts, morning coffee, or letting the dog wear itself out while you pretend you're supervising. If you're looking for a home with character, usable space, and a location that puts you close to everything Madison Heights has to offer, this one deserves a spot at the top of your list.
Key facts
- Large backyard
- Finished basement
- Concrete patio
Tags
Property features AI
Exterior
- Parking: Detached 2-car garage; Paved access/road
- Utilities: Public water; Public sewer
- Home design: Single-family residence; One level (entry at ground level with steps); Brick construction
- Construction: Brick exterior; One story
- Exterior features: Front porch; Fenced backyard
Interior
- Kitchen: No specific kitchen appliance details provided
- Bedrooms: Total of 6 rooms (bedroom count not specified)
- Bathrooms: 2 full bathrooms
- Heating & cooling: Forced air heating (natural gas); Central air conditioning
- Interior features: Gas water heater; Finished basement with sump pump; Basement present
- Laundry & utility: No specific laundry appliances listed
Neighborhood map
What this means for you Summary
Snapshot
- This is a 3-bed/1.0-bath single-family listed at $260k.
Deal economics
- At list price, monthly cash flow is $6 ($68/yr) — positive.
- The deal already cash-flows at list — no discount required.
- To meet the 1% rule (rent ≥ 1% of price), the offer needs to be $232k (10.9% below list).
- Recommended offer: $232k (10.9% below list) — sets the bar for 1% rule.
Location & tenants
- Location reads 81/100 on livability (#62 in MI, #1,347 nationally) — a professional / high-income tenant draw. Strengths: commute A+, cost of living A+, housing A+; Watch: schools D+, health & safety D.
- Lamphere Public Schools (suburban): math 28% / reading 49% proficiency, ranked #235 of 540 in MI (top 44%) — families likely to look elsewhere, expect single-tenant / working-renter base with shorter leases.
- Market conditions: Rents rising (+2.8%/yr); 135 active listings in the ZIP; 9 comparable units currently listed for rent nearby; rentals leasing fast (median 10d on market — plan ~1-2 weeks tenant-placement turnaround); 2,614 units permitted in Oakland County in 2024 (721 in 5+ unit buildings).
- This rent runs 40% of the median local income ($70k/yr) — at the standard rent-burdened threshold; future hikes will face affordability resistance.
Forward outlook
- Local home prices are declining (-3.0%/yr); year-one equity from $2k of loan paydown is wiped out by about $8k of value loss. Plan a longer hold.
- Oakland County population projected at +10% by 2050 — modest demand growth; plan on rents tracking national, not racing it.
Negotiation context
- Only 7 days on market — expect competitive offers; lowballing is unlikely to land.
- 3 sale attempts since 29y ago with the ask held roughly flat each time — persistent listings suggest the price (not the market) is what's stuck; bring a comps-based counter.
- Current owner paid $134k; list at $260k implies a 94% gain — meaningful room to come down on a strong offer.
Risks & watch-outs
- Watch-outs: built in 1957 — expect roof / HVAC / electrical / plumbing capex.
Questions for the listing agent
- Built in 1957 — when were the roof, HVAC, electrical panel, plumbing, and water heater last replaced?
- Is there a deadline driving the sale (1031 exchange, divorce, estate, relocation)? That informs how much negotiation room exists.
- Schools are D-rated, which usually means shorter tenancies and higher turnover. Who's the typical renter profile here, and what's been the actual vacancy rate?
- The area grade is low — what's the realistic commute time and amenity access for the typical tenant pool here? Any planned neighborhood developments (good or bad) we should know about?
- What's the average days-on-market for RENTAL listings here right now (not sales)? A rising rental-DOM trend means longer vacancies and softer asking-rent achievability than the comps imply.
- What's the recent tenant-quality profile in this submarket — average credit score on applications, eviction rate, late-payment / NSF rate, and stable-employment percentage? A property-management company in the area should have these aggregated.
- How much new for-sale + rental construction is in the pipeline within 1–3 miles? Heavy new supply typically softens prices + rents 12–24 months out; constrained supply supports both.
Investment metrics
- 1% rule
- 0.89% ✗
- Cap rate
- 6.32%
- Cash-on-cash
- 0.09%
- DSCR
- 1.00
- GRM
- 9.4
CMA / ARV
- ARV (on-the-fly)
- $296,640
- Comps found
- 12
Show comp detail 12 sales within ~0.75 mi
| Address | Dist | Beds/Ba | Sqft | Sold | Price | $/sf | Match |
|---|---|---|---|---|---|---|---|
| 1421 Beaupre Ave | 0.12mi | 3/2.0 | 2,101 (+2%) | 2mo | $303,000 | $144 | 85 |
| 29242 Shirley Ave | 0.14mi | 3/1.0 | 1,826 (-11%) | 1mo | $265,000 | $145 | 74 |
| 2123 Common Rd | 0.45mi | 3/2.0 | 2,132 (+4%) | 1mo | $290,000 | $136 | 69 |
| 28419 Park Ct | 0.52mi | 3/2.0 | 2,100 (+2%) | 0mo | $260,000 | $124 | 68 |
| 28146 Park Ct | 0.67mi | 3/1.0 | 2,100 (+2%) | 1mo | $235,000 | $112 | 65 |
| 1274 Fontaine Ave | 0.27mi | 3/2.0 | 1,812 (-12%) | 0mo | $321,000 | $177 | 63 |
| 28686 Herbert St | 0.51mi | 3/2.0 | 1,914 (-7%) | 3mo | $275,000 | $144 | 58 |
| 28800 Tawas Ct | 0.49mi | 3/2.0 | 1,876 (-9%) | 2mo | $225,000 | $120 | 57 |
| 1594 Harvard Dr | 0.46mi | 3/2.5 | 1,847 (-10%) | 0mo | $415,000 | $225 | 55 |
| 2509 Edwin Dr | 0.54mi | 3/1.5 | 2,290 (+11%) | 2mo | $338,000 | $148 | 52 |
| 2237 Cromie Dr | 0.58mi | 3/2.0 | 2,308 (+12%) | 1mo | $285,000 | $123 | 48 |
| 30110 Manor Dr | 0.43mi | 4/2.5 (+1) | 1,764 (-14%) | 1mo | $356,000 | $202 | 44 |
Match score weights: distance 35% · size 25% · config 20% · recency 20%. Top-matched comps best support the ARV.
Projected returns pro-forma
-3.0% appreciation · 2.81% rent growth · sell at horizon
- IRR
- -16.4%
- Equity multiple
- 0.42×
- Total profit
- $-42,146
- Equity at exit
- $38,752
- IRR
- -8.4%
- Equity multiple
- 0.48×
- Total profit
- $-37,832
- Equity at exit
- $22,471
Cash invested: $72,772 (down + closing). Projections, not guarantees.
Landlord ↔ Tenant lean methodology
- Overall (STATE)
- 62 Landlord-Friendly
- State Michigan
- 62 Landlord-Friendly · EVEN
- County
- — inherits STATE
- City
- — inherits STATE
ZIP-level market 48071
- Rents YoY
- 2.8%
- Active inventory
- 135
- Price-to-rent
- 9.4×
Monthly cashflow live
- Estimated rent
- $2,316 high interval (Pro) →
- Mortgage (P&I)
- −$1,363
- Tax from tax record
- −$353 /mo · $4,236/yr
- Insurance
- −$108
- HOA
- −$0
- Vacancy / Maint / Mgmt
- −$486
- Net cashflow
- $6
Break-even live
UW: 25.0% down · 7.5% · 30yr · 1.5% tax · 5.0% vac · 8.0% maint · 8.0% mgmt
Financing live
Cash to close
- Down payment
- $64,975
- Closing costs
- $7,797
- Reserves months
- —
- Total cash needed
- —
Loan-product check · same deal, 3 products live
Conventional
25% down · 7.5% · 30yr
- Down + closing
- —
- Monthly P&I
- —
- Monthly cashflow
- —
- DSCR
- —
- Eligible?
- —
Personal DTI + credit; lowest rate.
DSCR
20% down · 8.5% · 30yr
- Down + closing
- —
- Monthly P&I
- —
- Monthly cashflow
- —
- DSCR
- —
- Eligible?
- —
No personal income docs; deal must DSCR.
Hard money
10% down · 12.0% · 12mo
- Down + closing
- —
- Monthly P&I
- —
- Monthly cashflow
- —
- DSCR
- —
- Eligible?
- —
Short-term bridge; refi at stabilization.
Rent comps 9 comps
| Address | Beds | Baths | Sqft | Rent | $/sqft | DOM | Units | Dist |
|---|---|---|---|---|---|---|---|---|
| 1322 Elliott Ave Madison Heights, MI | 3.0 | 1.5 | 1500 | $2,100 | $1.40 | 18d | 1 | 0.14mi |
| 1045 E 12 Mile Rd Madison Heights, MI | 3.0 | 1.0 | 1700 | $4,000 | $2.35 | 1d | 1 | 0.36mi |
| 29607 Howard Ave Madison Heights, MI | 3.0 | 2.5 | 1956 | $1,950 | $1.00 | 43d | 1 | 0.49mi |
| 740 Sheffield Dr Madison Heights, MI | 3.0 | 1.5 | 2303 | $2,000 | $0.87 | 43d | 1 | 0.52mi |
| 28222 Saint Louise Dr Warren, MI | 3.0 | 2.0 | 1600 | $5,500 | $3.44 | 1d | 1 | 0.80mi |
| 3441 Winterfield Dr Warren, MI | 4.0 | 3.0 | 2300 | $2,381 | $1.04 | 2d | 1 | 1.02mi |
| 3458 Common Rd Warren, MI | 4.0 | 1.5 | 2416 | $2,400 | $0.99 | 10d | 1 | 1.05mi |
| 317 E Irving Ave Madison Heights, MI | 2.0 | 2.5 | 1560 | $2,700 | $1.73 | 1d | 1 | 1.26mi |
| 642 Bellaire Ave Madison Heights, MI | 3.0 | 2.5 | 1750 | $2,423 | $1.38 | 21d | 1 | 1.28mi |
Listing history 6 events
-
2026-06-18days on market $259,900 Active 7 DOM
-
2026-06-17days on market $259,900 Active 6 DOM
-
2026-06-16days on market $259,900 Active 5 DOM
-
2026-06-15days on market $259,900 Active 4 DOM
-
2026-06-13remarks 699-char remark
-
2026-06-13$259,900 Active 2 DOM
ⓘ Source: listings_history table (triggers on properties + properties_extension) + one-shot
backfill from property_details.listing_events for pre-trigger history.
Tax reassessment forecast MI · Partial reset (capped growth)
- Current annual tax
- $4,236 · $353/mo
- Projected year-2 tax
- $4,236 · $353/mo
- Expected delta
- $0/yr ($0/mo · 0.0%)
ⓘ Screening estimate from a state-policy table — verify with the county assessor before closing.
Climate risk First Street
- Flood 1/10 Low FEMA zone X (unshaded) · 0% chance over 30 yrs
- Wildfire 1/10 Low
- Heat 3/10 Moderate 7 d/yr ≥97°F today · 15 d/yr by 30 yrs out
- Wind 2/10 Low
- Air quality 3/10 Moderate 3 unhealthy d/yr today · 5 by 30 yrs out
Nearby sold comps map
Loading sold comps map…
Walkable amenities ~0.75 mi
Loading nearby amenities…
Taxation est. · year 1
- Rental income
- $27,796
- − Mortgage interest
- −$14,558
- − Property taxes
- −$4,236
- − Insurance
- −$1,300
- − Repairs & maintenance
- −$2,224
- − Management
- −$2,224
- − Depreciation
- −$7,561
- Taxable loss
- −$4,306
- Est. tax savings @ 24.0%
- +$1,034
- After-tax cash flow
- $1,101/yr
For passive investors: Depreciation is non-cash, so a rental often shows a tax loss while cash-flowing — sheltering income. Rental losses are passive: they offset passive income freely, and up to $25,000/yr can offset ordinary (W-2) income if you actively participate and your MAGI is under $100k (phasing out to $0 by $150k); unused losses carry forward. On sale, claimed depreciation is recaptured at up to 25%, and gains may owe capital-gains tax (a 1031 exchange can defer both). Figures are a year-1 estimate at your 24.0% rate — not tax advice; consult a CPA.
Schools (NCES district)
- District
- Lamphere Public Schools
- NCES district ID
- 2621120
- Math proficiency
- 28% ▼ -8.00%
- Reading proficiency
- 49% ▲ 1.00%
- Median HH income
- $44,993
- Composite
- 32.69/100
- National rank
- #5649
- State rank
- #235 of 540 in MI
Livability — Madison Heights
- Score
- 81/100
- State rank
- #62
- US rank
- #1347
Category grades
Schools grade is shown separately in the Schools card above.
Census & demographics
- Census place
- Madison Heights, MI
- County
- Oakland County · 1,009,092 people
- City population
- 28,419
- Metro
- Detroit-Warren-Dearborn, MI
- Population (ZIP)
- 28,419
- Household income
- $69,503
- Rent vs Own
- Severe rent burden
- 786.0
Population outlook (Oakland County) Hauer SSP2
- Today (2025)
- 1,335,747 people
- By 2030
- 1,375,100 · +2.9%
- By 2040
- 1,435,385 · +7.5%
- By 2050
- 1,469,250 · +10.0%
- By 2075
- 1,531,946 · +14.7%
- By 2100
- 1,450,485 · +8.6%
Race, ethnicity, and origin ACS 2023
- Neighborhood character
- Predominantly White (79%)
- Race & ethnicity
- White 79% Black 7% Asian 7% Two or more races 4% Hispanic / Latino 2%
- Common ancestry
- Romanian 11% Lithuanian 3% Slovak 2%
- Foreign-born
- 14% · China, Canada, South Korea
- Languages at home
- 84% English-only · Chinese 3% Other Indo-European 3% Arabic 2%
Political lean MEDSL · Oakland
- 2024 margin
- D (+10.6) · D 54.4% · R 43.8% · Other 1.9%
- 2008→2024 swing
- -3.9pp toward R · 2008: 14.5pp · 2024: 10.6pp
- All cycles
- 2024: D+10.6 2020: D+14.1 2016: D+8.1 2012: D+8.1 2008: D+14.5
Not yet ingested
- Civics
- —
Market trends
- HPI YoY
- ▼ -275.69%
- Current HPI
- 243.4861
- Rent YoY
- ▲ 2.81%
- Metro
- Detroit-Warren-Dearborn, MI
- State GDP YoY
- ▲ 1.37%
- F500 in state
- 28
Industry mix (Fortune 500 HQ in MI)
| Industry | F500 HQs | Revenue |
|---|---|---|
| Automotive Parts | 3 | $48B |
|
||
| Automotive | 2 | $372B |
|
||
| Chemicals | 1 | $45B |
|
||
| Automotive Retail | 1 | $29B |
|
||
| Healthcare / Medical Devices | 1 | $23B |
|
||
| Automotive Technology | 1 | $20B |
|
||
Price history
+100.7% since first listed8 events — show timeline
- 2026-06-12 Listed $259,900 MiRealSource-MiMLS
- 2026-06-12 Listed $259,900 REALCOMP
- 2026-06-11 Coming Soon $259,900 MiRealSource-MiMLS
- 1998-12-18 Sold (Public Records) $134,000 Public Records
- 1997-09-19 Sold (Public Records) $125,000 Public Records
- 1997-08-19 Sold (MLS) $125,000 MiRealSource-MiMLS
- 1997-07-22 Listing Removed — MiRealSource-MiMLS
- 1997-06-26 Listed $129,500 MiRealSource-MiMLS
Property tax history
+5.8%/yrLatest (2025): $4,236 · +11.8% YoY. Source: county tax records.
Cash-flow waterfall
monthlySold comps — $/sqft
last 12 mo · ≤1 miLoading sold comps…