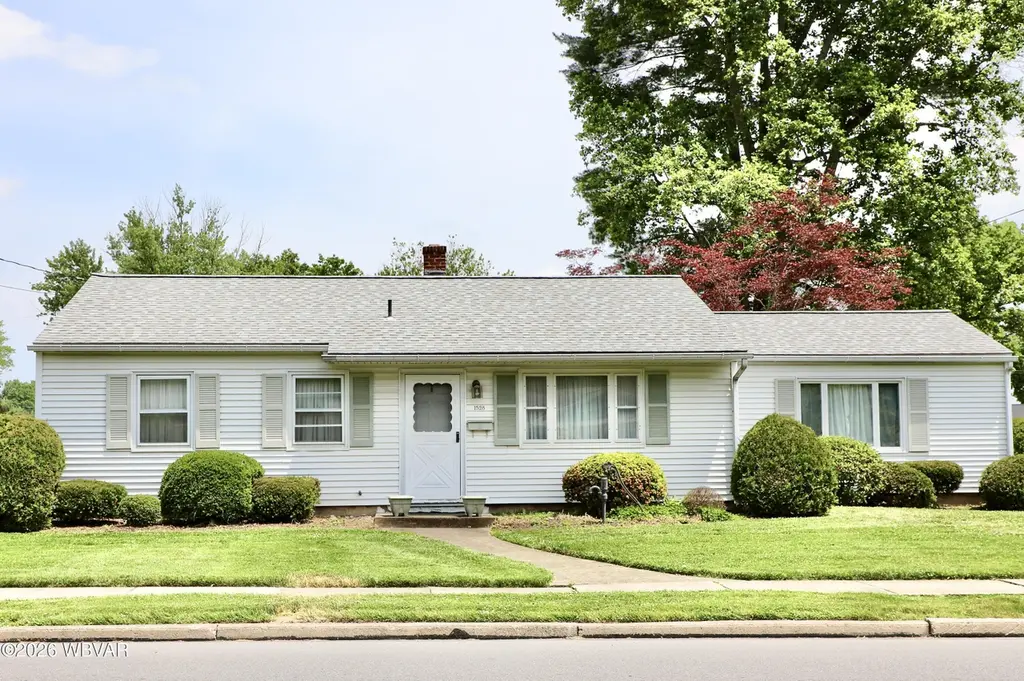
1528 Warren Ave · Loyalsock, PA
Flood risk 1/10 · Minimal
- FEMA flood zone
- X (unshaded)
- Chance of flooding over 30 yrs
- 0.0%
- Est. flood insurance / yr
- $507 – $1,088
Fire risk 2/10 · Minimal
- Est. fire insurance / yr
- $511 – $949
Heat risk 4/10 · Minor
- Hot days now (above 97°F)
- 7 days/yr
- Hot days in 30 yrs
- 16 days/yr
Wind risk 2/10 · Minimal
- Chance of severe wind over 30 yrs
- 2.0%
Air-quality risk 2/10 · Minimal
- Unhealthy air days now
- 0 days/yr
- Unhealthy air days in 30 yrs
- 1 days/yr
Risk factors via First Street. Map © Google.
Why this score? — see what drove the C+ grade
The composite is a weighted blend of 9 inputs, each scored 0–100. Each bar is that input's sub-score; the figure is the points it added to the 100-point composite (weight × sub-score).
- Cash flow +24.5/30.0
- ARV discount +9.8/15.0
- DSCR +7.9/10.0
- 1% rule +5.6/10.0
- Schools +4.4/10.0
- Rent growth +3.6/5.0
- Livability +2.5/5.0
- Condition / age +2.5/5.0
- Appreciation +0.0/10.0
$200,000
🖨 Deal sheet (PDF) 📄 Offer letter ✓ Due diligence
Listing remarks
This is a loved, one owner home in Loyalsock on the corner of Warren and Ritchey. There is a family room, living room, 3 bedrooms, one full bathroom, a utility room and a galley style kitchen with counter seating. Out back there is a covered patio nestled within the beautiful mature landscaping affording some privacy and shade. Coffee spot in the morning? Wine spot in the evening? You decide. The home definitely needs some updating but will be worth the effort!
Key facts
- Counter seating
- Covered patio
- Galley style kitchen
Tags
Property features AI
Exterior
- Parking: No dedicated parking
- Utilities: Public water
- Home design: Residential property; R1 zoning
- Construction: Frame construction; Vinyl siding; Shingle roof; Foundation: see remarks; Built area above grade: 1,233
- Exterior features: Covered porch/patio; Level lot; Shed(s)
Interior
- Kitchen: Dishwasher; Range
- Flooring: Linoleum; Carpet
- Bathrooms: 1 full bathroom
- Heating & cooling: Natural gas heating; Ceiling fan cooling
- Interior features: Bar; Ceiling fans
- Laundry & utility: Washer; Dryer; Laundry on main level
Neighborhood map
What this means for you Summary
Snapshot
- This is a 3-bed/1.0-bath single-family listed at $200k.
Deal economics
- At list price, monthly cash flow is $411 ($5k/yr) — positive.
- The deal already cash-flows at list — no discount required.
- Meets the 1% rule at list price ($2k rent vs $200k).
Location & tenants
- Location reads: area grade C — affects rentability + tenant quality, not the cash-flow math above.
- Loyalsock Township SD (suburban): math 47% / reading 58% proficiency, ranked #152 of 539 in PA (top 28%) — acceptable for families but not a draw, mixed tenant base, ~2y average lease.
- Market conditions: Rents rising fast (+4.4%/yr); 189 active listings in the ZIP; 3 comparable units currently listed for rent nearby; rentals lingering (median 45d on market — plan ~5-8 weeks vacancy on turnover, expect pricing pressure); 67% of comp listings sitting > 30 days — soft ceiling on asking rent; 73 units permitted in Lycoming County in 2024 (15 in 5+ unit buildings).
- At $2,122/mo this rent would consume 48% of the median local household income ($53k/yr) (locally 2178% of renters already pay >50% of income on rent) — very limited rent-growth headroom before tenants either downsize or default.
Forward outlook
- Local home prices are declining (-3.0%/yr); year-one equity from $1k of loan paydown is wiped out by about $6k of value loss. Plan a longer hold.
- Lycoming County population projected to shrink 10% by 2050 — rents likely to lag national; underwrite the cash flow, not the appreciation.
- At projected returns (-3.0% appreciation + 4.4% rent growth), your $56k cash investment doubles in ~10 years — after that, you're playing with house money.
Negotiation context
- Only 9 days on market — expect competitive offers; lowballing is unlikely to land.
Risks & watch-outs
- Watch-outs: built in 1952 — expect roof / HVAC / electrical / plumbing capex.
Questions for the listing agent
- Built in 1952 — when were the roof, HVAC, electrical panel, plumbing, and water heater last replaced?
- Is there a deadline driving the sale (1031 exchange, divorce, estate, relocation)? That informs how much negotiation room exists.
- What's the average days-on-market for RENTAL listings here right now (not sales)? A rising rental-DOM trend means longer vacancies and softer asking-rent achievability than the comps imply.
- What's the recent tenant-quality profile in this submarket — average credit score on applications, eviction rate, late-payment / NSF rate, and stable-employment percentage? A property-management company in the area should have these aggregated.
- How much new for-sale + rental construction is in the pipeline within 1–3 miles? Heavy new supply typically softens prices + rents 12–24 months out; constrained supply supports both.
Investment metrics
- 1% rule
- 1.06% ✓
- Cap rate
- 8.76%
- Cash-on-cash
- 8.80%
- DSCR
- 1.39
- GRM
- 7.9
CMA / ARV
- ARV (on-the-fly)
- $210,843
- Comps found
- 7
Show comp detail 7 sales within ~0.75 mi
| Address | Dist | Beds/Ba | Sqft | Sold | Price | $/sf | Match |
|---|---|---|---|---|---|---|---|
| 1629 Marlin Pkwy | 0.08mi | 3/1.0 | 1,215 (-2%) | 8mo | $189,900 | $156 | 87 |
| 1625 Marlin Pkwy | 0.09mi | 3/1.0 | 1,350 (+10%) | 7mo | $170,000 | $126 | 74 |
| 1617 Marlin Pkwy | 0.11mi | 3/1.5 | 1,148 (-7%) | 10mo | $210,000 | $183 | 73 |
| 1621 Warren Ave | 0.09mi | 3/1.0 | 1,165 (-6%) | 19mo | $199,999 | $172 | 71 |
| 1316 Mansel Ave | 0.25mi | 3/1.5 | 1,143 (-7%) | 12mo | $219,500 | $192 | 64 |
| 1320 Mansel Ave | 0.25mi | 3/1.5 | 1,344 (+9%) | 22mo | $230,000 | $171 | 53 |
| 417 Pearson Ave | 0.70mi | 3/1.0 | 1,360 (+10%) | 3mo | $215,000 | $158 | 48 |
Match score weights: distance 35% · size 25% · config 20% · recency 20%. Top-matched comps best support the ARV.
Projected returns pro-forma
-3.0% appreciation · 4.43% rent growth · sell at horizon
- IRR
- -1.5%
- Equity multiple
- 0.94×
- Total profit
- $-3,187
- Equity at exit
- $29,821
- IRR
- 9.6%
- Equity multiple
- 1.78×
- Total profit
- $43,835
- Equity at exit
- $17,292
Cash invested: $56,000 (down + closing). Projections, not guarantees.
Landlord ↔ Tenant lean methodology
- Overall (STATE)
- 62 Landlord-Friendly
- State Pennsylvania
- 62 Landlord-Friendly · EVEN
- County
- — inherits STATE
- City
- — inherits STATE
ZIP-level market 17701
- Rents YoY
- 4.4%
- Active inventory
- 189
- Price-to-rent
- 7.9×
Monthly cashflow live
- Estimated rent
- $2,122 medium interval (Pro) →
- Mortgage (P&I)
- −$1,049
- Tax from tax record
- −$133 /mo · $1,596/yr
- Insurance
- −$83
- HOA
- −$0
- Vacancy / Maint / Mgmt
- −$446
- Net cashflow
- $411
Break-even live
Sensitivity live
| Price | -10% $524 | -5% $467 | +0% $411 | +5% $354 | +10% $298 |
|---|---|---|---|---|---|
| Rent | -10% $243 | -5% $327 | +0% $411 | +5% $495 | +10% $578 |
| Rate | -1.0pp $512 | -0.5pp $462 | base $411 | +0.5pp $359 | +1.0pp $306 |
UW: 25.0% down · 7.5% · 30yr · 1.5% tax · 5.0% vac · 8.0% maint · 8.0% mgmt
Financing live
Cash to close
- Down payment
- $50,000
- Closing costs
- $6,000
- Reserves months
- —
- Total cash needed
- —
Loan-product check · same deal, 3 products live
Conventional
25% down · 7.5% · 30yr
- Down + closing
- —
- Monthly P&I
- —
- Monthly cashflow
- —
- DSCR
- —
- Eligible?
- —
Personal DTI + credit; lowest rate.
DSCR
20% down · 8.5% · 30yr
- Down + closing
- —
- Monthly P&I
- —
- Monthly cashflow
- —
- DSCR
- —
- Eligible?
- —
No personal income docs; deal must DSCR.
Hard money
10% down · 12.0% · 12mo
- Down + closing
- —
- Monthly P&I
- —
- Monthly cashflow
- —
- DSCR
- —
- Eligible?
- —
Short-term bridge; refi at stabilization.
Rent comps 3 comps
| Address | Beds | Baths | Sqft | Rent | $/sqft | DOM | Units | Dist |
|---|---|---|---|---|---|---|---|---|
| 1539 Northway Rd Unit NW455 Williamsport, PA | 2.0 | 1.0 | 700 | $850 | $1.21 | 45d | 1 | 0.57mi |
| 300 Valley Heights Dr Williamsport, PA | 1.0–3.0 | 1.0–2.0 | 1195 | $3,476 | $2.91 | 15d | 1 | 0.63mi |
| 215 E 3rd St Unit 3D Williamsport, PA | 2.0 | 1.0 | 1300 | $2,500 | $1.92 | 45d | 1 | 1.31mi |
Listing history 8 events
-
2026-06-21days on market $200,000 Active 9 DOM
-
2026-06-19days on market $200,000 Active 7 DOM
-
2026-06-18days on market $200,000 Active 6 DOM
-
2026-06-17days on market $200,000 Active 5 DOM
-
2026-06-16days on market $200,000 Active 4 DOM
-
2026-06-15days on market $200,000 Active 3 DOM
-
2026-06-12remarks 467-char remark
-
2026-06-12$200,000 Active 1 DOM
ⓘ Source: listings_history table (triggers on properties + properties_extension) + one-shot
backfill from property_details.listing_events for pre-trigger history.
Tax reassessment forecast PA · Partial reset (capped growth)
- Current annual tax
- $1,596 · $133/mo
- Projected year-2 tax
- $2,378 · $198/mo
- Expected delta
- +$782/yr (+$65/mo · 49.0%)
ⓘ Screening estimate from a state-policy table — verify with the county assessor before closing.
Climate risk First Street
- Flood 1/10 Low FEMA zone X (unshaded) · 0% chance over 30 yrs
- Wildfire 2/10 Low
- Heat 4/10 Moderate 7 d/yr ≥97°F today · 16 d/yr by 30 yrs out
- Wind 2/10 Low 2% chance of damaging wind over 30 yrs
- Air quality 2/10 Low 0 unhealthy d/yr today · 1 by 30 yrs out
Nearby sold comps map
Loading sold comps map…
Walkable amenities ~0.75 mi
Loading nearby amenities…
Taxation est. · year 1
- Rental income
- $25,458
- − Mortgage interest
- −$11,203
- − Property taxes
- −$1,596
- − Insurance
- −$1,000
- − Repairs & maintenance
- −$2,037
- − Management
- −$2,037
- − Depreciation
- −$5,818
- Taxable income
- $1,767
- Est. tax owed @ 24.0%
- −$424
- After-tax cash flow
- $4,506/yr
For passive investors: Depreciation is non-cash, so a rental often shows a tax loss while cash-flowing — sheltering income. Rental losses are passive: they offset passive income freely, and up to $25,000/yr can offset ordinary (W-2) income if you actively participate and your MAGI is under $100k (phasing out to $0 by $150k); unused losses carry forward. On sale, claimed depreciation is recaptured at up to 25%, and gains may owe capital-gains tax (a 1031 exchange can defer both). Figures are a year-1 estimate at your 24.0% rate — not tax advice; consult a CPA.
Schools (NCES district)
- District
- Loyalsock Township SD
- NCES district ID
- 4214310
- Math proficiency
- 47% ▼ -10.00%
- Reading proficiency
- 58% ▼ -13.00%
- Median HH income
- $46,423
- Composite
- 44.48/100
- National rank
- #2800
- State rank
- #152 of 539 in PA
Livability — Loyalsock
No livability data for this city. (Only ~50 U.S. cities are tracked.)
Census & demographics
- Census place
- Faxon, PA
- County
- Lycoming County · 43,104 people
- Metro
- Williamsport, PA
- Population (ZIP)
- 43,104
- Household income
- $53,237
- Rent vs Own
- Severe rent burden
- 2178.0
Population outlook (Lycoming County) Hauer SSP2
- Today (2025)
- 114,164 people
- By 2030
- 112,221 · -1.7%
- By 2040
- 107,613 · -5.7%
- By 2050
- 102,950 · -9.8%
- By 2075
- 92,987 · -18.5%
- By 2100
- 80,924 · -29.1%
Race, ethnicity, and origin ACS 2023
- Neighborhood character
- Predominantly White (80%)
- Race & ethnicity
- White 80% Black 10% Two or more races 7% Hispanic / Latino 3% Asian 1%
- Common ancestry
- Romanian 3% Lithuanian 2% Slovak 2%
- Foreign-born
- 2% · Canada
- Languages at home
- 96% English-only · Spanish 1% French/Haitian/Cajun 1% German/W. Germanic 1%
Political lean MEDSL · Lycoming
- 2024 margin
- Solid R (+41.5) · D 28.8% · R 70.3%
- 2008→2024 swing
- -17.3pp toward R · 2008: -24.2pp · 2024: -41.5pp
- All cycles
- 2024: R+41.5 2020: R+41.3 2016: R+44.8 2012: R+33.3 2008: R+24.2
Not yet ingested
- Civics
- —
Market trends
- HPI YoY
- ▼ -142.61%
- Current HPI
- 216.7203
- Rent YoY
- ▲ 4.43%
- Metro
- Williamsport, PA
- State GDP YoY
- ▲ 1.68%
- F500 in state
- 34
Industry mix (Fortune 500 HQ in PA)
| Industry | F500 HQs | Revenue |
|---|---|---|
| Healthcare | 2 | $309B |
|
||
| Insurance | 2 | $27B |
|
||
| Telecommunications / Media | 1 | $124B |
|
||
| Industrial Distribution | 1 | $22B |
|
||
| Financial Services | 1 | $20B |
|
||
| Chemicals / Materials | 1 | $18B |
|
||
Price history
1 event — show timeline
- 2026-06-12 Listed $200,000 WBVAR
Property tax history
+1.2%/yrLatest (2026): $1,596 · +2.2% YoY. Source: county tax records.
Cash-flow waterfall
monthlySold comps — $/sqft
last 12 mo · ≤1 miLoading sold comps…