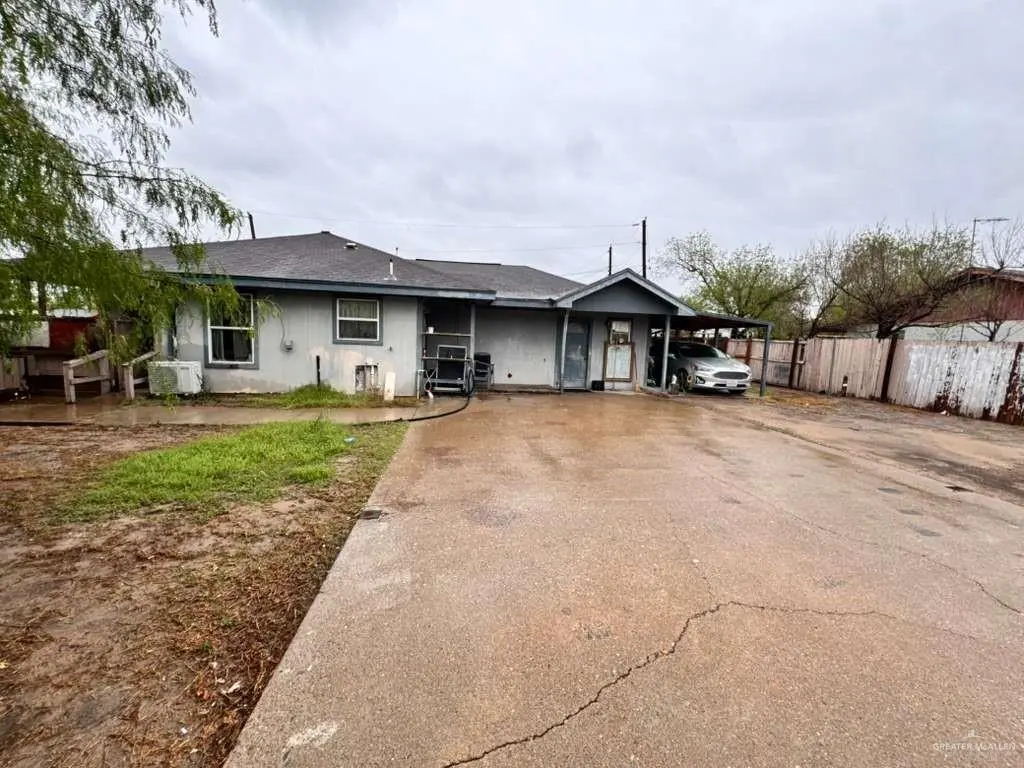
220 W 6th St · Sullivan City, TX
Flood risk 1/10 · Minimal
- FEMA flood zone
- X
- Chance of flooding over 30 yrs
- 0.0%
- Est. flood insurance / yr
- $507 – $1,088
Fire risk 8/10 · Major
- Est. fire insurance / yr
- $1,222 – $2,270
Heat risk 9/10 · Severe
- Hot days now (above 112°F)
- 7 days/yr
- Hot days in 30 yrs
- 22 days/yr
Wind risk 8/10 · Major
- Chance of severe wind over 30 yrs
- 80.0%
Air-quality risk 1/10 · Minimal
- Unhealthy air days now
- 0 days/yr
- Unhealthy air days in 30 yrs
- 0 days/yr
Risk factors via First Street. Map © Google.
Why this score? — see what drove the C grade
The composite is a weighted blend of 9 inputs, each scored 0–100. Each bar is that input's sub-score; the figure is the points it added to the 100-point composite (weight × sub-score).
- Cash flow +23.6/30.0
- 1% rule +8.1/10.0
- DSCR +7.6/10.0
- Appreciation +6.4/10.0
- ARV discount +3.0/15.0
- Livability +2.8/5.0
- Rent growth +2.5/5.0
- Condition / age +2.5/5.0
- Schools +1.9/10.0
$85,000
🖨 Deal sheet 📄 Offer letter ✓ Due diligence
Listing remarks
Opportunity awaits in Sullivan City! This 3-bedroom, 2-bath home sits on a generously sized lot and offers plenty of potential for the right buyer. Whether you're an investor looking for your next project or a handyman ready to add value, this property provides a great canvas for renovation and customization. The spacious lot offers room for future improvements, outdoor living, or additional storage. Conveniently located with easy access to local amenities, this property is being sold as-is and is ready for its next chapter. Don't miss this chance to transform a property with strong upside potential!
Key facts
- Generously sized lot
- 0.23 acre lot
- Parking
Tags
Property features AI
Finance
- HOA & community: No homeowners association
Exterior
- Parking: One covered parking space; One carport (no garage)
- Utilities: Public water; City sewer
- Home design: Property records source: HidalgoCAD
- Construction: Wood siding; Slab foundation; Shingle roof; Built area approximately 1,287 (building area total)
- Exterior features: Wood fencing; Paved road access
Interior
- Kitchen: Electric water heater; No conveying appliances
- Flooring: Carpet; Laminate; Tile
- Bathrooms: Two full bathrooms
- Heating & cooling: Central heating; Central air conditioning
- Interior features: Granite countertops; Ceiling fans; No window coverings
- Laundry & utility: Laundry area
Neighborhood map
What this means for you Summary
Snapshot
- This is a 3-bed/2.0-bath single-family listed at $85k.
Deal economics
- At list price, monthly cash flow is $161 ($2k/yr) — positive.
- The deal already cash-flows at list — no discount required.
- Meets the 1% rule at list price ($1k rent vs $85k).
Location & tenants
- Location reads 55/100 on livability (#1,369 in TX) — a working-class tenant base; expect higher turnover. Strengths: cost of living A+, housing B; Watch: crime D, amenities F, commute F.
- La Joya ISD (suburban): math 18% / reading 29% proficiency, ranked #759 of 826 in TX (top 92%) — low school quality limits family demand, transient renter base, plan for 1-2y turnover.
- Zoned schools: Rosendo Benavides El (math 17% / reading 27%, grade F, #3,333 of 4,322 statewide, top 80%, 285 students, 96% FRL); Lorenzo De Zavala Middle (math 18% / reading 22%, grade F, #1,428 of 1,662 statewide, top 87%, 606 students, 89% FRL); La Joya H S (math 16% / reading 32%, grade F, #1,333 of 1,632 statewide, top 82%, 2,775 students, 92% FRL) — zoned schools average 93% FRL vs 54% district-wide (39 pts higher); higher-poverty schools than district average — tighter screening recommended.
- Market conditions: 37 active listings in the ZIP; 7,378 units permitted in Hidalgo County in 2024 (641 in 5+ unit buildings).
Forward outlook
- In year one you build about $3k of equity ($588 loan paydown + $2k appreciation (2.9% local appreciation)).
- Hidalgo County population projected at +28% by 2050 — long-run rental-demand tailwind backs the buy-and-hold thesis.
- At projected returns (2.9% appreciation + 3.0% rent growth), your $24k cash investment doubles in ~5 years — after that, you're playing with house money.
Negotiation context
- Only 7 days on market — expect competitive offers; lowballing is unlikely to land.
- 2 sale attempts with the ask held roughly flat each time — persistent listings suggest the price (not the market) is what's stuck; bring a comps-based counter.
Risks & watch-outs
- Watch-outs: property tax is 3.4% of price.
- Climate carrying-cost: severe wind risk, 80% chance of damaging wind over 30y; severe wildfire risk; extreme-heat days projected 7→22/yr by 2055 (HVAC capex compounding) — expect insurance premiums to compound above CPI over the hold.
Questions for the listing agent
- Property tax is high relative to price — has the assessment been appealed recently, and will the sale trigger a re-assessment?
- Is there a deadline driving the sale (1031 exchange, divorce, estate, relocation)? That informs how much negotiation room exists.
- Schools are F-rated, which usually means shorter tenancies and higher turnover. Who's the typical renter profile here, and what's been the actual vacancy rate?
- Crime grade is D in this area — have there been break-ins, vandalism, or insurance claims at this property in the last 3 years? What carrier currently insures it and at what premium?
- What's the average days-on-market for RENTAL listings here right now (not sales)? A rising rental-DOM trend means longer vacancies and softer asking-rent achievability than the comps imply.
- What's the recent tenant-quality profile in this submarket — average credit score on applications, eviction rate, late-payment / NSF rate, and stable-employment percentage? A property-management company in the area should have these aggregated.
- How much new for-sale + rental construction is in the pipeline within 1–3 miles? Heavy new supply typically softens prices + rents 12–24 months out; constrained supply supports both.
Investment metrics
- 1% rule
- 1.31% ✓
- Cap rate
- 8.56%
- Cash-on-cash
- 8.09%
- DSCR
- 1.36
- GRM
- 6.4
CMA / ARV
- ARV (on-the-fly)
- $77,220
- Comps found
- 1
Show comp detail 1 sale within ~0.75 mi
| Address | Dist | Beds/Ba | Sqft | Sold | Price | $/sf | Match |
|---|---|---|---|---|---|---|---|
| 301 Obregon Ave | 0.42mi | 3/1.0 | 1,145 (-11%) | 21mo | $69,000 | $60 | 40 |
Match score weights: distance 35% · size 25% · config 20% · recency 20%. Top-matched comps best support the ARV.
Projected returns pro-forma
2.89% appreciation · 3.0% rent growth · sell at horizon
- IRR
- 14.9%
- Equity multiple
- 1.84×
- Total profit
- $20,064
- Equity at exit
- $37,690
- IRR
- 16.7%
- Equity multiple
- 3.43×
- Total profit
- $57,868
- Equity at exit
- $57,677
Cash invested: $23,800 (down + closing). Projections, not guarantees.
Landlord ↔ Tenant lean methodology
- Overall (STATE)
- 87 Strongly Landlord-Friendly
- State Texas
- 87 Strongly Landlord-Friendly · R+5
- County
- — inherits STATE
- City
- — inherits STATE
ZIP-level market 78595
- Home prices YoY
- 1.4%
- Active inventory
- 37
- Price-to-rent
- 6.4×
Monthly cashflow live
- Estimated rent
- $1,115 medium interval (Pro) →
- Mortgage (P&I)
- −$446
- Tax from tax record
- −$239 /mo · $2,868/yr
- Insurance
- −$35
- HOA
- −$0
- Vacancy / Maint / Mgmt
- −$234
- Net cashflow
- $161
Break-even live
UW: 25.0% down · 7.5% · 30yr · 1.5% tax · 5.0% vac · 8.0% maint · 8.0% mgmt
Financing live
Cash to close
- Down payment
- $21,250
- Closing costs
- $2,550
- Reserves months
- —
- Total cash needed
- —
Loan-product check · same deal, 3 products live
Conventional
25% down · 7.5% · 30yr
- Down + closing
- —
- Monthly P&I
- —
- Monthly cashflow
- —
- DSCR
- —
- Eligible?
- —
Personal DTI + credit; lowest rate.
DSCR
20% down · 8.5% · 30yr
- Down + closing
- —
- Monthly P&I
- —
- Monthly cashflow
- —
- DSCR
- —
- Eligible?
- —
No personal income docs; deal must DSCR.
Hard money
10% down · 12.0% · 12mo
- Down + closing
- —
- Monthly P&I
- —
- Monthly cashflow
- —
- DSCR
- —
- Eligible?
- —
Short-term bridge; refi at stabilization.
Listing history 7 events
-
2026-06-18days on market $85,000 Active 7 DOM
-
2026-06-17days on market $85,000 Active 6 DOM
-
2026-06-16days on market $85,000 Active 5 DOM
-
2026-06-15days on market $85,000 Active 4 DOM
-
2026-06-14days on market $85,000 Active 2 DOM
-
2026-06-13remarks 607-char remark
-
2026-06-13$85,000 Active 1 DOM
ⓘ Source: listings_history table (triggers on properties + properties_extension) + one-shot
backfill from property_details.listing_events for pre-trigger history.
Tax reassessment forecast TX · Resets to sale price
- Current annual tax
- $2,868 · $239/mo
- Projected year-2 tax
- $2,868 · $239/mo
- Expected delta
- $0/yr ($0/mo · -0.0%)
ⓘ Screening estimate from a state-policy table — verify with the county assessor before closing.
Climate risk First Street
- Flood 1/10 Low FEMA zone X · 0% chance over 30 yrs
- Wildfire 8/10 Severe
- Heat 9/10 Extreme 7 d/yr ≥112°F today · 22 d/yr by 30 yrs out
- Wind 8/10 Severe 80% chance of damaging wind over 30 yrs
- Air quality 1/10 Low 0 unhealthy d/yr today · 0 by 30 yrs out
Nearby sold comps map
Loading sold comps map…
Walkable amenities ~0.75 mi
Loading nearby amenities…
Taxation est. · year 1
- Rental income
- $13,377
- − Mortgage interest
- −$4,761
- − Property taxes
- −$2,868
- − Insurance
- −$425
- − Repairs & maintenance
- −$1,070
- − Management
- −$1,070
- − Depreciation
- −$2,473
- Taxable income
- $710
- Est. tax owed @ 24.0%
- −$170
- After-tax cash flow
- $1,756/yr
For passive investors: Depreciation is non-cash, so a rental often shows a tax loss while cash-flowing — sheltering income. Rental losses are passive: they offset passive income freely, and up to $25,000/yr can offset ordinary (W-2) income if you actively participate and your MAGI is under $100k (phasing out to $0 by $150k); unused losses carry forward. On sale, claimed depreciation is recaptured at up to 25%, and gains may owe capital-gains tax (a 1031 exchange can defer both). Figures are a year-1 estimate at your 24.0% rate — not tax advice; consult a CPA.
Schools (NCES district)
- District
- La Joya ISD
- NCES district ID
- 4826130
- Math proficiency
- 18% ▼ -35.00%
- Reading proficiency
- 29% ▼ -10.00%
- Median HH income
- $27,845
- Composite
- 18.65/100
- National rank
- #8891
- State rank
- #759 of 826 in TX
Livability — Sullivan City
- Score
- 55/100
- State rank
- #1369
- US rank
- #23526
Category grades
Schools grade is shown separately in the Schools card above.
Census & demographics
- Census place
- Sullivan City, TX
- Population (ZIP)
- 5,958
Population outlook (Hidalgo County) Hauer SSP2
- Today (2025)
- 955,232 people
- By 2030
- 1,009,774 · +5.7%
- By 2040
- 1,120,332 · +17.3%
- By 2050
- 1,225,036 · +28.2%
- By 2075
- 1,439,189 · +50.7%
- By 2100
- 1,533,429 · +60.5%
Race, ethnicity, and origin ACS 2023
- Neighborhood character
- Predominantly Hispanic (98%)
- Race & ethnicity
- Hispanic / Latino 98% Two or more races 46%
- Hispanic origin (detail)
- Mexican 96%
- Foreign-born
- 30% · Canada
- Languages at home
- 7% English-only · Spanish 93%
Political lean MEDSL · Hidalgo
- 2024 margin
- Toss-up / Even · D 48.1% · R 51.0%
- 2008→2024 swing
- -41.6pp toward R · 2008: 38.7pp · 2024: -2.9pp
- All cycles
- 2024: R+2.9 2020: D+17.1 2016: D+40.5 2012: D+41.8 2008: D+38.7
Not yet ingested
- Civics
- —
Market trends
- HPI YoY
- ▲ 2.89%
- Current HPI
- 212.3717
- Rent YoY
- —
- Metro
- —
- State GDP YoY
- ▲ 3.95%
- F500 in state
- 110
Industry mix (Fortune 500 HQ in TX)
| Industry | F500 HQs | Revenue |
|---|---|---|
| Energy | 16 | $1,198B |
|
||
| Technology | 5 | $198B |
|
||
| Engineering / Construction | 4 | $72B |
|
||
| Energy Services | 3 | $60B |
|
||
| Utilities | 3 | $41B |
|
||
| Healthcare | 2 | $330B |
|
||
Price history
-37.0% since first listed6 events — show timeline
- 2026-06-11 Listed $85,000 MCALLENMLS
- 2025-10-13 Price Changed $115,000 MCALLENMLS
- 2025-09-03 Price Changed $120,000 MCALLENMLS
- 2025-08-07 Price Changed $125,000 MCALLENMLS
- 2025-06-10 Price Changed $134,000 MCALLENMLS
- 2025-05-30 Listed $135,000 MCALLENMLS
Property tax history
+7.3%/yrLatest (2025): $2,868 · +15.3% YoY. Source: county tax records.
Cash-flow waterfall
monthlySold comps — $/sqft
last 12 mo · ≤1 miLoading sold comps…