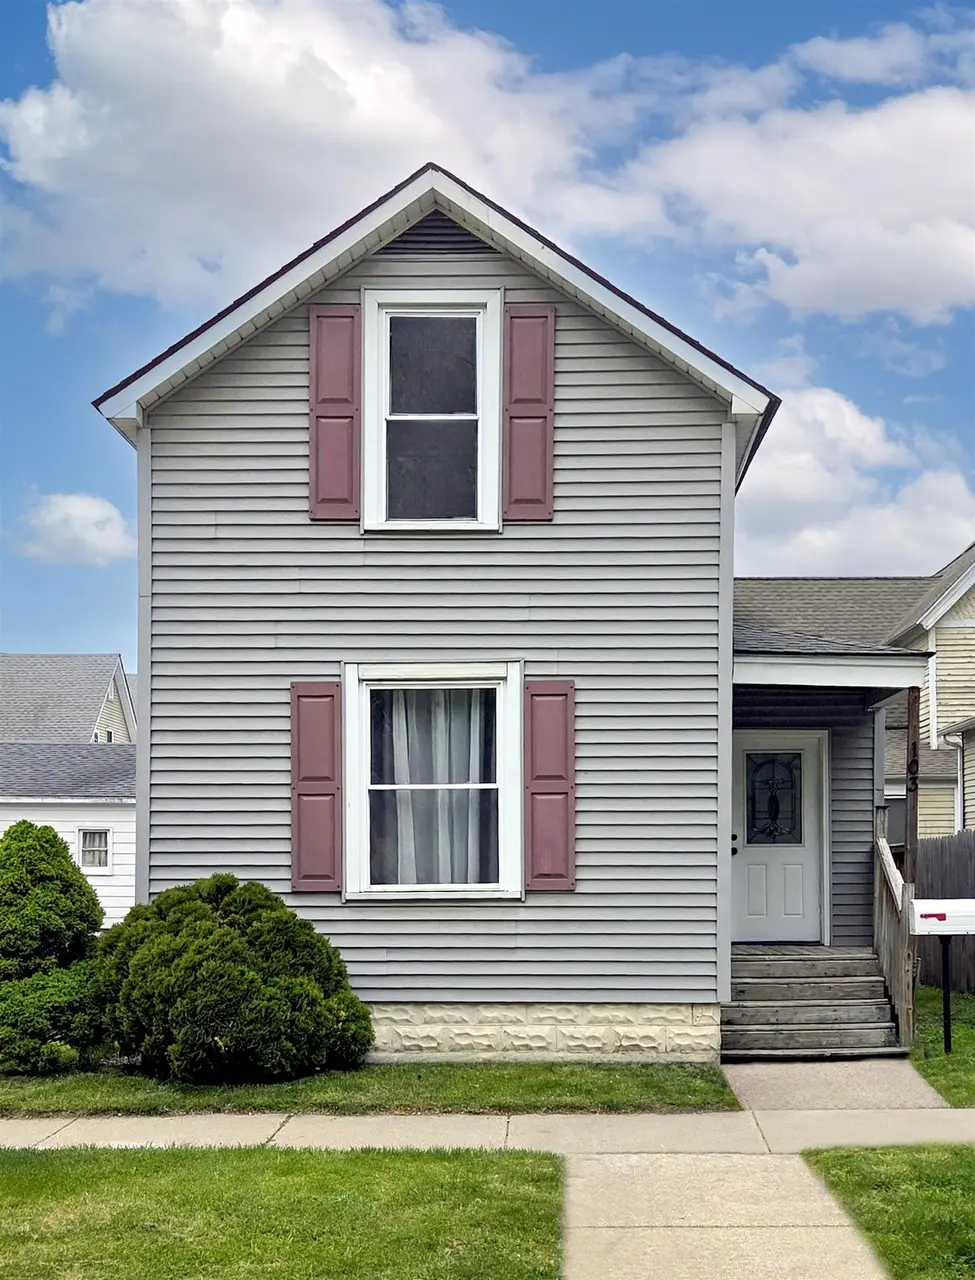
103 E Vermont St · Bay City, MI
Flood risk 1/10 · Minimal
- FEMA flood zone
- X (unshaded)
- Chance of flooding over 30 yrs
- 0.0%
- Est. flood insurance / yr
- $473 – $860
Fire risk 1/10 · Minimal
- Est. fire insurance / yr
- $784 – $1,456
Heat risk 3/10 · Minor
- Hot days now (above 97°F)
- 7 days/yr
- Hot days in 30 yrs
- 14 days/yr
Wind risk 1/10 · Minimal
- Chance of severe wind over 30 yrs
- —
Air-quality risk 2/10 · Minimal
- Unhealthy air days now
- 1 days/yr
- Unhealthy air days in 30 yrs
- 2 days/yr
Risk factors via First Street. Map © Google.
Why this score? — see what drove the D+ grade
The composite is a weighted blend of 9 inputs, each scored 0–100. Each bar is that input's sub-score; the figure is the points it added to the 100-point composite (weight × sub-score).
- Cash flow +23.5/30.0
- DSCR +7.6/10.0
- 1% rule +5.9/10.0
- Livability +3.4/5.0
- Schools +2.8/10.0
- Rent growth +2.5/5.0
- Condition / age +2.5/5.0
- ARV discount +0.0/15.0
- Appreciation +0.0/10.0
$94,000
🖨 Deal sheet (PDF) 📄 Offer letter ✓ Due diligence
Listing remarks
West side 2 bed 1 bath with 927 sq ft. Charming low maintenance perfect starter home or turn-key rental. Recent updates and move-in ready. Great location and even better neighborhood. #MAKEITHAPPEN (Seller is a licensed agent)
Key facts
- 1,306 sq ft lot
- Built 1890
- Listed 35 days
Property features AI
Finance
- Other: Property type: Residential; Lot size approx. 0.03 acres (2,250 sq ft); Zoning: Residential
Exterior
- Parking: On-street parking
- Utilities: Public water; Public sanitary sewer; Electric water heater; Natural gas fuel available
- Home design: Residential 1 1/2-story structure; Built in 1890
- Construction: Basement foundation; Block basement; Vinyl siding exterior; Year built: 1890
- Exterior features: Vinyl siding; Fenced yard; Patio; Porch; Street lights along the street; Road frontage (approx. 22'); No water features; not in a floodplain
Interior
- Kitchen: Kitchen on the first floor (approx. 13 x 11); Dishwasher, microwave, range/oven, refrigerator
- Bedrooms: Two bedrooms on the second floor (13 x 10; 12 x 10) with carpet flooring
- Flooring: Carpet in bedrooms and living room
- Bathrooms: One full bathroom on the first floor (approx. 6 x 7)
- Heating & cooling: Heating: baseboard, electric heat, and forced air; Cooling: ceiling fan(s) and window unit(s); Water heater: electric; Fuel: natural gas
- Interior features: Finished living space includes 4 total rooms; Full, unfinished basement with block foundation and egress/daylight windows
- Laundry & utility: Basement provides space for laundry/utility
Neighborhood map
What this means for you Summary
Snapshot
- This is a 1-bed/1.0-bath single-family listed at $94k.
Deal economics
- At list price, monthly cash flow is $176 ($2k/yr) — positive.
- The deal already cash-flows at list — no discount required.
- Meets the 1% rule at list price ($1k rent vs $94k).
- Recommended offer: $91k (3.0% below list) — sets the bar for market timing.
- Cap rate 8.5% vs local median 5.6% in Bay City — top-decile yield for the area; either an underpriced asset or a hidden risk that comps aren't pricing in. Stress-test before assuming the spread holds.
Location & tenants
- Location reads 68/100 on livability (#360 in MI) — a middle-class / working-renter tenant base. Strengths: cost of living A+, housing A+, health & safety A+; Watch: schools D+, amenities D, crime F.
- Bay City School District (urban): math 27% / reading 40% proficiency, ranked #317 of 540 in MI (top 59%) — families likely to look elsewhere, expect single-tenant / working-renter base with shorter leases.
- Market conditions: 248 active listings in the ZIP; 2 comparable units currently listed for rent nearby; 39 units permitted in Bay County in 2024 (0 in 5+ unit buildings).
Forward outlook
- Local home prices are declining (-3.0%/yr); year-one equity from $650 of loan paydown is wiped out by about $3k of value loss. Plan a longer hold.
- Bay County population projected at -21% by 2050 — secular population decline; favor cash flow + early exit over multi-decade hold.
Negotiation context
- It's been on market 36 days — a 3% lower offer ($91k) is reasonable based on typical stale-listing flexibility.
- 2 sale attempts since 18y ago; this cycle's ask has dropped $15k (14%) from the opening price — seller is motivated, your offer sets the floor, not the list.
- Current owner paid $65k; 45% above their basis — modest negotiation headroom, anchor on the comps not their cost.
Risks & watch-outs
- Watch-outs: built in 1890 — expect roof / HVAC / electrical / plumbing capex.
Questions for the listing agent
- It's been on market 36 days. Have you received any prior offers? Is the seller open to a 3% concession, seller financing, or rate buy-down credit?
- Built in 1890 — when were the roof, HVAC, electrical panel, plumbing, and water heater last replaced?
- Is there a deadline driving the sale (1031 exchange, divorce, estate, relocation)? That informs how much negotiation room exists.
- Schools are D-rated, which usually means shorter tenancies and higher turnover. Who's the typical renter profile here, and what's been the actual vacancy rate?
- Crime grade is F in this area — have there been break-ins, vandalism, or insurance claims at this property in the last 3 years? What carrier currently insures it and at what premium?
- The area grade is low — what's the realistic commute time and amenity access for the typical tenant pool here? Any planned neighborhood developments (good or bad) we should know about?
- What's the average days-on-market for RENTAL listings here right now (not sales)? A rising rental-DOM trend means longer vacancies and softer asking-rent achievability than the comps imply.
- What's the recent tenant-quality profile in this submarket — average credit score on applications, eviction rate, late-payment / NSF rate, and stable-employment percentage? A property-management company in the area should have these aggregated.
- How much new for-sale + rental construction is in the pipeline within 1–3 miles? Heavy new supply typically softens prices + rents 12–24 months out; constrained supply supports both.
Investment metrics
- 1% rule
- 1.09% ✓
- Cap rate
- 8.54%
- Cash-on-cash
- 8.04%
- DSCR
- 1.36
- GRM
- 7.6
CMA / ARV
- ARV (on-the-fly)
- $78,807
- Comps found
- 12
Show comp detail 12 sales within ~0.75 mi
| Address | Dist | Beds/Ba | Sqft | Sold | Price | $/sf | Match |
|---|---|---|---|---|---|---|---|
| 607 N Dewitt St | 0.30mi | 2/1.0 (+1) | 698 (-4%) | 12mo | $94,000 | $135 | 66 |
| 609 N Catherine St | 0.35mi | 2/1.0 (+1) | 750 (+4%) | 11mo | $65,000 | $87 | 64 |
| 402 E Fisher St | 0.59mi | 2/1.0 (+1) | 720 (-0%) | 12mo | $94,900 | $132 | 57 |
| 538 Webb Dr | 0.60mi | 2/1.5 (+1) | 764 (+6%) | 3mo | $186,500 | $244 | 53 |
| 509 W Jenny St | 0.43mi | 2/1.0 (+1) | 792 (+10%) | 11mo | $86,000 | $109 | 50 |
| 705 N Dewitt St | 0.36mi | 2/1.0 (+1) | 805 (+11%) | 11mo | $35,000 | $43 | 50 |
| 707 W Jenny St | 0.52mi | 2/1.0 (+1) | 792 (+10%) | 8mo | $75,000 | $95 | 48 |
| 700 S Wenona Ave | 0.58mi | 2/1.0 (+1) | 733 (+1%) | 21mo | $79,000 | $108 | 48 |
| 1001 E North Union St | 0.63mi | 2/1.0 (+1) | 803 (+11%) | 0mo | $32,000 | $40 | 47 |
| 107 King St | 0.50mi | 2/1.0 (+1) | 680 (-6%) | 19mo | $56,000 | $82 | 46 |
| 511 S Barclay St | 0.64mi | 2/1.0 (+1) | 648 (-10%) | 12mo | $87,500 | $135 | 38 |
| 510 S Kiesel St | 0.55mi | 2/1.0 (+1) | 821 (+14%) | 23mo | $93,300 | $114 | 28 |
Match score weights: distance 35% · size 25% · config 20% · recency 20%. Top-matched comps best support the ARV.
Projected returns pro-forma
-3.0% appreciation · 3.0% rent growth · sell at horizon
- IRR
- -4.1%
- Equity multiple
- 0.85×
- Total profit
- $-3,997
- Equity at exit
- $14,016
- IRR
- 5.6%
- Equity multiple
- 1.42×
- Total profit
- $11,006
- Equity at exit
- $8,127
Cash invested: $26,320 (down + closing). Projections, not guarantees.
Landlord ↔ Tenant lean methodology
- Overall (STATE)
- 62 Landlord-Friendly
- State Michigan
- 62 Landlord-Friendly · EVEN
- County
- — inherits STATE
- City
- — inherits STATE
ZIP-level market 48706
- Active inventory
- 248
- Price-to-rent
- 7.6×
Monthly cashflow live
- Estimated rent
- $1,028 medium interval (Pro) →
- Mortgage (P&I)
- −$493
- Tax from tax record
- −$103 /mo · $1,241/yr
- Insurance
- −$39
- HOA
- −$0
- Vacancy / Maint / Mgmt
- −$216
- Net cashflow
- $176
Break-even live
Sensitivity live
| Price | -10% $230 | -5% $203 | +0% $176 | +5% $150 | +10% $123 |
|---|---|---|---|---|---|
| Rent | -10% $95 | -5% $136 | +0% $176 | +5% $217 | +10% $257 |
| Rate | -1.0pp $224 | -0.5pp $200 | base $176 | +0.5pp $152 | +1.0pp $127 |
UW: 25.0% down · 7.5% · 30yr · 1.5% tax · 5.0% vac · 8.0% maint · 8.0% mgmt
Financing live
Cash to close
- Down payment
- $23,500
- Closing costs
- $2,820
- Reserves months
- —
- Total cash needed
- —
Loan-product check · same deal, 3 products live
Conventional
25% down · 7.5% · 30yr
- Down + closing
- —
- Monthly P&I
- —
- Monthly cashflow
- —
- DSCR
- —
- Eligible?
- —
Personal DTI + credit; lowest rate.
DSCR
20% down · 8.5% · 30yr
- Down + closing
- —
- Monthly P&I
- —
- Monthly cashflow
- —
- DSCR
- —
- Eligible?
- —
No personal income docs; deal must DSCR.
Hard money
10% down · 12.0% · 12mo
- Down + closing
- —
- Monthly P&I
- —
- Monthly cashflow
- —
- DSCR
- —
- Eligible?
- —
Short-term bridge; refi at stabilization.
Rent comps 2 comps
| Address | Beds | Baths | Sqft | Rent | $/sqft | DOM | Units | Dist |
|---|---|---|---|---|---|---|---|---|
| 1305 Washington Ave Bay City, MI | 2.0 | 1.0 | 635 | $1,187 | $1.87 | 44d | 1 | 0.88mi |
| 311 Adams St Unit 2 Bay City, MI | 1.0 | 1.0 | 380 | $695 | $1.83 | 44d | 1 | 1.10mi |
Listing history 23 events
-
2026-06-21days on market $94,000 Active 36 DOM
-
2026-06-19days on market $94,000 Active 34 DOM
-
2026-06-18days on market $94,000 Active 33 DOM
-
2026-06-17days on market $94,000 Active 32 DOM
-
2026-06-16days on market $94,000 Active 31 DOM
-
2026-06-15days on market $94,000 Active 30 DOM
-
2026-06-14pricedays on market $94,000 Active 28 DOM
-
2026-06-12days on market $99,000 Active 27 DOM
-
2026-06-09days on market $99,000 Active 24 DOM
-
2026-06-08days on market $99,000 Active 23 DOM
-
2026-06-07days on market $99,000 Active 22 DOM
-
2026-06-05days on market $99,000 Active 19 DOM
-
2026-06-03days on market $99,000 Active 18 DOM
-
2026-06-02days on market $99,000 Active 17 DOM
-
2026-06-01days on market $99,000 Active 16 DOM
-
2026-05-31pricedays on market $99,000 Active 15 DOM
-
2026-05-30days on market $104,000 Active 14 DOM
-
2026-05-16$109,000 Active
-
2024-09-05soldstatus $64,900
-
2008-08-20soldstatus $15,000
-
2008-07-04$16,000
-
2006-05-03soldstatus $61,500
-
2004-07-23soldstatus $36,050
ⓘ Source: listings_history table (triggers on properties + properties_extension) + one-shot
backfill from property_details.listing_events for pre-trigger history.
Tax reassessment forecast MI · Partial reset (capped growth)
- Current annual tax
- $1,241 · $103/mo
- Projected year-2 tax
- $1,344 · $112/mo
- Expected delta
- +$103/yr (+$9/mo · 8.3%)
ⓘ Screening estimate from a state-policy table — verify with the county assessor before closing.
Climate risk First Street
- Flood 1/10 Low FEMA zone X (unshaded) · 0% chance over 30 yrs
- Wildfire 1/10 Low
- Heat 3/10 Moderate 7 d/yr ≥97°F today · 14 d/yr by 30 yrs out
- Wind 1/10 Low
- Air quality 2/10 Low 1 unhealthy d/yr today · 2 by 30 yrs out
Nearby sold comps map
Loading sold comps map…
Walkable amenities ~0.75 mi
Loading nearby amenities…
Taxation est. · year 1
- Rental income
- $12,331
- − Mortgage interest
- −$5,265
- − Property taxes
- −$1,241
- − Insurance
- −$470
- − Repairs & maintenance
- −$986
- − Management
- −$986
- − Depreciation
- −$2,735
- Taxable income
- $647
- Est. tax owed @ 24.0%
- −$155
- After-tax cash flow
- $1,960/yr
For passive investors: Depreciation is non-cash, so a rental often shows a tax loss while cash-flowing — sheltering income. Rental losses are passive: they offset passive income freely, and up to $25,000/yr can offset ordinary (W-2) income if you actively participate and your MAGI is under $100k (phasing out to $0 by $150k); unused losses carry forward. On sale, claimed depreciation is recaptured at up to 25%, and gains may owe capital-gains tax (a 1031 exchange can defer both). Figures are a year-1 estimate at your 24.0% rate — not tax advice; consult a CPA.
Schools (NCES district)
- District
- Bay City School District
- NCES district ID
- 2604260
- Math proficiency
- 27% ▼ -8.00%
- Reading proficiency
- 40% ▼ -4.00%
- Median HH income
- $43,833
- Composite
- 28.47/100
- National rank
- #6743
- State rank
- #317 of 540 in MI
Livability — Bay City
- Score
- 68/100
- State rank
- #360
- US rank
- #8912
Category grades
Schools grade is shown separately in the Schools card above.
Census & demographics
- Census place
- Bay City, MI
- City population
- 25,635
- Population (ZIP)
- 38,756
Population outlook (Bay County) Hauer SSP2
- Today (2025)
- 101,476 people
- By 2030
- 98,152 · -3.3%
- By 2040
- 89,711 · -11.6%
- By 2050
- 80,614 · -20.6%
- By 2075
- 60,544 · -40.3%
- By 2100
- 41,603 · -59.0%
Race, ethnicity, and origin ACS 2023
- Neighborhood character
- Predominantly White (90%)
- Race & ethnicity
- White 90% Hispanic / Latino 5% Two or more races 4%
- Common ancestry
- Romanian 16% Lithuanian 9% Slovak 2%
- Foreign-born
- 1%
- Languages at home
- 98% English-only · Spanish 1%
Political lean MEDSL · Bay
- 2024 margin
- R (+14.7) · D 42.0% · R 56.7% · Other 1.3%
- 2008→2024 swing
- -30.0pp toward R · 2008: 15.3pp · 2024: -14.7pp
- All cycles
- 2024: R+14.7 2020: R+11.6 2016: R+12.6 2012: D+6.0 2008: D+15.3
Not yet ingested
- Civics
- —
Market trends
- HPI YoY
- ▼ -133.29%
- Current HPI
- 203.6444
- Rent YoY
- —
- Metro
- —
- State GDP YoY
- ▲ 1.37%
- F500 in state
- 28
Industry mix (Fortune 500 HQ in MI)
| Industry | F500 HQs | Revenue |
|---|---|---|
| Automotive Parts | 3 | $48B |
|
||
| Automotive | 2 | $372B |
|
||
| Chemicals | 1 | $45B |
|
||
| Automotive Retail | 1 | $29B |
|
||
| Healthcare / Medical Devices | 1 | $23B |
|
||
| Automotive Technology | 1 | $20B |
|
||
Price history
+202.4% since first listed6 events — show timeline
- 2026-05-16 Listed $109,000 MiRealSource-MiMLS
- 2024-09-05 Sold (Public Records) $64,900 Public Records
- 2008-08-20 Sold (MLS) $15,000 MiRealSource-MiMLS
- 2008-07-04 Listed $16,000 MiRealSource-MiMLS
- 2006-05-03 Sold (Public Records) $61,500 Public Records
- 2004-07-23 Sold (Public Records) $36,050 Public Records
Property tax history
+4.3%/yrLatest (2025): $1,241 · +24.2% YoY. Source: county tax records.
Cash-flow waterfall
monthlySold comps — $/sqft
last 12 mo · ≤1 miLoading sold comps…