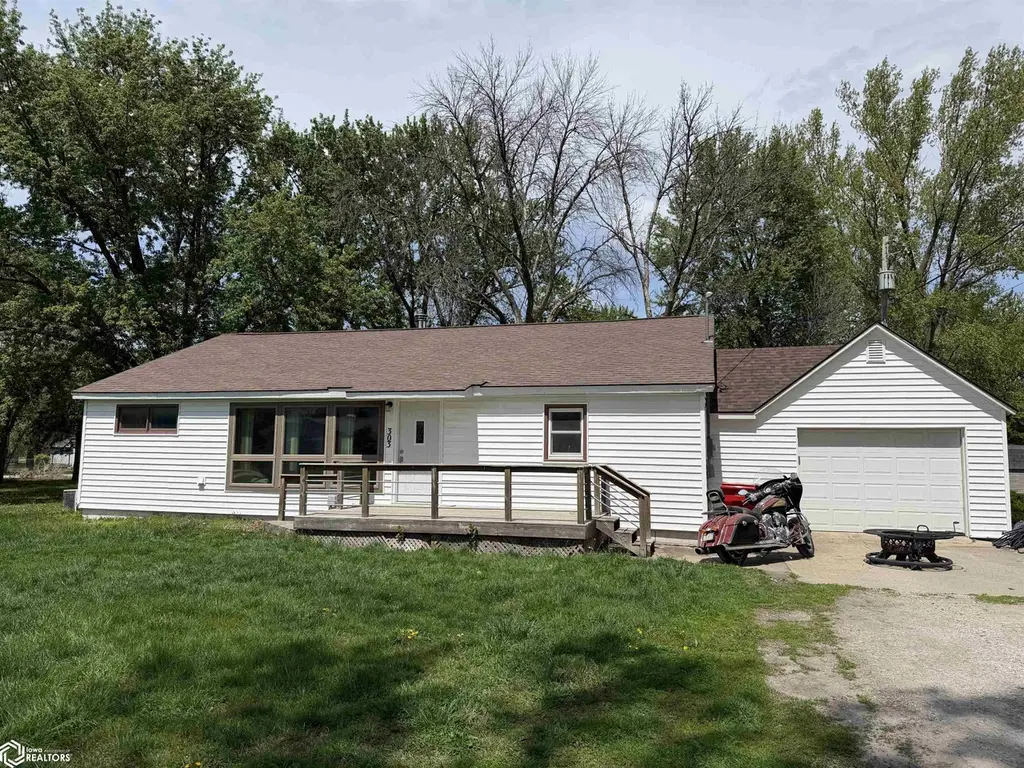
303 3rd Avenue North Ave · Humboldt, IA
Flood risk No data
- FEMA flood zone
- —
- Chance of flooding over 30 yrs
- —
- Est. flood insurance / yr
- —
Fire risk No data
- Est. fire insurance / yr
- —
Heat risk No data
- Hot days now (above threshold)
- —
- Hot days in 30 yrs
- —
Wind risk No data
- Chance of severe wind over 30 yrs
- —
Air-quality risk No data
- Unhealthy air days now
- —
- Unhealthy air days in 30 yrs
- —
Risk factors via First Street. Map © Google.
Why this score? — see what drove the C+ grade
The composite is a weighted blend of 9 inputs, each scored 0–100. Each bar is that input's sub-score; the figure is the points it added to the 100-point composite (weight × sub-score).
- Cash flow +19.6/30.0
- ARV discount +15.0/15.0
- DSCR +6.2/10.0
- Schools +6.2/10.0
- 1% rule +5.2/10.0
- Livability +4.2/5.0
- Rent growth +2.5/5.0
- Condition / age +2.2/5.0
- Appreciation +0.0/10.0
$119,900
🖨 Deal sheet 📄 Offer letter ✓ Due diligence
Listing remarks
STEP INSIDE TO FIND A WARM AND WELCOMING OPEN FLOOR PLAN FEATURING 3 BEDROOMS, A COZY WOODBURNING FIREPLACE-PERFECT FOR RELAXING EVENINGS (FIREPLACE WAS INSPECTED AT TIME OF PURCHASE), NEW CEILING FANS AND LIGHT FIXTURES, NEW FRONT DOOR, LARGE NEWER LIVING ROOM WINDOW BRINGING IN AMAZING LIGHT. SPACIOUS MUD ROOM, YOU'LL ALSO APPRECIATE THE FRESHLY CLEANED AIR DUCTS AND TANKLESS WATER HEATER. FENCED BACK YARD, SHED WITH ELECTRICITY. SINGLE-LEVEL LIVING FOR YOUR CONVENIENCE - DON'T MISS YOUR CHANCE TO MAKE IT YOURS!!!
Key facts
- Open floor plan
- Spacious mud room
- New ceiling fans
Tags
Property features AI
Finance
- Financial info: Annual tax approximately $1,206
Exterior
- Parking: Attached garage with 1 space
- Utilities: Public water; Public sewer; 200+ amp electric service
- Home design: Single-family residence
- Construction: Vinyl siding construction
- Exterior features: Vinyl siding; Lot approximately 77'5" x 132'
Interior
- Bathrooms: 1 full bathroom
- Interior features: Central air conditioning; Forced air heating
Neighborhood map
What this means for you Summary
Snapshot
- This is a 3-bed/1.0-bath single-family listed at $120k. Condition is rated fair.
Deal economics
- At list price, monthly cash flow is $139 ($2k/yr) — positive.
- The deal already cash-flows at list — no discount required.
- Meets the 1% rule at list price ($1k rent vs $120k).
- Recommended offer: $116k (3.0% below list) — sets the bar for market timing.
- Cap rate 7.7% vs local median 3.8% in Humboldt — top-decile yield for the area; either an underpriced asset or a hidden risk that comps aren't pricing in. Stress-test before assuming the spread holds.
Location & tenants
- Location reads 83/100 on livability (#34 in IA, #1,000 nationally) — a professional / high-income tenant draw. Strengths: schools A+, cost of living A+, housing A+; Watch: amenities F, commute F.
- Humboldt Community School District (town): math 75% / reading 72% proficiency, ranked #92 of 289 in IA (top 32%) — strong family-tenant draw, lease renewals of 3-5y typical.
- Market conditions: 62 active listings in the ZIP; 13 units permitted in Humboldt County in 2024 (0 in 5+ unit buildings).
Forward outlook
- Local home prices are declining (-3.0%/yr); year-one equity from $829 of loan paydown is wiped out by about $4k of value loss. Plan a longer hold.
- Humboldt County population projected to shrink 9% by 2050 — rents likely to lag national; underwrite the cash flow, not the appreciation.
Negotiation context
- It's been on market 44 days — a 3% lower offer ($116k) is reasonable based on typical stale-listing flexibility.
Risks & watch-outs
- Watch-outs: built in 1945 — expect roof / HVAC / electrical / plumbing capex.
Questions for the listing agent
- It's been on market 44 days. Have you received any prior offers? Is the seller open to a 3% concession, seller financing, or rate buy-down credit?
- Have any recent inspections been done? Can we get a copy of the seller's disclosures and any deferred-maintenance estimates?
- Built in 1945 — when were the roof, HVAC, electrical panel, plumbing, and water heater last replaced?
- Is there a deadline driving the sale (1031 exchange, divorce, estate, relocation)? That informs how much negotiation room exists.
- Schools are A-rated — typically a magnet for longer-tenancy family renters. What's the average tenant stay here, and is there a school-zone premium baked into asking?
- What's the average days-on-market for RENTAL listings here right now (not sales)? A rising rental-DOM trend means longer vacancies and softer asking-rent achievability than the comps imply.
- What's the recent tenant-quality profile in this submarket — average credit score on applications, eviction rate, late-payment / NSF rate, and stable-employment percentage? A property-management company in the area should have these aggregated.
- How much new for-sale + rental construction is in the pipeline within 1–3 miles? Heavy new supply typically softens prices + rents 12–24 months out; constrained supply supports both.
Investment metrics
- 1% rule
- 1.02% ✓
- Cap rate
- 7.69%
- Cash-on-cash
- 4.97%
- DSCR
- 1.22
- GRM
- 8.2
CMA / ARV
- ARV (median comp)
- $155,374
- List price
- $119,900
- Delta
- -22.83%
- Verdict
- UNDERPRICED
- Comps
- 20 within 1.0 mi
Show comp detail 12 sales within ~0.75 mi
| Address | Dist | Beds/Ba | Sqft | Sold | Price | $/sf | Match |
|---|---|---|---|---|---|---|---|
| 308 2nd St N | 0.10mi | 3/2.0 | 1,252 (-11%) | 0mo | $195,000 | $156 | 73 |
| 509 6th Ave N | 0.27mi | 3/2.5 | 1,501 (+7%) | 8mo | $155,000 | $103 | 64 |
| 102 5th St N | 0.24mi | 2/2.0 (-1) | 1,334 (-5%) | 9mo | $115,000 | $86 | 63 |
| 208 3rd Ave Ave N | 0.09mi | 3/2.5 | 1,544 (+10%) | 12mo | $169,000 | $109 | 63 |
| 815 10th St N | 0.66mi | 3/1.0 | 1,329 (-6%) | 5mo | $218,000 | $164 | 56 |
| 508 8th St N | 0.41mi | 4/1.0 (+1) | 1,530 (+9%) | 7mo | $100,000 | $65 | 56 |
| 1006 5th Ave N | 0.56mi | 3/2.0 | 1,290 (-8%) | 1mo | $145,155 | $113 | 56 |
| 607 8th St N | 0.42mi | 3/2.0 | 1,608 (+14%) | 7mo | $135,000 | $84 | 47 |
| 306 5th St N | 0.54mi | 3/2.0 | 1,204 (-14%) | 3mo | $189,250 | $157 | 44 |
| 1114 7th Ave N | 0.71mi | 3/1.5 | 1,578 (+12%) | 6mo | $172,000 | $109 | 40 |
| 812 9th St N | 0.61mi | 3/3.0 | 1,260 (-10%) | 10mo | $140,000 | $111 | 37 |
| 308 4th St S | 0.74mi | 3/1.5 | 1,200 (-15%) | 7mo | $152,000 | $127 | 33 |
Match score weights: distance 35% · size 25% · config 20% · recency 20%. Top-matched comps best support the ARV.
Projected returns pro-forma
-3.0% appreciation · 3.0% rent growth · sell at horizon
- IRR
- -8.6%
- Equity multiple
- 0.69×
- Total profit
- $-10,551
- Equity at exit
- $17,877
- IRR
- 1.0%
- Equity multiple
- 1.07×
- Total profit
- $2,295
- Equity at exit
- $10,367
Cash invested: $33,572 (down + closing). Projections, not guarantees.
Landlord ↔ Tenant lean methodology
- Overall (STATE)
- 83 Strongly Landlord-Friendly
- State Iowa
- 83 Strongly Landlord-Friendly · R+6
- County
- — inherits STATE
- City
- — inherits STATE
ZIP-level market 50548
- Home prices YoY
- -20.0%
- Active inventory
- 62
- Price-to-rent
- 8.2×
Monthly cashflow live
- Estimated rent
- $1,225 medium interval (Pro) →
- Mortgage (P&I)
- −$629
- Tax est. 1.5%
- −$150 /mo · $1,798/yr
- Insurance
- −$50
- HOA
- −$0
- Vacancy / Maint / Mgmt
- −$257
- Net cashflow
- $139
Break-even live
UW: 25.0% down · 7.5% · 30yr · 1.5% tax · 5.0% vac · 8.0% maint · 8.0% mgmt
Financing live
Cash to close
- Down payment
- $29,975
- Closing costs
- $3,597
- Reserves months
- —
- Total cash needed
- —
Loan-product check · same deal, 3 products live
Conventional
25% down · 7.5% · 30yr
- Down + closing
- —
- Monthly P&I
- —
- Monthly cashflow
- —
- DSCR
- —
- Eligible?
- —
Personal DTI + credit; lowest rate.
DSCR
20% down · 8.5% · 30yr
- Down + closing
- —
- Monthly P&I
- —
- Monthly cashflow
- —
- DSCR
- —
- Eligible?
- —
No personal income docs; deal must DSCR.
Hard money
10% down · 12.0% · 12mo
- Down + closing
- —
- Monthly P&I
- —
- Monthly cashflow
- —
- DSCR
- —
- Eligible?
- —
Short-term bridge; refi at stabilization.
Listing history 18 events
-
2026-06-19days on market $119,900 Active 44 DOM
-
2026-06-18days on market $119,900 Active 43 DOM
-
2026-06-17days on market $119,900 Active 42 DOM
-
2026-06-16days on market $119,900 Active 41 DOM
-
2026-06-15days on market $119,900 Active 40 DOM
-
2026-06-14days on market $119,900 Active 38 DOM
-
2026-06-12days on market $119,900 Active 37 DOM
-
2026-06-09days on market $119,900 Active 34 DOM
-
2026-06-08days on market $119,900 Active 33 DOM
-
2026-06-07days on market $119,900 Active 32 DOM
-
2026-06-05days on market $119,900 Active 29 DOM
-
2026-06-03days on market $119,900 Active 28 DOM
-
2026-06-02days on market $119,900 Active 27 DOM
-
2026-06-01days on market $119,900 Active 26 DOM
-
2026-05-31days on market $119,900 Active 25 DOM
-
2026-05-30days on market $119,900 Active 24 DOM
-
2026-05-17price $119,900 521-char remark
-
2026-05-06$124,900 Active 521-char remark
ⓘ Source: listings_history table (triggers on properties + properties_extension) + one-shot
backfill from property_details.listing_events for pre-trigger history.
Nearby sold comps map
Loading sold comps map…
Walkable amenities ~0.75 mi
Loading nearby amenities…
Taxation est. · year 1
- Rental income
- $14,699
- − Mortgage interest
- −$6,716
- − Property taxes
- −$1,798
- − Insurance
- −$600
- − Repairs & maintenance
- −$1,176
- − Management
- −$1,176
- − Depreciation
- −$3,488
- Taxable loss
- −$255
- Est. tax savings @ 24.0%
- +$61
- After-tax cash flow
- $1,730/yr
For passive investors: Depreciation is non-cash, so a rental often shows a tax loss while cash-flowing — sheltering income. Rental losses are passive: they offset passive income freely, and up to $25,000/yr can offset ordinary (W-2) income if you actively participate and your MAGI is under $100k (phasing out to $0 by $150k); unused losses carry forward. On sale, claimed depreciation is recaptured at up to 25%, and gains may owe capital-gains tax (a 1031 exchange can defer both). Figures are a year-1 estimate at your 24.0% rate — not tax advice; consult a CPA.
Condition & rehab AI · 13 photos
The home requires moderate repairs and updates to improve its condition and value. Consider new flooring, painting, and HVAC upgrades for a significant boost in resale and rental value.
Repairs flagged
- Moderate siding — weathered appearance
- Moderate paint — existing paint on interior walls
- Minor flooring — existing carpet in living areas
Value-add opportunities
- Both new flooring — improves aesthetics and durability
- Both paint job — enhances curb appeal and interior aesthetics
- Both new HVAC system — increases comfort and energy efficiency
Renovation cost estimate screening
| Repair item | Severity | Est. cost |
|---|---|---|
| siding · weathered appearance | Moderate | $3,000–15,000 |
| paint · existing paint on interior walls | Moderate | $3,000–15,000 |
| flooring · existing carpet in living areas | Minor | $500–3,000 |
| Total estimated repair cost · 3 items | $6,500–33,000 |
Value-add ROI direction
- Both new flooring — improves aesthetics and durability ↑
- Both paint job — enhances curb appeal and interior aesthetics ↑
- Both new HVAC system — increases comfort and energy efficiency ↑
ⓘ Cost ranges are severity-bucket heuristics (US national rule-of-thumb). Get contractor quotes + a written scope before underwriting a rehab budget.
Schools (NCES district)
- District
- Humboldt Community School District
- NCES district ID
- 1914370
- Math proficiency
- 75% ▼ -5.00%
- Reading proficiency
- 72% ▼ -7.00%
- Median HH income
- $48,318
- Composite
- 62.13/100
- National rank
- #707
- State rank
- #92 of 289 in IA
Livability — Humboldt
- Score
- 83/100
- State rank
- #34
- US rank
- #1000
Category grades
Schools grade is shown separately in the Schools card above.
Census & demographics
- Census place
- Humboldt, IA
- City population
- 5,482
- Population (ZIP)
- 5,482
Population outlook (Humboldt County) Hauer SSP2
- Today (2025)
- 9,265 people
- By 2030
- 9,141 · -1.3%
- By 2040
- 8,904 · -3.9%
- By 2050
- 8,448 · -8.8%
- By 2075
- 7,742 · -16.4%
- By 2100
- 6,414 · -30.8%
Race, ethnicity, and origin ACS 2023
- Neighborhood character
- Predominantly White (94%)
- Race & ethnicity
- White 94% Two or more races 5% Hispanic / Latino 4% Asian 1%
- Common ancestry
- Portuguese 14% Iranian 2% Italian 1%
- Foreign-born
- 3% · Canada
- Languages at home
- 97% English-only · Spanish 3%
Political lean MEDSL · Humboldt
- 2024 margin
- Solid R (+50.0) · D 24.4% · R 74.4% · Other 1.2%
- 2008→2024 swing
- -35.7pp toward R · 2008: -14.3pp · 2024: -50.0pp
- All cycles
- 2024: R+50.0 2020: R+44.6 2016: R+46.0 2012: R+22.1 2008: R+14.3
Not yet ingested
- Civics
- —
Market trends
- HPI YoY
- ▼ -51.69%
- Current HPI
- 206.5373
- Rent YoY
- —
- Metro
- —
- State GDP YoY
- ▲ 2.48%
- F500 in state
- 4
Industry mix (Fortune 500 HQ in IA)
| Industry | F500 HQs | Revenue |
|---|---|---|
| Financial Services | 1 | $16B |
|
||
| Retail / Convenience | 1 | $15B |
|
||
Price history
-4.0% since first listed2 events — show timeline
- 2026-05-17 Price Changed $119,900 IAR
- 2026-05-06 Listed $124,900 IAR
Cash-flow waterfall
monthlySold comps — $/sqft
last 12 mo · ≤1 miLoading sold comps…