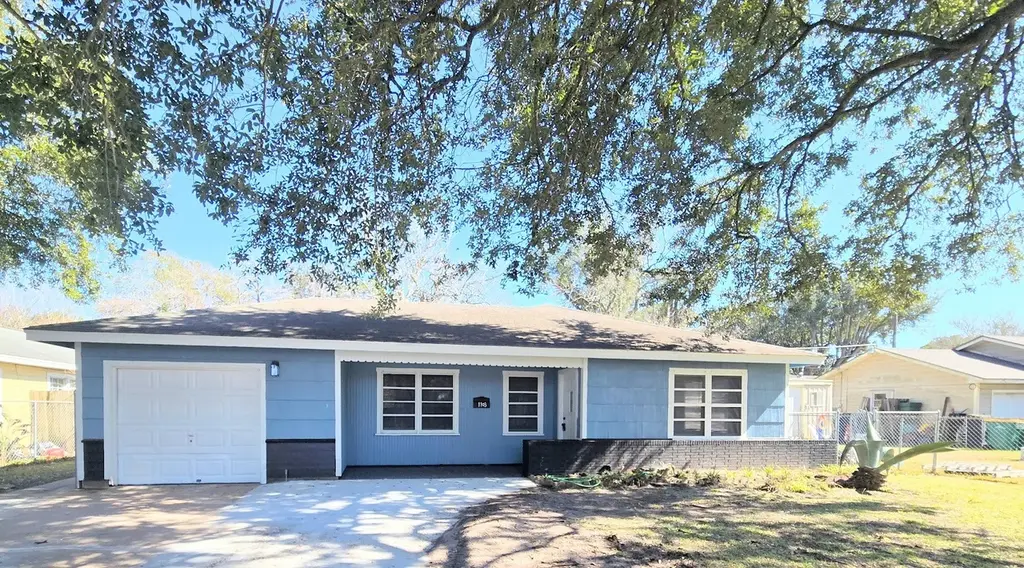
1103 W Camp Cir · La Marque, TX
Flood risk 6/10 · Moderate
- FEMA flood zone
- X (shaded)
- Chance of flooding over 30 yrs
- 0.69%
- Est. flood insurance / yr
- $507 – $1,088
Fire risk 3/10 · Minor
- Est. fire insurance / yr
- $1,222 – $2,270
Heat risk 10/10 · Severe
- Hot days now (above 110°F)
- 7 days/yr
- Hot days in 30 yrs
- 27 days/yr
Wind risk 10/10 · Severe
- Chance of severe wind over 30 yrs
- 99.0%
Air-quality risk 3/10 · Minor
- Unhealthy air days now
- 2 days/yr
- Unhealthy air days in 30 yrs
- 2 days/yr
Risk factors via First Street. Map © Google.
Why this score? — see what drove the D- grade
The composite is a weighted blend of 9 inputs, each scored 0–100. Each bar is that input's sub-score; the figure is the points it added to the 100-point composite (weight × sub-score).
- Cash flow +16.8/30.0
- DSCR +5.2/10.0
- 1% rule +4.0/10.0
- Rent growth +3.5/5.0
- Livability +3.0/5.0
- Condition / age +2.5/5.0
- Schools +2.4/10.0
- ARV discount +2.3/15.0
- Appreciation +0.0/10.0
$179,000
🖨 Deal sheet (PDF) 📄 Offer letter ✓ Due diligence
Listing remarks MLS
Step into this thoughtfully updated 3-bedroom, 2-bath home where modern upgrades meet everyday comfort. The inviting entrance welcomes you into a refreshed interior featuring stylish finishes and a functional layout. The kitchen offers ample cabinet space, perfect for storage and easy organization, while both full bathrooms have been fully updated with clean, contemporary details. Outside, enjoy a large fenced backyard ideal for entertaining, pets, or future possibilities, along with a spacious driveway that provides plenty of parking. This move-in-ready home blends modern appeal with practical living.
Key facts
- Updated interior
- Ample cabinet space
- Spacious driveway
Tags
Neighborhood map
What this means for you Summary
Snapshot
- This is a 3-bed/1.0-bath single-family listed at $179k.
Deal economics
- At list price, monthly cash flow is $113 ($1k/yr) — positive.
- The deal already cash-flows at list — no discount required.
- To meet the 1% rule (rent ≥ 1% of price), the offer needs to be $162k (9.8% below list).
- Recommended offer: $162k (9.8% below list) — sets the bar for 1% rule.
- Cap rate 7.1% vs local median 5.6% in La Marque — meaningfully above typical; check what's discounted (condition, days-on-market, listing class) to confirm the premium yield is real.
Location & tenants
- Location reads 59/100 on livability (#1,136 in TX) — a working-class tenant base; expect higher turnover. Strengths: cost of living A+, housing A+; Watch: employment D, schools F, crime F.
- Texas City ISD (suburban): math 28% / reading 29% proficiency, ranked #655 of 826 in TX (top 79%) — low school quality limits family demand, transient renter base, plan for 1-2y turnover; 66% free/reduced lunch — lower-income household profile, screen leases tightly.
- Market conditions: Rents rising (+4.0%/yr); 661 active listings in the ZIP; 10 comparable units currently listed for rent nearby; rentals at typical pace (median 26d on market — plan ~3-4 weeks tenant-placement turnaround); 40% of comp listings sitting > 30 days — soft ceiling on asking rent; 3,258 units permitted in Galveston County in 2024 (0 in 5+ unit buildings).
Forward outlook
- Local home prices are declining (-3.0%/yr); year-one equity from $1k of loan paydown is wiped out by about $5k of value loss. Plan a longer hold.
- Galveston County population projected at +43% by 2050 — long-run rental-demand tailwind backs the buy-and-hold thesis.
Negotiation context
- It's been on market 117 days — a 9% lower offer ($163k) is reasonable based on typical stale-listing flexibility.
Risks & watch-outs
- Climate carrying-cost: major flood risk; severe wind risk, 99% chance of damaging wind over 30y; extreme-heat days projected 7→27/yr by 2055 (HVAC capex compounding) — expect insurance premiums to compound above CPI over the hold.
Questions for the listing agent
- It's been on market 117 days. Have you received any prior offers? Is the seller open to a 10% concession, seller financing, or rate buy-down credit?
- Built in 1962 — when were the roof, HVAC, electrical panel, plumbing, and water heater last replaced?
- Why hasn't it sold? Are there any deal-killer items the seller is aware of (foundation, flood, title, zoning, code violations)?
- Is there a deadline driving the sale (1031 exchange, divorce, estate, relocation)? That informs how much negotiation room exists.
- Schools are F-rated, which usually means shorter tenancies and higher turnover. Who's the typical renter profile here, and what's been the actual vacancy rate?
- Crime grade is F in this area — have there been break-ins, vandalism, or insurance claims at this property in the last 3 years? What carrier currently insures it and at what premium?
- The area grade is low — what's the realistic commute time and amenity access for the typical tenant pool here? Any planned neighborhood developments (good or bad) we should know about?
- What's the average days-on-market for RENTAL listings here right now (not sales)? A rising rental-DOM trend means longer vacancies and softer asking-rent achievability than the comps imply.
- What's the recent tenant-quality profile in this submarket — average credit score on applications, eviction rate, late-payment / NSF rate, and stable-employment percentage? A property-management company in the area should have these aggregated.
- How much new for-sale + rental construction is in the pipeline within 1–3 miles? Heavy new supply typically softens prices + rents 12–24 months out; constrained supply supports both.
Investment metrics
- 1% rule
- 0.90% ✗
- Cap rate
- 7.05%
- Cash-on-cash
- 2.71%
- DSCR
- 1.12
- GRM
- 9.2
CMA / ARV
- ARV (median comp)
- $160,313
- List price
- $179,000
- Delta
- 11.66%
- Verdict
- OVERPRICED
- Comps
- 20 within 1.0 mi
Show comp detail 12 sales within ~0.75 mi
| Address | Dist | Beds/Ba | Sqft | Sold | Price | $/sf | Match |
|---|---|---|---|---|---|---|---|
| 2901 N Houston Dr | 0.12mi | 2/1.0 (-1) | 1,098 (-10%) | 2mo | $105,000 | $96 | 71 |
| 1815 Thompson St | 0.46mi | 3/2.0 | 1,250 (+2%) | 1mo | $199,000 | $159 | 70 |
| 2026 Rosalee St | 0.43mi | 3/2.0 | 1,270 (+4%) | 1mo | $189,000 | $149 | 68 |
| 2904 Fannin St | 0.25mi | 2/1.0 (-1) | 1,100 (-10%) | 1mo | $107,500 | $98 | 66 |
| 118 Brown St | 0.58mi | 3/1.0 | 1,275 (+4%) | 1mo | $205,000 | $161 | 65 |
| 504 Raymond St | 0.44mi | 3/2.0 | 1,313 (+8%) | 2mo | $120,000 | $91 | 61 |
| 3029 Taylor St | 0.53mi | 3/1.0 | 1,330 (+9%) | 1mo | $135,000 | $102 | 59 |
| 1405 Austin St | 0.33mi | 3/2.0 | 1,389 (+14%) | 1mo | $235,000 | $169 | 57 |
| 2709 Virginia St | 0.37mi | 2/2.0 (-1) | 1,365 (+12%) | 0mo | $183,500 | $134 | 54 |
| 208 Preston St | 0.64mi | 3/1.0 | 1,364 (+12%) | 1mo | $157,999 | $116 | 50 |
| 1708 Rosalee St | 0.62mi | 2/2.0 (-1) | 1,316 (+8%) | 1mo | $180,000 | $137 | 48 |
| 606 Roosevelt St | 0.70mi | 3/1.5 | 1,092 (-10%) | 4mo | $179,900 | $165 | 45 |
Match score weights: distance 35% · size 25% · config 20% · recency 20%. Top-matched comps best support the ARV.
Projected returns pro-forma
-3.0% appreciation · 3.95% rent growth · sell at horizon
- IRR
- -11.0%
- Equity multiple
- 0.60×
- Total profit
- $-20,256
- Equity at exit
- $26,689
- IRR
- -0.5%
- Equity multiple
- 0.96×
- Total profit
- $-1,918
- Equity at exit
- $15,477
Cash invested: $50,120 (down + closing). Projections, not guarantees.
Landlord ↔ Tenant lean methodology
- Overall (STATE)
- 87 Strongly Landlord-Friendly
- State Texas
- 87 Strongly Landlord-Friendly · R+5
- County
- — inherits STATE
- City
- — inherits STATE
ZIP-level market 77568
- Home prices YoY
- -22.7%
- Rents YoY
- 4.0%
- Active inventory
- 661
- Price-to-rent
- 9.2×
Monthly cashflow live
- Estimated rent
- $1,615 high interval (Pro) →
- Mortgage (P&I)
- −$939
- Tax from tax record
- −$150 /mo · $1,795/yr
- Insurance
- −$75
- HOA
- −$0
- Vacancy / Maint / Mgmt
- −$339
- Net cashflow
- $113
Break-even live
Sensitivity live
| Price | -10% $215 | -5% $164 | +0% $113 | +5% $63 | +10% $12 |
|---|---|---|---|---|---|
| Rent | -10% $-14 | -5% $49 | +0% $113 | +5% $177 | +10% $241 |
| Rate | -1.0pp $203 | -0.5pp $159 | base $113 | +0.5pp $67 | +1.0pp $20 |
UW: 25.0% down · 7.5% · 30yr · 1.5% tax · 5.0% vac · 8.0% maint · 8.0% mgmt
Financing live
Cash to close
- Down payment
- $44,750
- Closing costs
- $5,370
- Reserves months
- —
- Total cash needed
- —
Loan-product check · same deal, 3 products live
Conventional
25% down · 7.5% · 30yr
- Down + closing
- —
- Monthly P&I
- —
- Monthly cashflow
- —
- DSCR
- —
- Eligible?
- —
Personal DTI + credit; lowest rate.
DSCR
20% down · 8.5% · 30yr
- Down + closing
- —
- Monthly P&I
- —
- Monthly cashflow
- —
- DSCR
- —
- Eligible?
- —
No personal income docs; deal must DSCR.
Hard money
10% down · 12.0% · 12mo
- Down + closing
- —
- Monthly P&I
- —
- Monthly cashflow
- —
- DSCR
- —
- Eligible?
- —
Short-term bridge; refi at stabilization.
Rent comps 10 comps
| Address | Beds | Baths | Sqft | Rent | $/sqft | DOM | Units | Dist |
|---|---|---|---|---|---|---|---|---|
| 1006 E Camp Cir La Marque, TX | 3.0 | 1.0 | 1230 | $1,500 | $1.22 | 26d | 1 | 0.04mi |
| 1013 Margot St La Marque, TX | 3.0 | 2.0 | 1099 | $1,500 | $1.36 | 20d | 1 | 0.21mi |
| 306 Lake Rd Unit B La Marque, TX | 2.0 | 1.0 | 816 | $995 | $1.22 | 45d | 1 | 0.51mi |
| 2328 Boss St La Marque, TX | 2.0 | 1.0 | 848 | $925 | $1.09 | 14d | 2 | 0.52mi |
| 2729 Main St La Marque, TX | 2.0 | 1.0–2.0 | 864 | $950 | $1.10 | 0d | 3 | 0.79mi |
| 309 S Bell Dr Texas City, TX | 2.0 | 2.0 | 1316 | $1,650 | $1.25 | 45d | 1 | 0.90mi |
| 1825 Bayou Rd La Marque, TX | 2.0 | 1.0 | 1200 | $1,195 | $1.00 | 45d | 1 | 0.96mi |
| 203 Beatrice St La Marque, TX | 3.0 | 1.0 | 1304 | $1,395 | $1.07 | 26d | 1 | 1.03mi |
| 7510 Hummingbird Ln Texas City, TX | 3.0 | 1.5 | 1200 | $1,550 | $1.29 | 4d | 1 | 1.06mi |
| 711 Avenue A Unit 4 La Marque, TX | 2.0 | 1.0 | 750 | $799 | $1.07 | 45d | 1 | 1.40mi |
Listing history 5 events
-
2026-04-29price $179,000 609-char remark
Show marketing remark (609 chars)
Step into this thoughtfully updated 3-bedroom, 2-bath home where modern upgrades meet everyday comfort. The inviting entrance welcomes you into a refreshed interior featuring stylish finishes and a functional layout. The kitchen offers ample cabinet space, perfect for storage and easy organization, while both full bathrooms have been fully updated with clean, contemporary details. Outside, enjoy a large fenced backyard ideal for entertaining, pets, or future possibilities, along with a spacious driveway that provides plenty of parking. This move-in-ready home blends modern appeal with practical living.
-
2026-03-02price $186,000 609-char remark
Show marketing remark (609 chars)
Step into this thoughtfully updated 3-bedroom, 2-bath home where modern upgrades meet everyday comfort. The inviting entrance welcomes you into a refreshed interior featuring stylish finishes and a functional layout. The kitchen offers ample cabinet space, perfect for storage and easy organization, while both full bathrooms have been fully updated with clean, contemporary details. Outside, enjoy a large fenced backyard ideal for entertaining, pets, or future possibilities, along with a spacious driveway that provides plenty of parking. This move-in-ready home blends modern appeal with practical living.
-
2026-01-29$205,000 Active 609-char remark
Show marketing remark (609 chars)
Step into this thoughtfully updated 3-bedroom, 2-bath home where modern upgrades meet everyday comfort. The inviting entrance welcomes you into a refreshed interior featuring stylish finishes and a functional layout. The kitchen offers ample cabinet space, perfect for storage and easy organization, while both full bathrooms have been fully updated with clean, contemporary details. Outside, enjoy a large fenced backyard ideal for entertaining, pets, or future possibilities, along with a spacious driveway that provides plenty of parking. This move-in-ready home blends modern appeal with practical living.
-
2025-09-02soldstatus
-
2018-09-27soldstatus
ⓘ Source: listings_history table (triggers on properties + properties_extension) + one-shot
backfill from property_details.listing_events for pre-trigger history.
Tax reassessment forecast TX · Resets to sale price
- Current annual tax
- $1,795 · $150/mo
- Projected year-2 tax
- $3,276 · $273/mo
- Expected delta
- +$1,480/yr (+$123/mo · 82.4%)
ⓘ Screening estimate from a state-policy table — verify with the county assessor before closing.
Climate risk First Street
- Flood 6/10 Major FEMA zone X (shaded) · 69% chance over 30 yrs
- Wildfire 3/10 Moderate
- Heat 10/10 Extreme 7 d/yr ≥110°F today · 27 d/yr by 30 yrs out
- Wind 10/10 Extreme 99% chance of damaging wind over 30 yrs
- Air quality 3/10 Moderate 2 unhealthy d/yr today · 2 by 30 yrs out
Nearby sold comps map
Loading sold comps map…
Walkable amenities ~0.75 mi
Loading nearby amenities…
Taxation est. · year 1
- Rental income
- $19,384
- − Mortgage interest
- −$10,027
- − Property taxes
- −$1,795
- − Insurance
- −$895
- − Repairs & maintenance
- −$1,551
- − Management
- −$1,551
- − Depreciation
- −$5,207
- Taxable loss
- −$1,642
- Est. tax savings @ 24.0%
- +$394
- After-tax cash flow
- $1,753/yr
For passive investors: Depreciation is non-cash, so a rental often shows a tax loss while cash-flowing — sheltering income. Rental losses are passive: they offset passive income freely, and up to $25,000/yr can offset ordinary (W-2) income if you actively participate and your MAGI is under $100k (phasing out to $0 by $150k); unused losses carry forward. On sale, claimed depreciation is recaptured at up to 25%, and gains may owe capital-gains tax (a 1031 exchange can defer both). Figures are a year-1 estimate at your 24.0% rate — not tax advice; consult a CPA.
Schools (NCES district)
- District
- Texas City ISD
- NCES district ID
- 4842510
- Math proficiency
- 28% ▼ -10.00%
- Reading proficiency
- 29% ▼ -4.00%
- Median HH income
- $44,875
- Composite
- 24.47/100
- National rank
- #7664
- State rank
- #655 of 826 in TX
Livability — La Marque
- Score
- 59/100
- State rank
- #1136
- US rank
- #20037
Category grades
Schools grade is shown separately in the Schools card above.
Census & demographics
- Census place
- La Marque, TX
- County
- Galveston County · 357,330 people
- City population
- 23,083
- Metro
- Houston-The Woodlands-Sugar Land, TX
- Population (ZIP)
- 23,083
- Household income
- $74,694
- Rent vs Own
- Severe rent burden
- 700.0
Population outlook (Galveston County) Hauer SSP2
- Today (2025)
- 390,640 people
- By 2030
- 425,226 · +8.9%
- By 2040
- 493,765 · +26.4%
- By 2050
- 559,698 · +43.3%
- By 2075
- 719,260 · +84.1%
- By 2100
- 819,628 · +109.8%
Race, ethnicity, and origin ACS 2023
- Neighborhood character
- Highly diverse neighborhood (Simpson 0.71)
- Race & ethnicity
- White 37% Hispanic / Latino 29% Black 26% Two or more races 17% Asian 3%
- Hispanic origin (detail)
- Mexican 22% Puerto Rican 1%
- Common ancestry
- Lithuanian 1% Italian 1% Serbian 1%
- Foreign-born
- 8% · Canada
- Languages at home
- 77% English-only · Spanish 21% Tagalog/Filipino 1% Other Asian/Pacific 1%
Political lean MEDSL · Galveston
- 2024 margin
- Strong R (+27.4) · D 35.7% · R 63.1% · Other 1.2%
- 2008→2024 swing
- -7.9pp toward R · 2008: -19.5pp · 2024: -27.4pp
- All cycles
- 2024: R+27.4 2020: R+22.6 2016: R+22.6 2012: R+26.9 2008: R+19.5
Not yet ingested
- Civics
- —
Market trends
- HPI YoY
- ▼ -69.39%
- Current HPI
- 236.0239
- Rent YoY
- ▲ 3.95%
- Metro
- Houston-The Woodlands-Sugar Land, TX
- State GDP YoY
- ▲ 3.95%
- F500 in state
- 110
Industry mix (Fortune 500 HQ in TX)
| Industry | F500 HQs | Revenue |
|---|---|---|
| Energy | 16 | $1,198B |
|
||
| Technology | 5 | $198B |
|
||
| Engineering / Construction | 4 | $72B |
|
||
| Energy Services | 3 | $60B |
|
||
| Utilities | 3 | $41B |
|
||
| Healthcare | 2 | $330B |
|
||
Price history
-12.7% since first listed5 events — show timeline
- 2026-04-29 Price Changed $179,000 HARMLS
- 2026-03-02 Price Changed $186,000 HARMLS
- 2026-01-29 Listed $205,000 HARMLS
- 2025-09-02 Sold (Public Records) — Public Records
- 2018-09-27 Sold (Public Records) — Public Records
Property tax history
+2.8%/yrLatest (2025): $1,795 · +13.3% YoY. Source: county tax records.
Cash-flow waterfall
monthlySold comps — $/sqft
last 12 mo · ≤1 miLoading sold comps…