669 Oakmont Ave #3708 · Winchester, NV
Flood risk 1/10 · Minimal
- FEMA flood zone
- X (unshaded)
- Chance of flooding over 30 yrs
- 0.0%
- Est. flood insurance / yr
- $507 – $1,088
Fire risk 1/10 · Minimal
- Est. fire insurance / yr
- $490 – $910
Heat risk 8/10 · Major
- Hot days now (above 106°F)
- 7 days/yr
- Hot days in 30 yrs
- 18 days/yr
Wind risk 1/10 · Minimal
- Chance of severe wind over 30 yrs
- —
Air-quality risk 3/10 · Minor
- Unhealthy air days now
- 3 days/yr
- Unhealthy air days in 30 yrs
- 4 days/yr
Risk factors via First Street. Map © Google.
Why this score? — see what drove the D grade
The composite is a weighted blend of 9 inputs, each scored 0–100. Each bar is that input's sub-score; the figure is the points it added to the 100-point composite (weight × sub-score).
- Cash flow +13.8/30.0
- ARV discount +7.5/15.0
- DSCR +4.2/10.0
- 1% rule +4.0/10.0
- Livability +4.0/5.0
- Appreciation +3.9/10.0
- Schools +2.6/10.0
- Condition / age +2.5/5.0
- Rent growth +1.7/5.0
$329,000
🖨 Deal sheet (PDF) 📄 Offer letter ✓ Due diligence
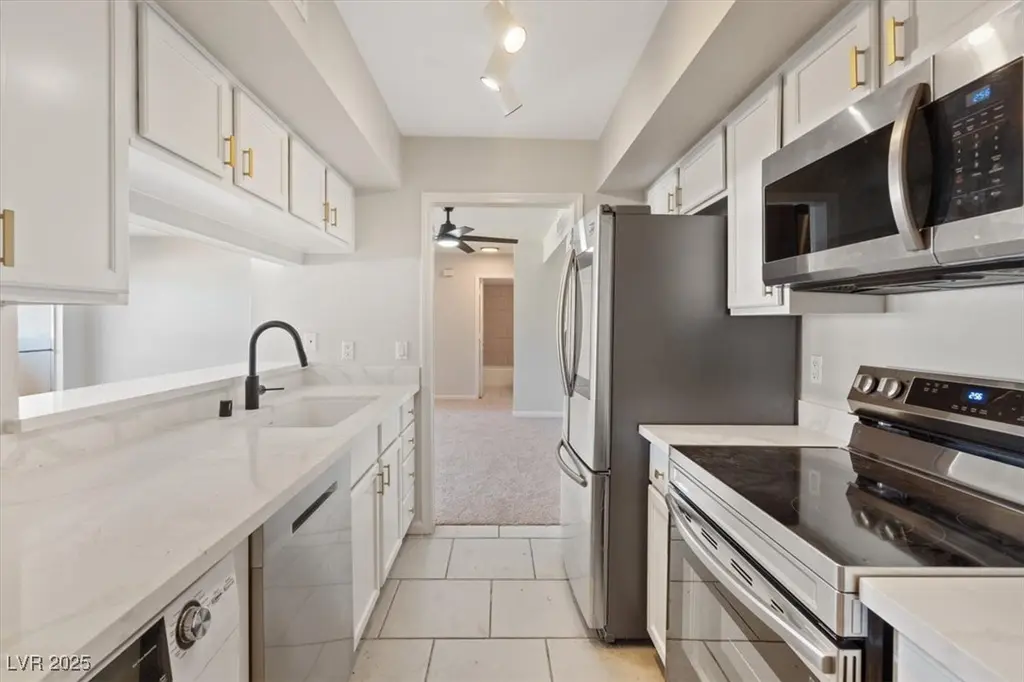
Listing remarks
Fully renovated 3bd/2ba second story condo in the prestigious guard gated community of Las Vegas Country Club! Beautiful galley kitchen with updated white cabinets, gold handles, quartz countertops, new sink, matte black faucets, upgraded stainless steel Samsung appliances (fridge, stove, microwave and DW) and tile flooring. Washer and dryer included in kitchen area. Opens to a dining area with matte black ceiling fan, new carpet, designer light fixtures and walk in closets. Third bedroom has custom built-in shelves that can be used for storage, office or library. The living room offers direct access to a private balcony, perfect for relaxing or entertaining. Updated bathrooms with new
Key facts
- Quartz countertops
- 24/7 secure entry
- Galley kitchen
Tags
Property features AI
Finance
- HOA & community: Homeowners association (Monterey); HOA fee $350 monthly; HOA covers association management and grounds maintenance; Community amenities include country club, golf course, gated access, barbecue, pool, spa/hot tub, and security
Exterior
- Parking: Open parking
- Security: Gated community; Community security/guard
- Utilities: Underground utilities; Public water; Public sewer; No photovoltaics listed
- Home design: Multifamily property; 2 stories; Resale property; Faces west; Property is attached
- Construction: Asphalt roof; Resale construction
- Exterior features: Balcony; Community pool; Gated community
Interior
- Kitchen: Electric range; Dishwasher; Disposal; Microwave; Refrigerator
- Bedrooms: 3 possible bedrooms; Bedroom 2 with closet (12x11); Bedroom 3 with closet (12x11); Additional bedroom/room with walk-in closet (14x12)
- Flooring: Carpet; Tile
- Bathrooms: 1 full bathroom; 1 three-quarter bathroom
- Heating & cooling: Central heating (electric); Central air conditioning (electric)
- Interior features: Blinds on windows; Ceiling fans; Window treatments
- Laundry & utility: Washer; Dryer; Electric dryer hookup; Laundry located on upper level
Neighborhood map
What this means for you Summary
Snapshot
- This is a 3-bed/2.0-bath condo listed at $329k.
Deal economics
- At list price, monthly cash flow is $30 ($363/yr) — positive.
- The deal already cash-flows at list — no discount required.
- To meet the 1% rule (rent ≥ 1% of price), the offer needs to be $295k (10.3% below list).
- Recommended offer: $295k (10.3% below list) — sets the bar for 1% rule.
Location & tenants
- Location reads 79/100 on livability (#3 in NV, #2,272 nationally) — a middle-class / working-renter tenant base. Strengths: commute A+, cost of living A+, housing A+; Watch: crime F, employment D-.
- Clark County School District (urban): math 21% / reading 39% proficiency, ranked #11 of 17 in NV (top 65%) — families likely to look elsewhere, expect single-tenant / working-renter base with shorter leases.
- Zoned schools: Park John S Es (math 17% / reading 30%, grade F, #258 of 402 statewide, top 65%, 572 students, 100% FRL); Martin Roy W Ms (reading 31%, 1,271 students, 100% FRL); Valley Hs (math 8% / reading 24%, grade F, #107 of 131 statewide, top 82%, 2,714 students, 100% FRL) — zoned schools average 100% FRL vs 52% district-wide (48 pts higher); higher-poverty schools than district average — tighter screening recommended.
- Market conditions: Rents falling (-3.2%/yr); 351 active listings in the ZIP; 40 comparable units currently listed for rent nearby; rentals at typical pace (median 26d on market — plan ~3-4 weeks tenant-placement turnaround); 42% of comp listings sitting > 30 days — soft ceiling on asking rent; 14,754 units permitted in Clark County in 2024 (2,301 in 5+ unit buildings).
- At $2,952/mo this rent would consume 66% of the median local household income ($54k/yr) (locally 836% of renters already pay >50% of income on rent) — very limited rent-growth headroom before tenants either downsize or default.
Forward outlook
- Local home prices are declining (-2.2%/yr); year-one equity from $2k of loan paydown is wiped out by about $7k of value loss. Plan a longer hold.
- Clark County population projected at +36% by 2050 — long-run rental-demand tailwind backs the buy-and-hold thesis.
Negotiation context
- It's been on market 30 days — a 2% lower offer ($324k) is reasonable based on typical stale-listing flexibility.
- 3 sale attempts since 9y ago with the ask held roughly flat each time — persistent listings suggest the price (not the market) is what's stuck; bring a comps-based counter.
- Current owner paid $186k; list at $329k implies a 77% gain — meaningful room to come down on a strong offer.
Risks & watch-outs
- Climate carrying-cost: extreme-heat days projected 7→18/yr by 2055 (HVAC capex compounding) — expect insurance premiums to compound above CPI over the hold.
Questions for the listing agent
- Built in 1974 — when were the roof, HVAC, electrical panel, plumbing, and water heater last replaced?
- What does the HOA fee cover, when was the last increase, and are there any pending special assessments or reserve-fund shortfalls?
- Any open or pending special assessments — roof, HVAC, plumbing, elevator, façade? What's the per-unit balance and payoff schedule, and is the seller paying it off at close or rolling it to the buyer?
- Is there a deadline driving the sale (1031 exchange, divorce, estate, relocation)? That informs how much negotiation room exists.
- Crime grade is F in this area — have there been break-ins, vandalism, or insurance claims at this property in the last 3 years? What carrier currently insures it and at what premium?
- The area grade is low — what's the realistic commute time and amenity access for the typical tenant pool here? Any planned neighborhood developments (good or bad) we should know about?
- What's the average days-on-market for RENTAL listings here right now (not sales)? A rising rental-DOM trend means longer vacancies and softer asking-rent achievability than the comps imply.
- What's the recent tenant-quality profile in this submarket — average credit score on applications, eviction rate, late-payment / NSF rate, and stable-employment percentage? A property-management company in the area should have these aggregated.
- How much new apartment / multifamily construction is in the pipeline within 1–3 miles? Heavy new supply (>2% of stock underway) typically softens rents 12–24 months out; light construction supports rent growth.
Investment metrics
- 1% rule
- 0.90% ✗
- Cap rate
- 6.40%
- Cash-on-cash
- 0.39%
- DSCR
- 1.02
- GRM
- 9.3
CMA / ARV
No comps found within radius.
Projected returns pro-forma
-2.22% appreciation · 0.0% rent growth · sell at horizon
- IRR
- -14.2%
- Equity multiple
- 0.47×
- Total profit
- $-49,182
- Equity at exit
- $60,538
- IRR
- -11.0%
- Equity multiple
- 0.31×
- Total profit
- $-64,013
- Equity at exit
- $48,569
Cash invested: $92,120 (down + closing). Projections, not guarantees.
Landlord ↔ Tenant lean methodology
- Overall (STATE)
- 71 Landlord-Friendly
- State Nevada
- 71 Landlord-Friendly · R+1
- County
- — inherits STATE
- City
- — inherits STATE
ZIP-level market 89109
- Home prices YoY
- -1.2%
- Rents YoY
- -3.2%
- Active inventory
- 351
- Price-to-rent
- 9.3×
Monthly cashflow live
- Estimated rent
- $2,952 high interval (Pro) →
- Mortgage (P&I)
- −$1,725
- Tax from tax record
- −$89 /mo · $1,073/yr
- Insurance
- −$137
- HOA
- −$350
- Vacancy / Maint / Mgmt
- −$620
- Net cashflow
- $30
Break-even live
Sensitivity live
| Price | -10% $216 | -5% $123 | +0% $30 | +5% $-63 | +10% $-156 |
|---|---|---|---|---|---|
| Rent | -10% $-203 | -5% $-86 | +0% $30 | +5% $147 | +10% $263 |
| Rate | -1.0pp $196 | -0.5pp $114 | base $30 | +0.5pp $-55 | +1.0pp $-142 |
UW: 25.0% down · 7.5% · 30yr · 1.5% tax · 5.0% vac · 8.0% maint · 8.0% mgmt
Financing live
Cash to close
- Down payment
- $82,250
- Closing costs
- $9,870
- Reserves months
- —
- Total cash needed
- —
Loan-product check · same deal, 3 products live
Conventional
25% down · 7.5% · 30yr
- Down + closing
- —
- Monthly P&I
- —
- Monthly cashflow
- —
- DSCR
- —
- Eligible?
- —
Personal DTI + credit; lowest rate.
DSCR
20% down · 8.5% · 30yr
- Down + closing
- —
- Monthly P&I
- —
- Monthly cashflow
- —
- DSCR
- —
- Eligible?
- —
No personal income docs; deal must DSCR.
Hard money
10% down · 12.0% · 12mo
- Down + closing
- —
- Monthly P&I
- —
- Monthly cashflow
- —
- DSCR
- —
- Eligible?
- —
Short-term bridge; refi at stabilization.
Rent comps 40 comps
| Address | Beds | Baths | Sqft | Rent | $/sqft | DOM | Units | Dist |
|---|---|---|---|---|---|---|---|---|
| 2831 Geary Pl #2909 Las Vegas, NV | 2.0 | 1.0 | 1112 | $1,899 | $1.71 | 45d | 1 | 0.04mi |
| 596 Tam O Shanter Las Vegas, NV | 2.0 | 2.0 | 1350 | $1,750 | $1.30 | 45d | 1 | 0.14mi |
| 624 Tam O Shanter Las Vegas, NV | 2.0 | 2.5 | 1800 | $2,600 | $1.44 | 17d | 1 | 0.14mi |
| 322 Karen Ave Las Vegas, NV | 1.0–2.0 | 1.0–2.0 | 1109 | $3,500 | $3.15 | 6d | 3 | 0.27mi |
| 322 Karen Ave Las Vegas, NV | 1.0–2.0 | 1.5–2.0 | 1109 | $3,500 | $3.15 | 0d | 4 | 0.27mi |
| 222 Karen Ave #3504 Las Vegas, NV | 3.0 | 2.5 | 1646 | $4,000 | $2.43 | 45d | 1 | 0.34mi |
| 222 Karen Ave #4101 Las Vegas, NV | 2.0 | 2.0 | 1399 | $4,000 | $2.86 | 3d | 1 | 0.34mi |
| 222 Karen Ave #4005 Las Vegas, NV | 2.0 | 3.0 | 1646 | $4,500 | $2.73 | 25d | 1 | 0.34mi |
| 222 Karen Ave #3804 Las Vegas, NV | 2.0 | 3.0 | 1646 | $5,000 | $3.04 | 45d | 1 | 0.34mi |
| 511 E Sahara Ave Las Vegas, NV | 1.0–2.0 | 1.0 | 900 | $1,600 | $1.78 | 45d | 3 | 0.38mi |
| 2747 Paradise Rd #205 Las Vegas, NV | 2.0 | 2.0 | 1556 | $2,856 | $1.84 | 45d | 1 | 0.44mi |
| 2999 Bel Air Dr Las Vegas, NV | 2.0 | 2.0 | 1326 | $2,700 | $2.04 | 24d | 1 | 0.49mi |
| 3159 Bel Air Dr Las Vegas, NV | 2.0 | 2.0 | 1305 | $2,750 | $2.11 | 24d | 1 | 0.51mi |
| 2204 Van Patten Pl Las Vegas, NV | 2.0 | 2.0 | 1508 | $2,300 | $1.53 | 45d | 1 | 0.53mi |
| 3145 Bel Air Dr Las Vegas, NV | 2.0 | 2.0 | 1305 | $2,495 | $1.91 | 24d | 1 | 0.54mi |
| 3111 Bel Air Dr Las Vegas, NV | 2.0–3.0 | 2.5–3.5 | 2764 | $15,000 | $5.43 | 6d | 2 | 0.55mi |
| 3111 Bel Air Dr Las Vegas, NV | 2.0–3.0 | 2.5 | 2032 | $2,800 | $1.38 | 45d | 3 | 0.55mi |
| 2205 Santa Paula Dr Las Vegas, NV | 4.0 | 2.0 | 1455 | $3,495 | $2.40 | 25d | 1 | 0.55mi |
| 1100 Tam O Shanter Las Vegas, NV | 2.0 | 2.0 | 1400 | $2,100 | $1.50 | 45d | 1 | 0.57mi |
| 2109 Santa Ynez Dr Las Vegas, NV | 4.0 | 3.0 | 1755 | $4,200 | $2.39 | 12d | 1 | 0.58mi |
| 2109 Santa Ynez Dr Las Vegas, NV | 4.0 | 3.0 | 1755 | $4,200 | $2.39 | 9d | 1 | 0.58mi |
| 2108 S 6th St Las Vegas, NV | 3.0 | 2.0 | 1833 | $2,499 | $1.36 | 5d | 1 | 0.60mi |
| 900 E Desert Inn Rd Las Vegas, NV | 1.0–2.0 | 1.0–2.0 | 1077 | $1,800 | $1.67 | 45d | 5 | 0.63mi |
| 525 E Saint Louis Ave Las Vegas, NV | 2.0 | 2.0 | 1094 | $1,525 | $1.39 | 45d | 1 | 0.69mi |
| 200 W Sahara Ave #3005 Las Vegas, NV | 2.0 | 2.0 | 1233 | $2,300 | $1.87 | 45d | 1 | 0.71mi |
| 200 W Sahara Ave #1705 Las Vegas, NV | 2.0 | 2.0 | 1233 | $2,450 | $1.99 | 45d | 1 | 0.71mi |
| 200 W Sahara Ave #3201 Las Vegas, NV | 2.0 | 2.0 | 1563 | $2,750 | $1.76 | 0d | 1 | 0.71mi |
| 200 W Sahara Ave #3906 Las Vegas, NV | 2.0 | 2.0 | 1532 | $3,500 | $2.28 | 6d | 1 | 0.71mi |
| 200 W Sahara Ave #3507 Las Vegas, NV | 2.0 | 2.0 | 1295 | $2,500 | $1.93 | 45d | 1 | 0.71mi |
| 200 W Sahara Ave #1702 Las Vegas, NV | 2.0 | 2.0 | 1295 | $2,200 | $1.70 | 4d | 1 | 0.71mi |
| 200 W Sahara Ave Las Vegas, NV | 2.0 | 2.0 | 1223 | $2,300 | $1.88 | 14d | 1 | 0.71mi |
| 360 E Desert Inn Rd Las Vegas, NV | 2.0–3.0 | 2.0–3.0 | 2120 | $4,400 | $2.08 | 25d | 3 | 0.72mi |
| 360 E Desert Inn Rd Las Vegas, NV | 2.0–3.0 | 2.0 | 1989 | $4,400 | $2.21 | 6d | 2 | 0.72mi |
| 360 E Desert Inn Rd Las Vegas, NV | 2.0–3.0 | 2.0–3.0 | 2120 | $4,500 | $2.12 | 45d | 4 | 0.72mi |
| 2700 Las Vegas Blvd S Las Vegas, NV | 1.0–2.0 | 1.0–2.5 | 1226 | $2,950 | $2.41 | 19d | 4 | 0.73mi |
| 2700 Las Vegas Blvd S Las Vegas, NV | 2.0 | 2.0–2.5 | 1283 | $2,792 | $2.18 | 14d | 4 | 0.73mi |
| 701 Canosa Ave Las Vegas, NV | 4.0 | 3.0 | 1414 | $3,300 | $2.33 | 17d | 1 | 0.82mi |
| 701 Canosa Ave Las Vegas, NV | 4.0 | 3.0 | 1414 | $3,300 | $2.33 | 9d | 1 | 0.82mi |
| 1040 Canosa Ave Las Vegas, NV | 2.0 | 1.0 | 969 | $1,745 | $1.80 | 45d | 1 | 0.93mi |
| 3550 Paradise Rd Las Vegas, NV | 3.0 | 1.0–2.0 | 947 | $1,750 | $1.85 | 45d | 20 | 0.95mi |
HOA detail condo
- Monthly dues
- $350 · $4,200/yr
- Likely covers
- gassecurity
- Assessments
- None detected in remarks — confirm with the listing agent.
Listing history 26 events
-
2026-06-21days on market $329,000 Active 30 DOM
-
2026-06-18days on market $329,000 Active 27 DOM
-
2026-06-17days on market $329,000 Active 26 DOM
-
2026-06-16days on market $329,000 Active 25 DOM
-
2026-06-15days on market $329,000 Active 24 DOM
-
2026-06-13days on market $329,000 Active 22 DOM
-
2026-06-09days on market $329,000 Active 18 DOM
-
2026-06-08days on market $329,000 Active 17 DOM
-
2026-06-07days on market $329,000 Active 16 DOM
-
2026-06-03days on market $329,000 Active 12 DOM
-
2026-06-02days on market $329,000 Active 11 DOM
-
2026-06-01days on market $329,000 Active 10 DOM
-
2026-05-31days on market $329,000 Active 9 DOM
-
2026-05-13$2,050
-
2026-02-13$1,995
-
2026-01-09price $339,000 945-char remark
-
2025-11-05$349,000 Active 945-char remark
-
2024-08-25historical $1,450
-
2024-08-21$1,450
-
2024-06-20historical $1,450
-
2024-06-05$1,450
-
2017-06-22historical
-
2017-05-13price $159,900
-
2017-05-12$156,000 Active
-
2009-01-20soldstatus $186,375
-
2004-07-29soldstatus $49,000,000
ⓘ Source: listings_history table (triggers on properties + properties_extension) + one-shot
backfill from property_details.listing_events for pre-trigger history.
Tax reassessment forecast NV · Resets to sale price
- Current annual tax
- $1,073 · $89/mo
- Projected year-2 tax
- $1,941 · $162/mo
- Expected delta
- +$868/yr (+$72/mo · 81.0%)
ⓘ Screening estimate from a state-policy table — verify with the county assessor before closing.
Climate risk First Street
- Flood 1/10 Low FEMA zone X (unshaded) · 0% chance over 30 yrs
- Wildfire 1/10 Low
- Heat 8/10 Severe 7 d/yr ≥106°F today · 18 d/yr by 30 yrs out
- Wind 1/10 Low
- Air quality 3/10 Moderate 3 unhealthy d/yr today · 4 by 30 yrs out
Nearby sold comps map
Loading sold comps map…
Walkable amenities ~0.75 mi
Loading nearby amenities…
Taxation est. · year 1
- Rental income
- $35,423
- − Mortgage interest
- −$18,429
- − Property taxes
- −$1,073
- − Insurance
- −$1,645
- − Repairs & maintenance
- −$2,834
- − Management
- −$2,834
- − HOA
- −$4,200
- − Depreciation
- −$9,571
- Taxable loss
- −$5,162
- Est. tax savings @ 24.0%
- +$1,239
- After-tax cash flow
- $1,602/yr
For passive investors: Depreciation is non-cash, so a rental often shows a tax loss while cash-flowing — sheltering income. Rental losses are passive: they offset passive income freely, and up to $25,000/yr can offset ordinary (W-2) income if you actively participate and your MAGI is under $100k (phasing out to $0 by $150k); unused losses carry forward. On sale, claimed depreciation is recaptured at up to 25%, and gains may owe capital-gains tax (a 1031 exchange can defer both). Figures are a year-1 estimate at your 24.0% rate — not tax advice; consult a CPA.
Schools (NCES district)
- District
- Clark County School District
- NCES district ID
- 3200060
- Math proficiency
- 21% ▼ -13.00%
- Reading proficiency
- 39% ▼ -8.00%
- Median HH income
- $53,611
- Composite
- 26.48/100
- National rank
- #7211
- State rank
- #11 of 17 in NV
Livability — Winchester
- Score
- 79/100
- State rank
- #3
- US rank
- #2272
Category grades
Schools grade is shown separately in the Schools card above.
Census & demographics
- Census place
- Winchester, NV
- County
- Clark County · 2,306,105 people
- City population
- 39,883
- Metro
- Las Vegas-Henderson-Paradise, NV
- Population (ZIP)
- 6,504
- Household income
- $53,684
- Rent vs Own
- Severe rent burden
- 836.0
Population outlook (Clark County) Hauer SSP2
- Today (2025)
- 2,504,101 people
- By 2030
- 2,693,770 · +7.6%
- By 2040
- 3,061,208 · +22.2%
- By 2050
- 3,400,072 · +35.8%
- By 2075
- 4,139,522 · +65.3%
- By 2100
- 4,596,916 · +83.6%
Race, ethnicity, and origin ACS 2023
- Neighborhood character
- Highly diverse neighborhood (Simpson 0.73)
- Race & ethnicity
- White 44% Black 18% Hispanic / Latino 16% Asian 14% Two or more races 12%
- Hispanic origin (detail)
- Mexican 10% Cuban 1%
- Common ancestry
- Lithuanian 3% Scotch-Irish 2% Romanian 2%
- Foreign-born
- 23% · Canada, China, South Korea
- Languages at home
- 75% English-only · Spanish 9% Tagalog/Filipino 7% Chinese 2%
Political lean MEDSL · Clark
- 2024 margin
- Toss-up / Even · D 50.4% · R 47.8% · Other 1.7%
- 2008→2024 swing
- -16.5pp toward R · 2008: 19.1pp · 2024: 2.6pp
- All cycles
- 2024: D+2.6 2020: D+9.3 2016: D+10.7 2012: D+14.5 2008: D+19.1
Not yet ingested
- Civics
- —
Market trends
- HPI YoY
- ▼ -2.22%
- Current HPI
- 180.1607
- Rent YoY
- ▼ -3.23%
- Metro
- Las Vegas-Henderson-Paradise, NV
- State GDP YoY
- ▲ 3.08%
- F500 in state
- 6
Industry mix (Fortune 500 HQ in NV)
| Industry | F500 HQs | Revenue |
|---|---|---|
| Hotels / Casinos | 3 | $36B |
|
||
Price history
-99.3% since first listed9 events — show timeline
- 2026-05-22 Listing Removed — GLVAR
- 2026-05-22 Listed $329,000 GLVAR
- 2026-01-09 Price Changed $339,000 GLVAR
- 2025-11-05 Listed $349,000 GLVAR
- 2017-06-22 Listing Removed — GLVAR
- 2017-05-13 Price Changed $159,900 GLVAR
- 2017-05-12 Listed $156,000 GLVAR
- 2009-01-20 Sold (Public Records) $186,375 Public Records
- 2004-07-29 Sold (Public Records) $49,000,000 Public Records
Property tax history
-1.6%/yrLatest (2025): $1,073 · +6.1% YoY. Source: county tax records.
Cash-flow waterfall
monthlySold comps — $/sqft
last 12 mo · ≤1 miLoading sold comps…