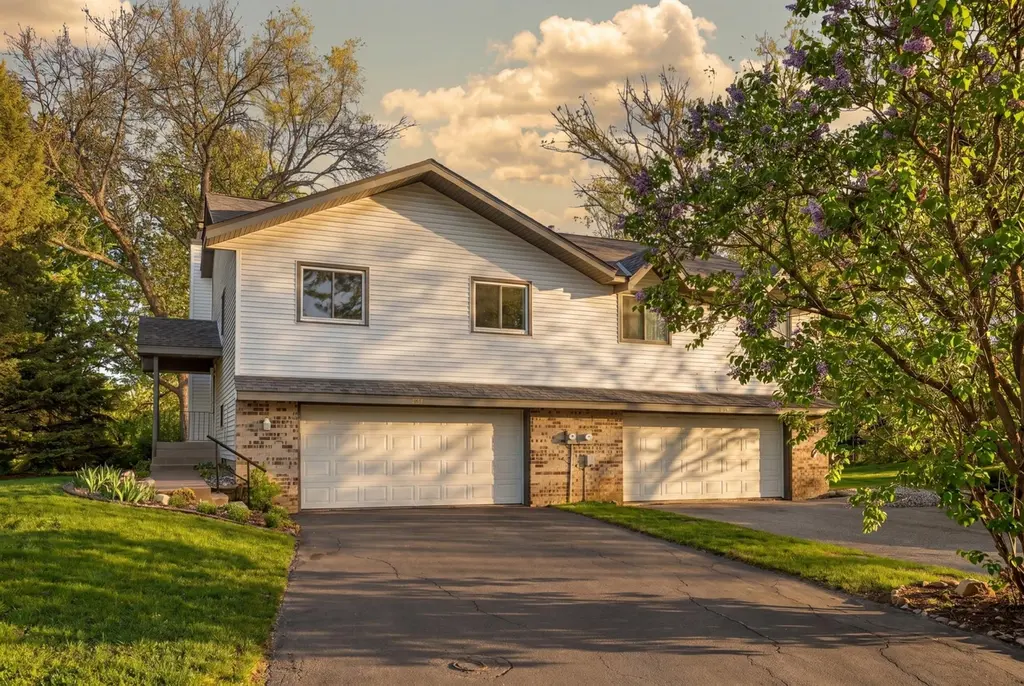
9843 Cavell Cir · Bloomington, MN
Flood risk 1/10 · Minimal
- FEMA flood zone
- X (unshaded)
- Chance of flooding over 30 yrs
- 0.0%
- Est. flood insurance / yr
- $473 – $860
Fire risk 1/10 · Minimal
- Est. fire insurance / yr
- $888 – $1,650
Heat risk 2/10 · Minimal
- Hot days now (above 98°F)
- 7 days/yr
- Hot days in 30 yrs
- 14 days/yr
Wind risk 2/10 · Minimal
- Chance of severe wind over 30 yrs
- —
Air-quality risk 2/10 · Minimal
- Unhealthy air days now
- 1 days/yr
- Unhealthy air days in 30 yrs
- 2 days/yr
Risk factors via First Street. Map © Google.
Why this score? — see what drove the D grade
The composite is a weighted blend of 9 inputs, each scored 0–100. Each bar is that input's sub-score; the figure is the points it added to the 100-point composite (weight × sub-score).
- ARV discount +15.0/15.0
- Cash flow +8.2/30.0
- Livability +3.8/5.0
- Schools +3.7/10.0
- Rent growth +3.1/5.0
- Condition / age +2.5/5.0
- 1% rule +2.2/10.0
- DSCR +2.2/10.0
- Appreciation +0.0/10.0
$279,900
🖨 Deal sheet 📄 Offer letter ✓ Due diligence
Listing remarks
MULTIPLE OFFERS RECEIVED, HIGHEST AND BEST BY 6:00PM SATURDAY, MAY 16TH. Welcome Home!!! TWIN HOME WITH NO HOA!!!!! 3 bedrooms, 2 bath split entry home. Windows put in in 2011 with a transferable warranty. Quiet neighborhood close to parks and freeway access. Carpet new last year and newer kitchen floor. Same owner for the last 30 years. Please make sire park in left driveway. Thanks!
Key facts
- 7,405 sq ft lot
- 2 garage spots
- Built 1980
Property features AI
Finance
- Other: Property is not fractional ownership
Exterior
- Parking: Attached tuck-under garage with automatic door opener; 2-car garage (19 x 23)
- Utilities: City water connected; City sewer connected; Natural gas; Electric with circuit breakers
- Home design: Residential attached property; Split entry (bi-level) layout; Entry facing direction not specified
- Construction: Block construction; Asphalt roof (age over 8 years); Block foundation; Built area configured with above-grade and below-grade finished space
- Exterior features: Stone and vinyl exterior; Light tree coverage; Deck and patio
Interior
- Kitchen: Dishwasher; Disposal; Freezer; Microwave; Range; Refrigerator; Gas water heater
- Bedrooms: 3 bedrooms (two on main level, one in lower level)
- Bathrooms: Main floor full bathroom; 3/4 bathroom in basement
- Heating & cooling: Forced air heating; Fireplace provides supplemental heat; Central air conditioning
- Interior features: Ceiling fan(s); Finished basement; Wood-burning fireplace; Kitchen/Dining room combination; Deck; Patio; Satellite dish; Washer/Dryer hookup
- Laundry & utility: Laundry room on lower level; Washer; Dryer
Neighborhood map
What this means for you Summary
Snapshot
- This is a 3-bed/2.0-bath single-family listed at $280k.
Deal economics
- At list price, monthly cash flow is $-265 ($-3k/yr) — negative.
- To cash-flow at today's rent, offer at most $233k (16.7% below list).
- To meet the 1% rule (rent ≥ 1% of price), the offer needs to be $201k (28.4% below list).
- Recommended offer: $201k (28.4% below list) — sets the bar for 1% rule.
- Cap rate 5.2% vs local median 3.5% in Bloomington — top-decile yield for the area; either an underpriced asset or a hidden risk that comps aren't pricing in. Stress-test before assuming the spread holds.
Location & tenants
- Location reads 76/100 on livability (#168 in MN, #3,640 nationally) — a middle-class / working-renter tenant base. Strengths: commute A+, employment A+, housing A+; Watch: crime D-, amenities F, health & safety F.
- Bloomington Public School District (urban): math 35% / reading 49% proficiency, ranked #192 of 301 in MN (top 64%) — families likely to look elsewhere, expect single-tenant / working-renter base with shorter leases.
- Market conditions: Rents rising (+2.3%/yr); 84 active listings in the ZIP; solid renter incomes; 4,651 units permitted in Hennepin County in 2024 (2,443 in 5+ unit buildings).
Forward outlook
- Local home prices are declining (-3.0%/yr); year-one equity from $2k of loan paydown is wiped out by about $8k of value loss. Plan a longer hold.
- Hennepin County population projected at +30% by 2050 — long-run rental-demand tailwind backs the buy-and-hold thesis.
Negotiation context
- Only 4 days on market — expect competitive offers; lowballing is unlikely to land.
Questions for the listing agent
- What do current leases actually rent for vs. the listed asking? Can we see a recent rent roll and the last 12 months of T-12 income?
- Is there a deadline driving the sale (1031 exchange, divorce, estate, relocation)? That informs how much negotiation room exists.
- Schools are B-rated — typically a magnet for longer-tenancy family renters. What's the average tenant stay here, and is there a school-zone premium baked into asking?
- Crime grade is D in this area — have there been break-ins, vandalism, or insurance claims at this property in the last 3 years? What carrier currently insures it and at what premium?
- The area grade is low — what's the realistic commute time and amenity access for the typical tenant pool here? Any planned neighborhood developments (good or bad) we should know about?
- What's the average days-on-market for RENTAL listings here right now (not sales)? A rising rental-DOM trend means longer vacancies and softer asking-rent achievability than the comps imply.
- What's the recent tenant-quality profile in this submarket — average credit score on applications, eviction rate, late-payment / NSF rate, and stable-employment percentage? A property-management company in the area should have these aggregated.
- How much new for-sale + rental construction is in the pipeline within 1–3 miles? Heavy new supply typically softens prices + rents 12–24 months out; constrained supply supports both.
Investment metrics
- 1% rule
- 0.72% ✗
- Cap rate
- 5.16%
- Cash-on-cash
- -4.06%
- DSCR
- 0.82
- GRM
- 11.6
CMA / ARV
- ARV (median comp)
- $342,862
- List price
- $279,900
- Delta
- -18.36%
- Verdict
- UNDERPRICED
- Comps
- 2 within 2.0 mi
Projected returns pro-forma
-3.0% appreciation · 2.34% rent growth · sell at horizon
- IRR
- -23.9%
- Equity multiple
- 0.19×
- Total profit
- $-63,583
- Equity at exit
- $41,734
- IRR
- -20.7%
- Equity multiple
- -0.05×
- Total profit
- $-82,552
- Equity at exit
- $24,201
Cash invested: $78,372 (down + closing). Projections, not guarantees.
Landlord ↔ Tenant lean methodology
- Overall (STATE)
- 46 Balanced
- State Minnesota
- 46 Balanced · D+2
- County
- — inherits STATE
- City
- — inherits STATE
ZIP-level market 55438
- Rents YoY
- 2.3%
- Active inventory
- 84
- Price-to-rent
- 11.6×
Monthly cashflow live
- Estimated rent
- $2,005 medium interval (Pro) →
- Mortgage (P&I)
- −$1,468
- Tax from tax record
- −$265 /mo · $3,177/yr
- Insurance
- −$117
- HOA
- −$0
- Vacancy / Maint / Mgmt
- −$421
- Net cashflow
- $-265
Break-even live
UW: 25.0% down · 7.5% · 30yr · 1.5% tax · 5.0% vac · 8.0% maint · 8.0% mgmt
Financing live
Cash to close
- Down payment
- $69,975
- Closing costs
- $8,397
- Reserves months
- —
- Total cash needed
- —
Loan-product check · same deal, 3 products live
Conventional
25% down · 7.5% · 30yr
- Down + closing
- —
- Monthly P&I
- —
- Monthly cashflow
- —
- DSCR
- —
- Eligible?
- —
Personal DTI + credit; lowest rate.
DSCR
20% down · 8.5% · 30yr
- Down + closing
- —
- Monthly P&I
- —
- Monthly cashflow
- —
- DSCR
- —
- Eligible?
- —
No personal income docs; deal must DSCR.
Hard money
10% down · 12.0% · 12mo
- Down + closing
- —
- Monthly P&I
- —
- Monthly cashflow
- —
- DSCR
- —
- Eligible?
- —
Short-term bridge; refi at stabilization.
Listing history 4 events
-
2026-05-17status Pending 388-char remark
-
2026-05-14$279,900 Active 388-char remark
-
2026-05-05historical $279,900 388-char remark
-
1993-04-19soldstatus $76,000
ⓘ Source: listings_history table (triggers on properties + properties_extension) + one-shot
backfill from property_details.listing_events for pre-trigger history.
Tax reassessment forecast MN · Partial reset (capped growth)
- Current annual tax
- $3,177 · $265/mo
- Projected year-2 tax
- $3,177 · $265/mo
- Expected delta
- $0/yr ($0/mo · 0.0%)
ⓘ Screening estimate from a state-policy table — verify with the county assessor before closing.
Climate risk First Street
- Flood 1/10 Low FEMA zone X (unshaded) · 0% chance over 30 yrs
- Wildfire 1/10 Low
- Heat 2/10 Low 7 d/yr ≥98°F today · 14 d/yr by 30 yrs out
- Wind 2/10 Low
- Air quality 2/10 Low 1 unhealthy d/yr today · 2 by 30 yrs out
Nearby sold comps map
Loading sold comps map…
Walkable amenities ~0.75 mi
Loading nearby amenities…
Taxation est. · year 1
- Rental income
- $24,063
- − Mortgage interest
- −$15,679
- − Property taxes
- −$3,177
- − Insurance
- −$1,400
- − Repairs & maintenance
- −$1,925
- − Management
- −$1,925
- − Depreciation
- −$8,143
- Taxable loss
- −$8,185
- Est. tax savings @ 24.0%
- +$1,964
- After-tax cash flow
- $-1,216/yr
For passive investors: Depreciation is non-cash, so a rental often shows a tax loss while cash-flowing — sheltering income. Rental losses are passive: they offset passive income freely, and up to $25,000/yr can offset ordinary (W-2) income if you actively participate and your MAGI is under $100k (phasing out to $0 by $150k); unused losses carry forward. On sale, claimed depreciation is recaptured at up to 25%, and gains may owe capital-gains tax (a 1031 exchange can defer both). Figures are a year-1 estimate at your 24.0% rate — not tax advice; consult a CPA.
Schools (NCES district)
- District
- Bloomington Public School District
- NCES district ID
- 2705790
- Math proficiency
- 35% ▼ -12.00%
- Reading proficiency
- 49% ▼ -4.00%
- Median HH income
- $63,279
- Composite
- 37.37/100
- National rank
- #4431
- State rank
- #192 of 301 in MN
Livability — Bloomington
- Score
- 76/100
- State rank
- #168
- US rank
- #3640
Category grades
Schools grade is shown separately in the Schools card above.
Census & demographics
- Census place
- Bloomington, MN
- County
- Hennepin County · 1,150,272 people
- City population
- 88,605
- Metro
- Minneapolis-St. Paul-Bloomington, MN-WI
- Population (ZIP)
- 15,701
- Household income
- $106,432
- Rent vs Own
- Severe rent burden
- 374.0
Population outlook (Hennepin County) Hauer SSP2
- Today (2025)
- 1,405,227 people
- By 2030
- 1,492,650 · +6.2%
- By 2040
- 1,660,157 · +18.1%
- By 2050
- 1,823,498 · +29.8%
- By 2075
- 2,221,283 · +58.1%
- By 2100
- 2,509,976 · +78.6%
Race, ethnicity, and origin ACS 2023
- Neighborhood character
- Predominantly White (76%)
- Race & ethnicity
- White 76% Two or more races 8% Hispanic / Latino 8% Black 7% Asian 3%
- Hispanic origin (detail)
- Mexican 6%
- Common ancestry
- Portuguese 17% Romanian 5% Italian 3%
- Foreign-born
- 8% · Canada, South Korea, Jamaica
- Languages at home
- 91% English-only · Spanish 3% Other Indo-European 1% Russian/Polish/Slavic 1%
Political lean MEDSL · Hennepin
- 2024 margin
- Solid D (+42.6) · D 70.2% · R 27.5% · Other 2.3%
- 2008→2024 swing
- +14.0pp toward D · 2008: 28.6pp · 2024: 42.6pp
- All cycles
- 2024: D+42.6 2020: D+43.2 2016: D+35.3 2012: D+27.1 2008: D+28.6
Not yet ingested
- Civics
- —
Market trends
- HPI YoY
- ▼ -266.25%
- Current HPI
- 221.0474
- Rent YoY
- ▲ 2.34%
- Metro
- Minneapolis-St. Paul-Bloomington, MN-WI
- State GDP YoY
- ▲ 2.41%
- F500 in state
- 34
Industry mix (Fortune 500 HQ in MN)
| Industry | F500 HQs | Revenue |
|---|---|---|
| Healthcare | 2 | $407B |
|
||
| Retail | 2 | $150B |
|
||
| Consumer Goods | 2 | $32B |
|
||
| Industrial Machinery | 2 | $6B |
|
||
| Agriculture | 1 | $40B |
|
||
| Healthcare / Medical Devices | 1 | $32B |
|
||
Price history
+275.0% since first listed5 events — show timeline
- 2026-06-12 Sold (MLS) $285,000 NORTHSTARMLS as Distributed by MLS Grid
- 2026-05-17 Pending — NORTHSTARMLS as Distributed by MLS Grid
- 2026-05-14 Listed $279,900 NORTHSTARMLS as Distributed by MLS Grid
- 2026-05-05 Coming Soon $279,900 NORTHSTARMLS as Distributed by MLS Grid
- 1993-04-19 Sold (Public Records) $76,000 Public Records
Property tax history
+5.5%/yrLatest (2025): $3,177 · +2.0% YoY. Source: county tax records.
Cash-flow waterfall
monthlySold comps — $/sqft
last 12 mo · ≤1 miLoading sold comps…