6334 Big Vly · San Antonio, TX
Flood risk 1/10 · Minimal
- FEMA flood zone
- X (unshaded)
- Chance of flooding over 30 yrs
- 0.0%
- Est. flood insurance / yr
- $507 – $1,088
Fire risk 4/10 · Minor
- Est. fire insurance / yr
- $1,222 – $2,270
Heat risk 8/10 · Major
- Hot days now (above 109°F)
- 7 days/yr
- Hot days in 30 yrs
- 22 days/yr
Wind risk 8/10 · Major
- Chance of severe wind over 30 yrs
- 80.0%
Air-quality risk 2/10 · Minimal
- Unhealthy air days now
- 1 days/yr
- Unhealthy air days in 30 yrs
- 1 days/yr
Risk factors via First Street. Map © Google.
Why this score? — see what drove the D+ grade
The composite is a weighted blend of 9 inputs, each scored 0–100. Each bar is that input's sub-score; the figure is the points it added to the 100-point composite (weight × sub-score).
- Cash flow +17.2/30.0
- ARV discount +8.6/15.0
- DSCR +5.4/10.0
- 1% rule +5.3/10.0
- Livability +4.0/5.0
- Condition / age +2.5/5.0
- Rent growth +2.2/5.0
- Schools +1.4/10.0
- Appreciation +0.0/10.0
$155,000
🖨 Deal sheet 📄 Offer letter ✓ Due diligence
Listing remarks MLS
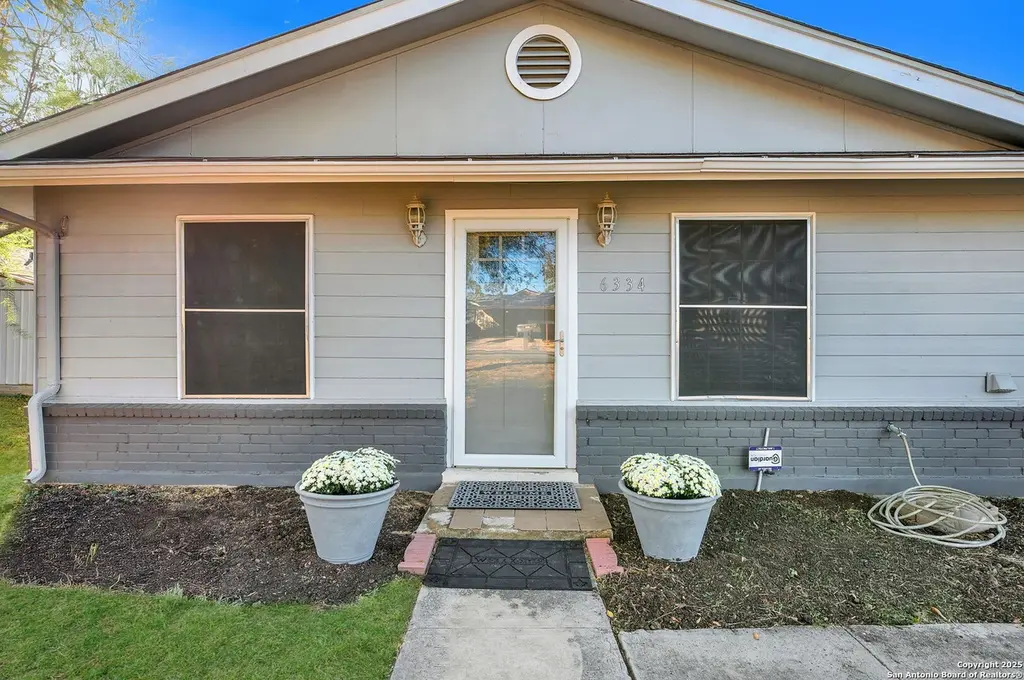
Welcome Home to 6334 Big Valley! Tucked away in a peaceful cul-de-sac in the heart of the Lackland City subdivision with minimal traffic and maximum privacy, this charming 3-bedroom, 1-bath home is the perfect place for your family to grow! Enjoy cozy evenings by the fireplace, weekend BBQs in your spacious backyard. With plenty of room for the kids to play and space for entertaining, this home blends comfort, style, and value. At this price, its an incredible opportunity for first-time homebuyers!
Key facts
- Spacious backyard
- Cul-de-sac
- Fireplace
Tags
Neighborhood map
What this means for you Summary
Snapshot
- This is a 3-bed/1.0-bath single-family listed at $155k.
Deal economics
- At list price, monthly cash flow is $112 ($1k/yr) — positive.
- The deal already cash-flows at list — no discount required.
- Meets the 1% rule at list price ($2k rent vs $155k).
- Recommended offer: $136k (12.0% below list) — sets the bar for market timing.
- Cap rate 7.2% vs local median 3.8% in San Antonio — top-decile yield for the area; either an underpriced asset or a hidden risk that comps aren't pricing in. Stress-test before assuming the spread holds.
Location & tenants
- Location reads 80/100 on livability (#31 in TX, #1,616 nationally) — a professional / high-income tenant draw. Strengths: amenities A+, commute A+, cost of living A+; Watch: schools C-, crime F.
- South San Antonio ISD (urban): math 13% / reading 20% proficiency, ranked #804 of 826 in TX (top 97%) — low school quality limits family demand, transient renter base, plan for 1-2y turnover.
- Market conditions: Rents soft (-1.3%/yr); 91 active listings in the ZIP; 36 comparable units currently listed for rent nearby; rentals at typical pace (median 24d on market — plan ~3-4 weeks tenant-placement turnaround); 8,308 units permitted in Bexar County in 2024 (2,506 in 5+ unit buildings).
- This rent runs 38% of the median local income ($51k/yr) — at the standard rent-burdened threshold; future hikes will face affordability resistance.
Forward outlook
- Local home prices are declining (-3.0%/yr); year-one equity from $1k of loan paydown is wiped out by about $5k of value loss. Plan a longer hold.
- Bexar County population projected at +50% by 2050 — long-run rental-demand tailwind backs the buy-and-hold thesis.
Negotiation context
- It's been on market 225 days — a 12% lower offer ($136k) is reasonable based on typical stale-listing flexibility.
Risks & watch-outs
- Climate carrying-cost: severe wind risk, 80% chance of damaging wind over 30y; extreme-heat days projected 7→22/yr by 2055 (HVAC capex compounding) — expect insurance premiums to compound above CPI over the hold.
Questions for the listing agent
- It's been on market 225 days. Have you received any prior offers? Is the seller open to a 12% concession, seller financing, or rate buy-down credit?
- Built in 1971 — when were the roof, HVAC, electrical panel, plumbing, and water heater last replaced?
- Why hasn't it sold? Are there any deal-killer items the seller is aware of (foundation, flood, title, zoning, code violations)?
- Is there a deadline driving the sale (1031 exchange, divorce, estate, relocation)? That informs how much negotiation room exists.
- Crime grade is F in this area — have there been break-ins, vandalism, or insurance claims at this property in the last 3 years? What carrier currently insures it and at what premium?
- The area grade is low — what's the realistic commute time and amenity access for the typical tenant pool here? Any planned neighborhood developments (good or bad) we should know about?
- What's the average days-on-market for RENTAL listings here right now (not sales)? A rising rental-DOM trend means longer vacancies and softer asking-rent achievability than the comps imply.
- What's the recent tenant-quality profile in this submarket — average credit score on applications, eviction rate, late-payment / NSF rate, and stable-employment percentage? A property-management company in the area should have these aggregated.
- How much new for-sale + rental construction is in the pipeline within 1–3 miles? Heavy new supply typically softens prices + rents 12–24 months out; constrained supply supports both.
Investment metrics
- 1% rule
- 1.03% ✓
- Cap rate
- 7.16%
- Cash-on-cash
- 3.10%
- DSCR
- 1.14
- GRM
- 8.1
CMA / ARV
- ARV (median comp)
- $158,907
- List price
- $155,000
- Delta
- -2.46%
- Verdict
- FAIR
- Comps
- 20 within 1.0 mi
Show comp detail 12 sales within ~0.75 mi
| Address | Dist | Beds/Ba | Sqft | Sold | Price | $/sf | Match |
|---|---|---|---|---|---|---|---|
| 7434 Gentle Vly | 0.37mi | 3/1.0 | 1,276 (+7%) | 6mo | $190,000 | $149 | 66 |
| 7502 Apple Vly | 0.50mi | 4/1.0 (+1) | 1,178 (-1%) | 7mo | $122,000 | $104 | 64 |
| 7038 Apple Vly | 0.58mi | 4/1.0 (+1) | 1,173 (-1%) | 10mo | $169,900 | $145 | 57 |
| 6119 Deer Vly | 0.68mi | 3/2.0 | 1,222 (+3%) | 10mo | $179,700 | $147 | 51 |
| 7307 Apastron Haze | 0.69mi | 3/2.0 | 1,274 (+7%) | 4mo | $184,500 | $145 | 48 |
| 6039 Golden Valley Dr | 0.63mi | 3/1.0 | 1,032 (-13%) | 1mo | $140,000 | $136 | 48 |
| 6134 Cedar Vly | 0.69mi | 3/1.0 | 1,032 (-13%) | 2mo | $159,900 | $155 | 44 |
| 6015 Fir Valley Dr | 0.73mi | 3/1.0 | 1,296 (+9%) | 12mo | $149,900 | $116 | 41 |
| 6322 Golden Vly | 0.44mi | 3/2.0 | 1,363 (+14%) | 14mo | $219,000 | $161 | 40 |
| 7511 Sleepy Vly | 0.66mi | 3/1.0 | 1,032 (-13%) | 14mo | $178,500 | $173 | 36 |
| 6023 Lark Valley Dr | 0.60mi | 3/2.0 | 1,016 (-15%) | 11mo | $199,000 | $196 | 34 |
| 8438 Cordova Pt | 0.75mi | 3/2.0 | 1,356 (+14%) | 11mo | $237,500 | $175 | 29 |
Match score weights: distance 35% · size 25% · config 20% · recency 20%. Top-matched comps best support the ARV.
Projected returns pro-forma
-3.0% appreciation · 0.0% rent growth · sell at horizon
- IRR
- -15.1%
- Equity multiple
- 0.48×
- Total profit
- $-22,604
- Equity at exit
- $23,111
- IRR
- -13.0%
- Equity multiple
- 0.35×
- Total profit
- $-28,332
- Equity at exit
- $13,402
Cash invested: $43,400 (down + closing). Projections, not guarantees.
Landlord ↔ Tenant lean methodology
- Overall (STATE)
- 87 Strongly Landlord-Friendly
- State Texas
- 87 Strongly Landlord-Friendly · R+5
- County
- — inherits STATE
- City
- — inherits STATE
ZIP-level market 78242
- Home prices YoY
- -17.6%
- Rents YoY
- -1.3%
- Active inventory
- 91
- Price-to-rent
- 8.1×
Monthly cashflow live
- Estimated rent
- $1,601 high interval (Pro) →
- Mortgage (P&I)
- −$813
- Tax from tax record
- −$275 /mo · $3,304/yr
- Insurance
- −$65
- HOA
- −$0
- Vacancy / Maint / Mgmt
- −$336
- Net cashflow
- $112
Break-even live
UW: 25.0% down · 7.5% · 30yr · 1.5% tax · 5.0% vac · 8.0% maint · 8.0% mgmt
Financing live
Cash to close
- Down payment
- $38,750
- Closing costs
- $4,650
- Reserves months
- —
- Total cash needed
- —
Loan-product check · same deal, 3 products live
Conventional
25% down · 7.5% · 30yr
- Down + closing
- —
- Monthly P&I
- —
- Monthly cashflow
- —
- DSCR
- —
- Eligible?
- —
Personal DTI + credit; lowest rate.
DSCR
20% down · 8.5% · 30yr
- Down + closing
- —
- Monthly P&I
- —
- Monthly cashflow
- —
- DSCR
- —
- Eligible?
- —
No personal income docs; deal must DSCR.
Hard money
10% down · 12.0% · 12mo
- Down + closing
- —
- Monthly P&I
- —
- Monthly cashflow
- —
- DSCR
- —
- Eligible?
- —
Short-term bridge; refi at stabilization.
Rent comps 36 comps
| Address | Beds | Baths | Sqft | Rent | $/sqft | DOM | Units | Dist |
|---|---|---|---|---|---|---|---|---|
| 7319 Walnut Valley Dr San Antonio, TX | 3.0 | 2.0 | 1152 | $1,900 | $1.65 | 12d | 1 | 0.13mi |
| 6214 Slate Valley Dr San Antonio, TX | 3.0 | 1.0 | 920 | $1,100 | $1.20 | 23d | 1 | 0.24mi |
| 6619 Freedom Hls San Antonio, TX | 4.0 | 2.5 | 1410 | $1,900 | $1.35 | 2d | 1 | 0.29mi |
| 8671 SW Loop 410 San Antonio, TX | 2.0–3.0 | 2.0 | 1024 | $1,405 | $1.37 | 16d | 7 | 0.29mi |
| 6243 Indian Valley Dr San Antonio, TX | 3.0 | 1.0 | 975 | $1,400 | $1.44 | 4d | 1 | 0.32mi |
| 6627 Freedom Rnch San Antonio, TX | 3.0 | 2.0 | 1400 | $1,750 | $1.25 | 23d | 1 | 0.34mi |
| 6010 Ray Ellison Blvd San Antonio, TX | 1.0–3.0 | 1.0–2.0 | 974 | $1,418 | $1.46 | 43d | 1 | 0.36mi |
| 7411 Hazel Cv San Antonio, TX | 3.0 | 2.0 | 1287 | $1,450 | $1.13 | 16d | 1 | 0.38mi |
| 6230 Hazel Valley St San Antonio, TX | 3.0 | 2.0 | 1344 | $1,650 | $1.23 | 21d | 1 | 0.39mi |
| 7327 Aphelion Cv San Antonio, TX | 3.0 | 2.0 | 1408 | $1,499 | $1.06 | 43d | 1 | 0.57mi |
| 7307 Apastron Haze San Antonio, TX | 3.0 | 2.0 | 1274 | $1,395 | $1.09 | 23d | 1 | 0.68mi |
| 6106 Cedar Valley Dr San Antonio, TX | 3.0 | 1.0 | 984 | $1,375 | $1.40 | 4d | 1 | 0.75mi |
| 7414 Perseus Brk San Antonio, TX | 3.0 | 2.0 | 1186 | $1,475 | $1.24 | 43d | 1 | 0.88mi |
| 6286 Apple Valley Dr San Antonio, TX | 3.0 | 2.0 | 1188 | $1,395 | $1.17 | 2d | 1 | 0.88mi |
| 6719 Dragon Crk San Antonio, TX | 3.0 | 2.0 | 1210 | $1,700 | $1.40 | 23d | 1 | 0.90mi |
| 6911 Hallie Rdg San Antonio, TX | 3.0 | 2.5 | 1463 | $1,475 | $1.01 | 43d | 1 | 0.95mi |
| 6802 Cougar Cv San Antonio, TX | 3.0 | 2.0 | 1251 | $1,550 | $1.24 | 43d | 1 | 0.98mi |
| 6611 Cougar Vlg San Antonio, TX | 3.0 | 2.0 | 1251 | $1,495 | $1.20 | 14d | 1 | 0.98mi |
| 5938 Autumn Palms San Antonio, TX | 3.0 | 2.0 | 1350 | $2,400 | $1.78 | 1d | 1 | 0.99mi |
| 154 Morning Valley St San Antonio, TX | 3.0 | 2.0 | 1400 | $1,300 | $0.93 | 3d | 1 | 1.00mi |
| 9130 Excellence Dr San Antonio, TX | 1.0–4.0 | 1.0–2.0 | 990 | $1,374 | $1.39 | 16d | 1 | 1.06mi |
| 7639 Hercules Pt San Antonio, TX | 3.0 | 2.0 | 1180 | $1,550 | $1.31 | 43d | 1 | 1.10mi |
| 134 Lake Valley St San Antonio, TX | 2.0 | 2.0 | 940 | $1,350 | $1.44 | 43d | 1 | 1.20mi |
| 9126 Selene Pl San Antonio, TX | 3.0 | 2.0 | 1420 | $1,500 | $1.06 | 43d | 1 | 1.23mi |
| 9226 Selene Pl San Antonio, TX | 3.0 | 2.0 | 1300 | $1,575 | $1.21 | 4d | 1 | 1.23mi |
| 9311 Selene Pl San Antonio, TX | 3.0 | 2.0 | 1474 | $1,595 | $1.08 | 23d | 1 | 1.24mi |
| 9406 Coronal Rings San Antonio, TX | 3.0 | 2.0 | 1474 | $1,850 | $1.26 | 43d | 1 | 1.25mi |
| 5927 Mohave Vly San Antonio, TX | 3.0 | 2.0 | 1464 | $1,750 | $1.20 | 23d | 1 | 1.32mi |
| 5611 Elm Valley Dr San Antonio, TX | 3.0 | 2.0 | 1445 | $1,700 | $1.18 | 43d | 1 | 1.33mi |
| 8615 Astral Pl San Antonio, TX | 3.0 | 2.0 | 1450 | $1,699 | $1.17 | 43d | 1 | 1.38mi |
| 8815 Astral Pl San Antonio, TX | 3.0 | 2.0 | 1300 | $1,450 | $1.12 | 4d | 1 | 1.45mi |
| 8938 Solar Cv San Antonio, TX | 4.0 | 2.0 | 1475 | $1,595 | $1.08 | 20d | 1 | 1.47mi |
| 5415 Ray Ellison Blvd San Antonio, TX | 1.0–2.0 | 1.0–2.0 | 878 | $1,240 | $1.41 | 4d | 24 | 1.49mi |
| 7010 Solar Rdg San Antonio, TX | 3.0 | 2.0 | 1276 | $1,495 | $1.17 | 16d | 1 | 1.49mi |
| 7010 Solar Rdg San Antonio, TX | 3.0 | 2.0 | 1276 | $1,725 | $1.35 | 43d | 1 | 1.49mi |
| 5523 Indian Desert St San Antonio, TX | 4.0 | 1.5 | 1192 | $1,325 | $1.11 | 17d | 1 | 1.49mi |
Listing history 20 events
-
2026-06-18days on market $155,000 Active 225 DOM
-
2026-06-17days on market $155,000 Active 224 DOM
-
2026-06-16days on market $155,000 Active 223 DOM
-
2026-06-15days on market $155,000 Active 222 DOM
-
2026-06-13days on market $155,000 Active 220 DOM
-
2026-06-09days on market $155,000 Active 216 DOM
-
2026-06-08days on market $155,000 Active 215 DOM
-
2026-06-07days on market $155,000 Active 214 DOM
-
2026-06-04days on market $155,000 Active 211 DOM
-
2026-06-03days on market $155,000 Active 210 DOM
-
2026-06-02days on market $155,000 Active 209 DOM
-
2026-06-01days on market $155,000 Active 208 DOM
-
2026-05-31days on market $155,000 Active 207 DOM
-
2026-05-13price $155,000 508-char remark
Show marketing remark (508 chars)
Welcome Home to 6334 Big Valley! Tucked away in a peaceful cul-de-sac in the heart of the Lackland City subdivision with minimal traffic and maximum privacy, this charming 3-bedroom, 1-bath home is the perfect place for your family to grow! Enjoy cozy evenings by the fireplace, weekend BBQs in your spacious backyard. With plenty of room for the kids to play and space for entertaining, this home blends comfort, style, and value. At this price, its an incredible opportunity for first-time homebuyers!
-
2026-03-21price $159,999 508-char remark
Show marketing remark (508 chars)
Welcome Home to 6334 Big Valley! Tucked away in a peaceful cul-de-sac in the heart of the Lackland City subdivision with minimal traffic and maximum privacy, this charming 3-bedroom, 1-bath home is the perfect place for your family to grow! Enjoy cozy evenings by the fireplace, weekend BBQs in your spacious backyard. With plenty of room for the kids to play and space for entertaining, this home blends comfort, style, and value. At this price, its an incredible opportunity for first-time homebuyers!
-
2026-01-04price $165,000 508-char remark
Show marketing remark (508 chars)
Welcome Home to 6334 Big Valley! Tucked away in a peaceful cul-de-sac in the heart of the Lackland City subdivision with minimal traffic and maximum privacy, this charming 3-bedroom, 1-bath home is the perfect place for your family to grow! Enjoy cozy evenings by the fireplace, weekend BBQs in your spacious backyard. With plenty of room for the kids to play and space for entertaining, this home blends comfort, style, and value. At this price, its an incredible opportunity for first-time homebuyers!
-
2025-12-12price $170,000 508-char remark
Show marketing remark (508 chars)
Welcome Home to 6334 Big Valley! Tucked away in a peaceful cul-de-sac in the heart of the Lackland City subdivision with minimal traffic and maximum privacy, this charming 3-bedroom, 1-bath home is the perfect place for your family to grow! Enjoy cozy evenings by the fireplace, weekend BBQs in your spacious backyard. With plenty of room for the kids to play and space for entertaining, this home blends comfort, style, and value. At this price, its an incredible opportunity for first-time homebuyers!
-
2025-11-05$175,000 New 508-char remark
Show marketing remark (508 chars)
Welcome Home to 6334 Big Valley! Tucked away in a peaceful cul-de-sac in the heart of the Lackland City subdivision with minimal traffic and maximum privacy, this charming 3-bedroom, 1-bath home is the perfect place for your family to grow! Enjoy cozy evenings by the fireplace, weekend BBQs in your spacious backyard. With plenty of room for the kids to play and space for entertaining, this home blends comfort, style, and value. At this price, its an incredible opportunity for first-time homebuyers!
-
1999-05-07soldstatus
-
1985-04-01soldstatus
ⓘ Source: listings_history table (triggers on properties + properties_extension) + one-shot
backfill from property_details.listing_events for pre-trigger history.
Tax reassessment forecast TX · Resets to sale price
- Current annual tax
- $3,304 · $275/mo
- Projected year-2 tax
- $3,304 · $275/mo
- Expected delta
- $0/yr ($0/mo · 0.0%)
ⓘ Screening estimate from a state-policy table — verify with the county assessor before closing.
Climate risk First Street
- Flood 1/10 Low FEMA zone X (unshaded) · 0% chance over 30 yrs
- Wildfire 4/10 Moderate
- Heat 8/10 Severe 7 d/yr ≥109°F today · 22 d/yr by 30 yrs out
- Wind 8/10 Severe 80% chance of damaging wind over 30 yrs
- Air quality 2/10 Low 1 unhealthy d/yr today · 1 by 30 yrs out
Nearby sold comps map
Loading sold comps map…
Walkable amenities ~0.75 mi
Loading nearby amenities…
Taxation est. · year 1
- Rental income
- $19,210
- − Mortgage interest
- −$8,682
- − Property taxes
- −$3,304
- − Insurance
- −$775
- − Repairs & maintenance
- −$1,537
- − Management
- −$1,537
- − Depreciation
- −$4,509
- Taxable loss
- −$1,134
- Est. tax savings @ 24.0%
- +$272
- After-tax cash flow
- $1,615/yr
For passive investors: Depreciation is non-cash, so a rental often shows a tax loss while cash-flowing — sheltering income. Rental losses are passive: they offset passive income freely, and up to $25,000/yr can offset ordinary (W-2) income if you actively participate and your MAGI is under $100k (phasing out to $0 by $150k); unused losses carry forward. On sale, claimed depreciation is recaptured at up to 25%, and gains may owe capital-gains tax (a 1031 exchange can defer both). Figures are a year-1 estimate at your 24.0% rate — not tax advice; consult a CPA.
Schools (NCES district)
- District
- South San Antonio ISD
- NCES district ID
- 4840680
- Math proficiency
- 13% ▼ -20.00%
- Reading proficiency
- 20% ▼ -10.00%
- Median HH income
- $35,460
- Composite
- 13.6/100
- National rank
- #9511
- State rank
- #804 of 826 in TX
Livability — San Antonio
- Score
- 80/100
- State rank
- #31
- US rank
- #1616
Category grades
Schools grade is shown separately in the Schools card above.
Census & demographics
- Census place
- San Antonio, TX
- County
- Bexar County · 1,990,555 people
- City population
- 1,806,925
- Metro
- San Antonio-New Braunfels, TX
- Population (ZIP)
- 36,168
- Household income
- $50,644
- Rent vs Own
- Severe rent burden
- 1778.0
Population outlook (Bexar County) Hauer SSP2
- Today (2025)
- 2,336,851 people
- By 2030
- 2,560,728 · +9.6%
- By 2040
- 3,020,569 · +29.3%
- By 2050
- 3,493,522 · +49.5%
- By 2075
- 4,668,459 · +99.8%
- By 2100
- 5,533,242 · +136.8%
Race, ethnicity, and origin ACS 2023
- Neighborhood character
- Predominantly Hispanic (86%)
- Race & ethnicity
- Hispanic / Latino 86% Two or more races 25% White 8% Black 3% Native American 2%
- Hispanic origin (detail)
- Mexican 67%
- Common ancestry
- Romanian 1% Italian 1%
- Foreign-born
- 20% · Canada
- Languages at home
- 43% English-only · Spanish 55%
Political lean MEDSL · Bexar
- 2024 margin
- Lean D (+9.8) · D 54.3% · R 44.6% · Other 1.1%
- 2008→2024 swing
- +4.2pp toward D · 2008: 5.6pp · 2024: 9.8pp
- All cycles
- 2024: D+9.8 2020: D+18.2 2016: D+13.5 2012: D+4.6 2008: D+5.6
Not yet ingested
- Civics
- —
Market trends
- HPI YoY
- ▼ -55.63%
- Current HPI
- 259.9788
- Rent YoY
- ▼ -1.32%
- Metro
- San Antonio-New Braunfels, TX
- State GDP YoY
- ▲ 3.95%
- F500 in state
- 110
Industry mix (Fortune 500 HQ in TX)
| Industry | F500 HQs | Revenue |
|---|---|---|
| Energy | 16 | $1,198B |
|
||
| Technology | 5 | $198B |
|
||
| Engineering / Construction | 4 | $72B |
|
||
| Energy Services | 3 | $60B |
|
||
| Utilities | 3 | $41B |
|
||
| Healthcare | 2 | $330B |
|
||
Price history
-11.4% since first listed7 events — show timeline
- 2026-05-13 Price Changed $155,000 LERA
- 2026-03-21 Price Changed $159,999 LERA
- 2026-01-04 Price Changed $165,000 LERA
- 2025-12-12 Price Changed $170,000 LERA
- 2025-11-05 Listed $175,000 LERA
- 1999-05-07 Sold (Public Records) — Public Records
- 1985-04-01 Sold (Public Records) — Public Records
Property tax history
+6.1%/yrLatest (2025): $3,304 · +10.0% YoY. Source: county tax records.
Cash-flow waterfall
monthlySold comps — $/sqft
last 12 mo · ≤1 miLoading sold comps…