 21-Plex
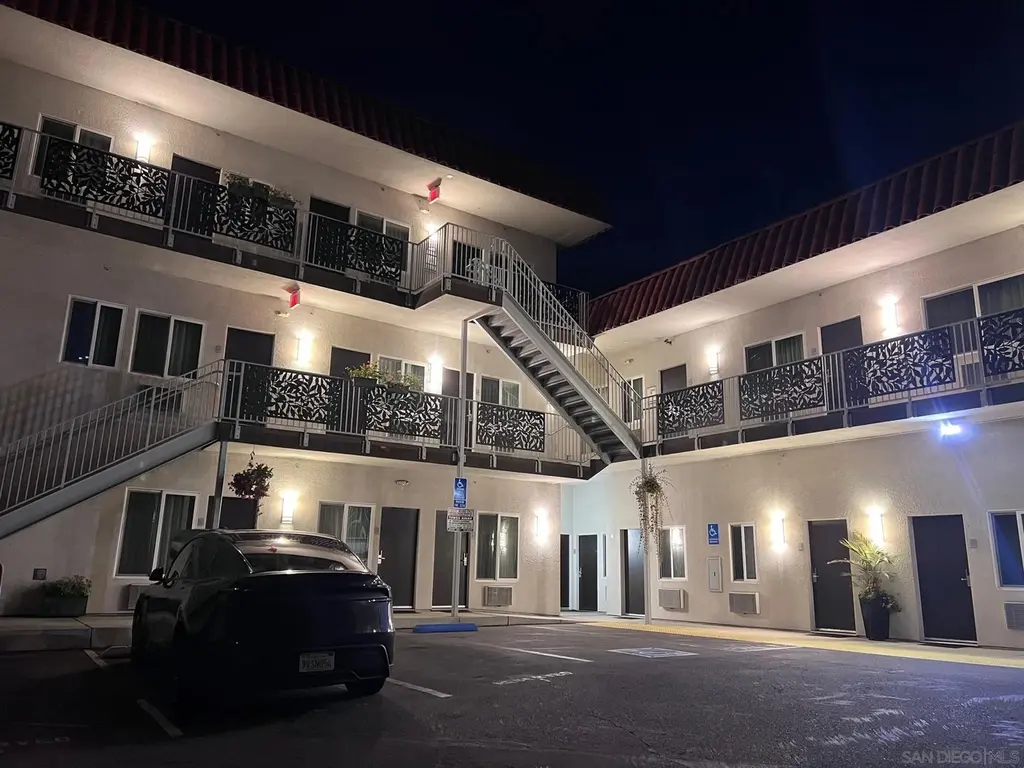
2188 San Diego Ave · San Diego, CA
Flood risk 1/10 · Minimal
- FEMA flood zone
- X (unshaded)
- Chance of flooding over 30 yrs
- 0.0%
- Est. flood insurance / yr
- $507 – $1,088
Fire risk 1/10 · Minimal
- Est. fire insurance / yr
- $659 – $1,223
Heat risk 3/10 · Minor
- Hot days now (above 85°F)
- 7 days/yr
- Hot days in 30 yrs
- 20 days/yr
Wind risk 1/10 · Minimal
- Chance of severe wind over 30 yrs
- —
Air-quality risk 4/10 · Minor
- Unhealthy air days now
- 4 days/yr
- Unhealthy air days in 30 yrs
- 4 days/yr
Risk factors via First Street. Map © Google.
Why this score? — see what drove the C+ grade
The composite is a weighted blend of 9 inputs, each scored 0–100. Each bar is that input's sub-score; the figure is the points it added to the 100-point composite (weight × sub-score).
- Cash flow +26.5/30.0
- DSCR +9.0/10.0
- ARV discount +7.5/15.0
- 1% rule +6.6/10.0
- Livability +3.8/5.0
- Rent growth +2.6/5.0
- Condition / age +2.5/5.0
- Schools +2.2/10.0
- Appreciation +0.0/10.0
$6,300,000
🖨 Deal sheet 📄 Offer letter ✓ Due diligence
Multi-family units
County records classify this as Multi-Family (5+ Unit). Listing-text estimate: 21 units. confirmed
5+ unit building — per-unit beds/baths from public records are typically unavailable; the breakdown below (if shown) is an estimate from the listing text.
Listing remarks
Turnkey, well maintained 21 unit multi-family located in highly desirable Old Town/Mission Hills Completely rebuilt/repurposed/remodeled in 2017/2018, AB 1482 exempt Walkable neighborhood, walk to restaurants, bars, shops, and Old Town train station (Amtrak, Coaster, SD Trolley, etc. ) Owned laundry with Bluetooth technology Energy efficient upgrades throughout Agent has ownership interest
Key facts
- Owned laundry
- 7,768 sq ft lot
- 5 parking spots
Tags
Property features AI
Exterior
- Parking: 5 parking spaces
- Home design: Residential income property; Commercial-residential income subtype
- Construction: Stucco exterior
- Exterior features: Composition roof
Interior
- Bathrooms: 21 full bathrooms
- Heating & cooling: Wall/window air conditioning units
- Interior features: Has cooling
Neighborhood map
What this means for you Summary
Snapshot
- This is a 21 × 7-bed/21.0-bath units multifamily listed at $6.30M.
Deal economics
- At list price, monthly cash flow is $17k ($200k/yr) — positive. Per door: $793/mo.
- The deal already cash-flows at list — no discount required.
- Meets the 1% rule at list price ($73k rent vs $6.30M).
- Recommended offer: $5.92M (6.0% below list) — sets the bar for market timing.
- Cap rate 9.5% vs local median 2.0% in San Diego — top-decile yield for the area; either an underpriced asset or a hidden risk that comps aren't pricing in. Stress-test before assuming the spread holds.
Location & tenants
- Location reads 75/100 on livability (#123 in CA, #4,206 nationally) — a middle-class / working-renter tenant base. Strengths: amenities A+, commute A+, employment A+; Watch: health & safety C-, crime D+, cost of living F.
- San Diego Unified (urban): math 19% / reading 29% proficiency, ranked #393 of 517 in CA (top 76%) — low school quality limits family demand, transient renter base, plan for 1-2y turnover.
- Market conditions: Rents flat; 127 active listings in the ZIP; high-income renter base; 11,759 units permitted in San Diego County in 2024 (7,244 in 5+ unit buildings).
- At $73,068/mo this rent would consume 791% of the median local household income ($111k/yr) (locally 1894% of renters already pay >50% of income on rent) — very limited rent-growth headroom before tenants either downsize or default.
Forward outlook
- Local home prices are declining (-3.0%/yr); year-one equity from $44k of loan paydown is wiped out by about $189k of value loss. Plan a longer hold.
- San Diego County population projected at +20% by 2050 — long-run rental-demand tailwind backs the buy-and-hold thesis.
Negotiation context
- It's been on market 63 days — a 6% lower offer ($5.92M) is reasonable based on typical stale-listing flexibility.
- Current owner paid $775k; list at $6.30M implies a 713% gain — meaningful room to come down on a strong offer.
Questions for the listing agent
- It's been on market 63 days. Have you received any prior offers? Is the seller open to a 6% concession, seller financing, or rate buy-down credit?
- Can we see the unit-by-unit rent roll, current vacancy, and any below-market leases? What's the average tenancy length?
- What capital expenditures (roof, boiler, parking lot, exteriors) have been made in the last 5 years, and what's planned in the next 2?
- Built in 1965 — when were the roof, HVAC, electrical panel, plumbing, and water heater last replaced?
- Why hasn't it sold? Are there any deal-killer items the seller is aware of (foundation, flood, title, zoning, code violations)?
- Is there a deadline driving the sale (1031 exchange, divorce, estate, relocation)? That informs how much negotiation room exists.
- Schools are B-rated — typically a magnet for longer-tenancy family renters. What's the average tenant stay here, and is there a school-zone premium baked into asking?
- Crime grade is D in this area — have there been break-ins, vandalism, or insurance claims at this property in the last 3 years? What carrier currently insures it and at what premium?
- What's the average days-on-market for RENTAL listings here right now (not sales)? A rising rental-DOM trend means longer vacancies and softer asking-rent achievability than the comps imply.
- What's the recent tenant-quality profile in this submarket — average credit score on applications, eviction rate, late-payment / NSF rate, and stable-employment percentage? A property-management company in the area should have these aggregated.
- How much new apartment / multifamily construction is in the pipeline within 1–3 miles? Heavy new supply (>2% of stock underway) typically softens rents 12–24 months out; light construction supports rent growth.
Investment metrics
- 1% rule
- 1.16% ✓
- Cap rate
- 9.46%
- Cash-on-cash
- 11.32%
- DSCR
- 1.50
- GRM
- 7.2
CMA / ARV
No comps found within radius.
Projected returns pro-forma
-3.0% appreciation · 0.36% rent growth · sell at horizon
- IRR
- -2.3%
- Equity multiple
- 0.91×
- Total profit
- $-150,315
- Equity at exit
- $939,350
- IRR
- 4.3%
- Equity multiple
- 1.28×
- Total profit
- $496,424
- Equity at exit
- $544,709
Cash invested: $1,764,000 (down + closing). Projections, not guarantees.
Landlord ↔ Tenant lean methodology
- Overall (STATE)
- 18 Strongly Tenant-Friendly
- State California
- 18 Strongly Tenant-Friendly · D+13
- County
- — inherits STATE
- City
- — inherits STATE
ZIP-level market 92110
- Rents YoY
- 0.4%
- Active inventory
- 127
- Price-to-rent
- 150.9×
Monthly cashflow live
- Estimated rent
- $73,068 medium interval (Pro) →
- Mortgage (P&I)
- −$33,038
- Tax from tax record
- −$5,417 /mo · $65,001/yr
- Insurance
- −$2,625
- HOA
- −$0
- Vacancy / Maint / Mgmt
- −$15,344
- Net cashflow
- $16,644
Break-even live
21-unit breakdown (identical units grouped — click to expand)
| Units | Beds | Baths | Est. rent |
|---|---|---|---|
| 21× units | 7 | 21 | $73,059 |
| #1 | 7 | 21 | $3,479 |
| #2 | 7 | 21 | $3,479 |
| #3 | 7 | 21 | $3,479 |
| #4 | 7 | 21 | $3,479 |
| #5 | 7 | 21 | $3,479 |
| #6 | 7 | 21 | $3,479 |
| #7 | 7 | 21 | $3,479 |
| #8 | 7 | 21 | $3,479 |
| #9 | 7 | 21 | $3,479 |
| #10 | 7 | 21 | $3,479 |
| #11 | 7 | 21 | $3,479 |
| #12 | 7 | 21 | $3,479 |
| #13 | 7 | 21 | $3,479 |
| #14 | 7 | 21 | $3,479 |
| #15 | 7 | 21 | $3,479 |
| #16 | 7 | 21 | $3,479 |
| #17 | 7 | 21 | $3,479 |
| #18 | 7 | 21 | $3,479 |
| #19 | 7 | 21 | $3,479 |
| #20 | 7 | 21 | $3,479 |
| #21 | 7 | 21 | $3,479 |
| Total (21 units) | $73,068 | ||
UW: 25.0% down · 7.5% · 30yr · 1.5% tax · 5.0% vac · 8.0% maint · 8.0% mgmt
Financing live
Cash to close
- Down payment
- $1,575,000
- Closing costs
- $189,000
- Reserves months
- —
- Total cash needed
- —
Loan-product check · same deal, 3 products live
Conventional
25% down · 7.5% · 30yr
- Down + closing
- —
- Monthly P&I
- —
- Monthly cashflow
- —
- DSCR
- —
- Eligible?
- —
Personal DTI + credit; lowest rate.
DSCR
20% down · 8.5% · 30yr
- Down + closing
- —
- Monthly P&I
- —
- Monthly cashflow
- —
- DSCR
- —
- Eligible?
- —
No personal income docs; deal must DSCR.
Hard money
10% down · 12.0% · 12mo
- Down + closing
- —
- Monthly P&I
- —
- Monthly cashflow
- —
- DSCR
- —
- Eligible?
- —
Short-term bridge; refi at stabilization.
Listing history 17 events
-
2026-06-18days on market $6,300,000 Active 63 DOM
-
2026-06-17days on market $6,300,000 Active 62 DOM
-
2026-06-16days on market $6,300,000 Active 61 DOM
-
2026-06-15days on market $6,300,000 Active 60 DOM
-
2026-06-13days on market $6,300,000 Active 58 DOM
-
2026-06-09days on market $6,300,000 Active 54 DOM
-
2026-06-08days on market $6,300,000 Active 53 DOM
-
2026-06-07days on market $6,300,000 Active 52 DOM
-
2026-06-04days on market $6,300,000 Active 49 DOM
-
2026-06-03days on market $6,300,000 Active 48 DOM
-
2026-06-02days on market $6,300,000 Active 47 DOM
-
2026-06-01days on market $6,300,000 Active 46 DOM
-
2026-05-31days on market $6,300,000 Active 45 DOM
-
2026-04-16$6,300,000 Active
-
2014-06-02soldstatus $775,000
-
1997-12-23soldstatus $270,000
-
1992-12-31soldstatus $450,000
ⓘ Source: listings_history table (triggers on properties + properties_extension) + one-shot
backfill from property_details.listing_events for pre-trigger history.
Tax reassessment forecast CA · Resets to sale price
- Current annual tax
- $65,001 · $5,417/mo
- Projected year-2 tax
- $65,001 · $5,417/mo
- Expected delta
- $0/yr ($0/mo · 0.0%)
ⓘ Screening estimate from a state-policy table — verify with the county assessor before closing.
Climate risk First Street
- Flood 1/10 Low FEMA zone X (unshaded) · 0% chance over 30 yrs
- Wildfire 1/10 Low
- Heat 3/10 Moderate 7 d/yr ≥85°F today · 20 d/yr by 30 yrs out
- Wind 1/10 Low
- Air quality 4/10 Moderate 4 unhealthy d/yr today · 4 by 30 yrs out
Nearby sold comps map
Loading sold comps map…
Walkable amenities ~0.75 mi
Loading nearby amenities…
Taxation est. · year 1
- Rental income
- $876,816
- − Mortgage interest
- −$352,898
- − Property taxes
- −$65,001
- − Insurance
- −$31,500
- − Repairs & maintenance
- −$70,145
- − Management
- −$70,145
- − Depreciation
- −$183,273
- Taxable income
- $103,854
- Est. tax owed @ 24.0%
- −$24,925
- After-tax cash flow
- $174,804/yr
For passive investors: Depreciation is non-cash, so a rental often shows a tax loss while cash-flowing — sheltering income. Rental losses are passive: they offset passive income freely, and up to $25,000/yr can offset ordinary (W-2) income if you actively participate and your MAGI is under $100k (phasing out to $0 by $150k); unused losses carry forward. On sale, claimed depreciation is recaptured at up to 25%, and gains may owe capital-gains tax (a 1031 exchange can defer both). Figures are a year-1 estimate at your 24.0% rate — not tax advice; consult a CPA.
Schools (NCES district)
- District
- San Diego Unified
- NCES district ID
- 0634320
- Math proficiency
- 19% ▼ -29.00%
- Reading proficiency
- 29% ▼ -28.00%
- Median HH income
- $61,673
- Composite
- 22.31/100
- National rank
- #8135
- State rank
- #393 of 517 in CA
Livability — San Diego
- Score
- 75/100
- State rank
- #123
- US rank
- #4206
Category grades
Schools grade is shown separately in the Schools card above.
Census & demographics
- Census place
- San Diego, CA
- County
- San Diego County · 3,178,799 people
- City population
- 1,397,612
- Metro
- San Diego-Chula Vista-Carlsbad, CA
- Population (ZIP)
- 30,902
- Household income
- $110,790
- Rent vs Own
- Severe rent burden
- 1894.0
Population outlook (San Diego County) Hauer SSP2
- Today (2025)
- 3,678,185 people
- By 2030
- 3,856,546 · +4.8%
- By 2040
- 4,171,407 · +13.4%
- By 2050
- 4,421,607 · +20.2%
- By 2075
- 4,831,599 · +31.4%
- By 2100
- 4,832,502 · +31.4%
Race, ethnicity, and origin ACS 2023
- Neighborhood character
- Diverse neighborhood (Simpson 0.61)
- Race & ethnicity
- White 59% Hispanic / Latino 18% Two or more races 16% Asian 7% Black 5% Native American 1%
- Hispanic origin (detail)
- Mexican 13% Puerto Rican 1%
- Common ancestry
- Italian 3% Romanian 2% Lithuanian 2%
- Foreign-born
- 13% · Canada, China, South Korea
- Languages at home
- 77% English-only · Spanish 10% Other Indo-European 4% Chinese 2%
Political lean MEDSL · San Diego
- 2024 margin
- D (+16.8) · D 56.9% · R 40.1% · Other 2.9%
- 2008→2024 swing
- +6.6pp toward D · 2008: 10.2pp · 2024: 16.8pp
- All cycles
- 2024: D+16.8 2020: D+22.8 2016: D+17.8 2012: D+5.1 2008: D+10.2
Not yet ingested
- Civics
- —
Market trends
- HPI YoY
- ▼ -670.72%
- Current HPI
- 414.3971
- Rent YoY
- ▲ 0.36%
- Metro
- San Diego-Chula Vista-Carlsbad, CA
- State GDP YoY
- ▲ 3.21%
- F500 in state
- 116
Industry mix (Fortune 500 HQ in CA)
| Industry | F500 HQs | Revenue |
|---|---|---|
| Technology | 27 | $1,492B |
|
||
| Financial Services | 3 | $174B |
|
||
| Retail | 3 | $44B |
|
||
| Insurance | 3 | $26B |
|
||
| Media / Entertainment | 2 | $115B |
|
||
| Pharmaceuticals / Biotech | 2 | $62B |
|
||
Price history
+1300.0% since first listed4 events — show timeline
- 2026-04-16 Listed $6,300,000 SDMLS
- 2014-06-02 Sold (Public Records) $775,000 Public Records
- 1997-12-23 Sold (Public Records) $270,000 Public Records
- 1992-12-31 Sold (Public Records) $450,000 Public Records
Property tax history
+27.0%/yrLatest (2025): $65,001 · +3.9% YoY. Source: county tax records.
Cash-flow waterfall
monthlySold comps — $/sqft
last 12 mo · ≤1 miLoading sold comps…