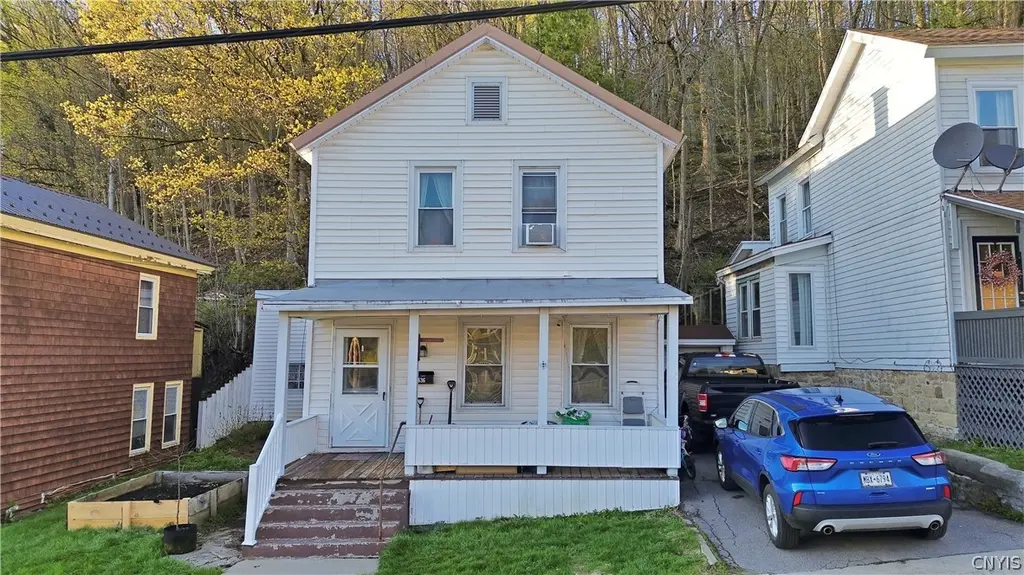
636 E Monroe St · Little Falls, NY
Flood risk 1/10 · Minimal
- FEMA flood zone
- —
- Chance of flooding over 30 yrs
- 0.0%
- Est. flood insurance / yr
- —
Fire risk 1/10 · Minimal
- Est. fire insurance / yr
- $691 – $1,283
Heat risk 2/10 · Minimal
- Hot days now (above 95°F)
- 7 days/yr
- Hot days in 30 yrs
- 16 days/yr
Wind risk 2/10 · Minimal
- Chance of severe wind over 30 yrs
- 1.0%
Air-quality risk 1/10 · Minimal
- Unhealthy air days now
- 0 days/yr
- Unhealthy air days in 30 yrs
- 0 days/yr
Risk factors via First Street. Map © Google.
Why this score? — see what drove the B- grade
The composite is a weighted blend of 9 inputs, each scored 0–100. Each bar is that input's sub-score; the figure is the points it added to the 100-point composite (weight × sub-score).
- Cash flow +18.5/30.0
- ARV discount +14.8/15.0
- Appreciation +10.0/10.0
- DSCR +5.8/10.0
- 1% rule +4.8/10.0
- Schools +3.6/10.0
- Livability +3.5/5.0
- Rent growth +2.5/5.0
- Condition / age +2.5/5.0
$122,900
🖨 Deal sheet 📄 Offer letter ✓ Due diligence
Listing remarks
Welcome to 636 East Monroe Street in Little Falls—a strong opportunity packed with value, space, and upside. This 2-story home offers 3 bedrooms and 1,396 square feet of living space, delivering the kind of layout and potential that today’s buyers are chasing. Step inside and you’ll immediately appreciate the functional flow, with a spacious living area that transitions easily for everyday living or entertaining. The kitchen offers ample space and the opportunity to customize to your style. A major convenience on the first floor is the combined half bath and laundry area—adding practicality and efficiency to daily living. Upstairs, you’ll find three well-sized
Key facts
- One-stall garage
- Spacious living area
- Full attic
Tags
Property features AI
Exterior
- Parking: Attached garage (1 car)
- Utilities: Public water connected; Sewer connected; Cable available; High-speed internet available
- Home design: 2-story house; Resale property
- Construction: Vinyl siding; Metal roof; Block foundation; Existing (year built details)
- Exterior features: Blacktop driveway; Open porch
Interior
- Kitchen: Dishwasher; Free-standing range / Oven; Refrigerator
- Bedrooms: Total rooms: 7 (includes living spaces and laundry)
- Flooring: Carpet; Hardwood; Tile; Varies
- Bathrooms: 1 full bathroom; 1 half bathroom; 1 main-level bathroom
- Heating & cooling: Gas forced-air heating
- Interior features: Eat-in kitchen; Separate/formal living room; Storm windows; Thermal windows; Wood window frames
- Laundry & utility: Main-level laundry; Electric water heater
Neighborhood map
What this means for you Summary
Snapshot
- This is a 3-bed/1.0-bath single-family listed at $123k.
Deal economics
- At list price, monthly cash flow is $117 ($1k/yr) — positive.
- The deal already cash-flows at list — no discount required.
- To meet the 1% rule (rent ≥ 1% of price), the offer needs to be $120k (2.1% below list).
- Recommended offer: $119k (3.0% below list) — sets the bar for market timing.
Location & tenants
- Location reads 70/100 on livability (#440 in NY) — a middle-class / working-renter tenant base. Strengths: crime A+, cost of living A+, health & safety A+; Watch: schools C-, amenities F, commute F.
- Little Falls City School District (rural): math 37% / reading 49% proficiency, ranked #492 of 590 in NY (top 83%) — families likely to look elsewhere, expect single-tenant / working-renter base with shorter leases.
- Market conditions: 66 active listings in the ZIP; 54 units permitted in Herkimer County in 2024 (0 in 5+ unit buildings).
Forward outlook
- In year one you build about $13k of equity ($850 loan paydown + $12k appreciation (10.0% local appreciation)).
- Herkimer County population projected at -24% by 2050 — secular population decline; favor cash flow + early exit over multi-decade hold.
- At projected returns (10.0% appreciation + 3.0% rent growth), your $34k cash investment doubles in ~3 years — after that, you're playing with house money.
- By year 3, paydown + projected appreciation supports a ~$33k cash-out refi (75% LTV) — recoverable capital for the next deal without selling this one.
Negotiation context
- It's been on market 56 days — a 3% lower offer ($119k) is reasonable based on typical stale-listing flexibility.
- Current owner paid $53k; list at $123k implies a 132% gain — meaningful room to come down on a strong offer.
Risks & watch-outs
- Watch-outs: built in 1873 — expect roof / HVAC / electrical / plumbing capex.
Questions for the listing agent
- It's been on market 56 days. Have you received any prior offers? Is the seller open to a 3% concession, seller financing, or rate buy-down credit?
- Built in 1873 — when were the roof, HVAC, electrical panel, plumbing, and water heater last replaced?
- Is there a deadline driving the sale (1031 exchange, divorce, estate, relocation)? That informs how much negotiation room exists.
- What's the average days-on-market for RENTAL listings here right now (not sales)? A rising rental-DOM trend means longer vacancies and softer asking-rent achievability than the comps imply.
- What's the recent tenant-quality profile in this submarket — average credit score on applications, eviction rate, late-payment / NSF rate, and stable-employment percentage? A property-management company in the area should have these aggregated.
- How much new for-sale + rental construction is in the pipeline within 1–3 miles? Heavy new supply typically softens prices + rents 12–24 months out; constrained supply supports both.
Investment metrics
- 1% rule
- 0.98% ✗
- Cap rate
- 7.44%
- Cash-on-cash
- 4.10%
- DSCR
- 1.18
- GRM
- 8.5
CMA / ARV
- ARV (median comp)
- $146,648
- List price
- $122,900
- Delta
- -16.19%
- Verdict
- UNDERPRICED
- Comps
- 20 within 1.0 mi
Show comp detail 7 sales within ~0.75 mi
| Address | Dist | Beds/Ba | Sqft | Sold | Price | $/sf | Match |
|---|---|---|---|---|---|---|---|
| 22 High St | 0.21mi | 3/1.0 | 1,520 (+9%) | 9mo | $115,000 | $76 | 68 |
| 121 Loomis St | 0.38mi | 2/2.0 (-1) | 1,358 (-3%) | 2mo | $107,000 | $79 | 67 |
| 26 Petrie St | 0.28mi | 3/1.5 | 1,456 (+4%) | 18mo | $155,000 | $106 | 63 |
| 227 Loomis St | 0.62mi | 3/1.0 | 1,404 (+1%) | 10mo | $115,000 | $82 | 61 |
| 118 Prospect St | 0.61mi | 3/1.5 | 1,310 (-6%) | 1mo | $152,000 | $116 | 59 |
| 87 Prospect St | 0.61mi | 3/1.5 | 1,400 (+0%) | 13mo | $100,000 | $71 | 58 |
| 266 Loomis St | 0.72mi | 4/1.5 (+1) | 1,496 (+7%) | 17mo | $70,100 | $47 | 34 |
Match score weights: distance 35% · size 25% · config 20% · recency 20%. Top-matched comps best support the ARV.
Projected returns pro-forma
10.0% appreciation · 3.0% rent growth · sell at horizon
- IRR
- 27.2%
- Equity multiple
- 3.16×
- Total profit
- $74,423
- Equity at exit
- $110,718
- IRR
- 23.8%
- Equity multiple
- 7.20×
- Total profit
- $213,298
- Equity at exit
- $238,768
Cash invested: $34,412 (down + closing). Projections, not guarantees.
Landlord ↔ Tenant lean methodology
- Overall (STATE)
- 15 Strongly Tenant-Friendly
- State New York
- 15 Strongly Tenant-Friendly · D+10
- County
- — inherits STATE
- City
- — inherits STATE
ZIP-level market 13365
- Home prices YoY
- 9.9%
- Active inventory
- 66
- Price-to-rent
- 8.5×
Monthly cashflow live
- Estimated rent
- $1,203 medium interval (Pro) →
- Mortgage (P&I)
- −$645
- Tax from tax record
- −$137 /mo · $1,650/yr
- Insurance
- −$51
- HOA
- −$0
- Vacancy / Maint / Mgmt
- −$253
- Net cashflow
- $117
Break-even live
UW: 25.0% down · 7.5% · 30yr · 1.5% tax · 5.0% vac · 8.0% maint · 8.0% mgmt
Financing live
Cash to close
- Down payment
- $30,725
- Closing costs
- $3,687
- Reserves months
- —
- Total cash needed
- —
Loan-product check · same deal, 3 products live
Conventional
25% down · 7.5% · 30yr
- Down + closing
- —
- Monthly P&I
- —
- Monthly cashflow
- —
- DSCR
- —
- Eligible?
- —
Personal DTI + credit; lowest rate.
DSCR
20% down · 8.5% · 30yr
- Down + closing
- —
- Monthly P&I
- —
- Monthly cashflow
- —
- DSCR
- —
- Eligible?
- —
No personal income docs; deal must DSCR.
Hard money
10% down · 12.0% · 12mo
- Down + closing
- —
- Monthly P&I
- —
- Monthly cashflow
- —
- DSCR
- —
- Eligible?
- —
Short-term bridge; refi at stabilization.
Listing history 18 events
-
2026-06-18price $122,900 Active 56 DOM
-
2026-06-18days on market $129,900 Active 56 DOM
-
2026-06-17days on market $129,900 Active 55 DOM
-
2026-06-16days on market $129,900 Active 54 DOM
-
2026-06-15days on market $129,900 Active 53 DOM
-
2026-06-13days on market $129,900 Active 51 DOM
-
2026-06-12days on market $129,900 Active 50 DOM
-
2026-06-09days on market $129,900 Active 47 DOM
-
2026-06-08days on market $129,900 Active 46 DOM
-
2026-06-07days on market $129,900 Active 45 DOM
-
2026-06-07days on market $129,900 Active 44 DOM
-
2026-06-04days on market $129,900 Active 41 DOM
-
2026-06-02days on market $129,900 Active 40 DOM
-
2026-06-01days on market $129,900 Active 39 DOM
-
2026-05-31days on market $129,900 Active 38 DOM
-
2026-05-14price $129,900 1489-char remark
-
2026-04-23$139,900 Active 1489-char remark
-
2018-09-20soldstatus $53,000
ⓘ Source: listings_history table (triggers on properties + properties_extension) + one-shot
backfill from property_details.listing_events for pre-trigger history.
Tax reassessment forecast NY · Partial reset (capped growth)
- Current annual tax
- $1,650 · $137/mo
- Projected year-2 tax
- $1,863 · $155/mo
- Expected delta
- +$214/yr (+$18/mo · 13.0%)
ⓘ Screening estimate from a state-policy table — verify with the county assessor before closing.
Climate risk First Street
- Flood 1/10 Low 0% chance over 30 yrs
- Wildfire 1/10 Low
- Heat 2/10 Low 7 d/yr ≥95°F today · 16 d/yr by 30 yrs out
- Wind 2/10 Low 100% chance of damaging wind over 30 yrs
- Air quality 1/10 Low 0 unhealthy d/yr today · 0 by 30 yrs out
Nearby sold comps map
Loading sold comps map…
Walkable amenities ~0.75 mi
Loading nearby amenities…
Taxation est. · year 1
- Rental income
- $14,440
- − Mortgage interest
- −$6,884
- − Property taxes
- −$1,650
- − Insurance
- −$614
- − Repairs & maintenance
- −$1,155
- − Management
- −$1,155
- − Depreciation
- −$3,575
- Taxable loss
- −$594
- Est. tax savings @ 24.0%
- +$143
- After-tax cash flow
- $1,552/yr
For passive investors: Depreciation is non-cash, so a rental often shows a tax loss while cash-flowing — sheltering income. Rental losses are passive: they offset passive income freely, and up to $25,000/yr can offset ordinary (W-2) income if you actively participate and your MAGI is under $100k (phasing out to $0 by $150k); unused losses carry forward. On sale, claimed depreciation is recaptured at up to 25%, and gains may owe capital-gains tax (a 1031 exchange can defer both). Figures are a year-1 estimate at your 24.0% rate — not tax advice; consult a CPA.
Schools (NCES district)
- District
- Little Falls City School District
- NCES district ID
- 3617460
- Math proficiency
- 37% ▼ -10.00%
- Reading proficiency
- 49% ▲ 7.00%
- Median HH income
- $42,445
- Composite
- 36.22/100
- National rank
- #4724
- State rank
- #492 of 590 in NY
Livability — Little Falls
- Score
- 70/100
- State rank
- #440
- US rank
- #7681
Category grades
Schools grade is shown separately in the Schools card above.
Census & demographics
- Census place
- Little Falls, NY
- Population (ZIP)
- 8,545
Population outlook (Herkimer County) Hauer SSP2
- Today (2025)
- 59,340 people
- By 2030
- 56,838 · -4.2%
- By 2040
- 51,098 · -13.9%
- By 2050
- 45,080 · -24.0%
- By 2075
- 32,648 · -45.0%
- By 2100
- 22,266 · -62.5%
Race, ethnicity, and origin ACS 2023
- Neighborhood character
- Predominantly White (92%)
- Race & ethnicity
- White 92% Hispanic / Latino 5% Two or more races 4%
- Hispanic origin (detail)
- Puerto Rican 4%
- Common ancestry
- Romanian 8% Lithuanian 3% Polish 2%
- Foreign-born
- 1%
- Languages at home
- 95% English-only · German/W. Germanic 3% Spanish 2% Other Indo-European 1%
Political lean MEDSL · Herkimer
- 2024 margin
- Solid R (+36.4) · D 31.8% · R 68.2%
- 2008→2024 swing
- -27.1pp toward R · 2008: -9.3pp · 2024: -36.4pp
- All cycles
- 2024: R+36.4 2020: R+30.5 2016: R+34.5 2012: R+8.4 2008: R+9.3
Not yet ingested
- Civics
- —
Market trends
- HPI YoY
- ▲ 27.04%
- Current HPI
- 300.9696
- Rent YoY
- —
- Metro
- —
- State GDP YoY
- ▲ 2.60%
- F500 in state
- 92
Industry mix (Fortune 500 HQ in NY)
| Industry | F500 HQs | Revenue |
|---|---|---|
| Financial Services | 10 | $950B |
|
||
| Consumer Goods | 9 | $162B |
|
||
| Insurance | 4 | $225B |
|
||
| Telecommunications | 2 | $144B |
|
||
| Pharmaceuticals | 2 | $112B |
|
||
| Media / Entertainment | 2 | $69B |
|
||
Price history
+131.9% since first listed4 events — show timeline
- 2026-06-18 Price Changed $122,900 CNYIS
- 2026-05-14 Price Changed $129,900 CNYIS
- 2026-04-23 Listed $139,900 CNYIS
- 2018-09-20 Sold (Public Records) $53,000 Public Records
Property tax history
+22.2%/yrLatest (2025): $1,650 · +2.0% YoY. Source: county tax records.
Cash-flow waterfall
monthlySold comps — $/sqft
last 12 mo · ≤1 miLoading sold comps…