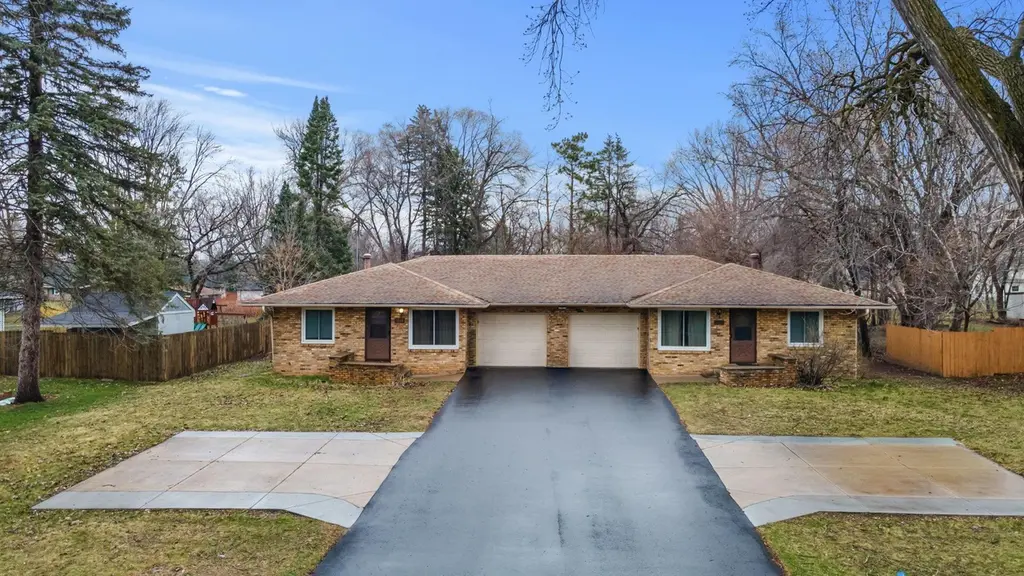
 Duplex
1967 County Road D W · Arden Hills, MN
Flood risk 1/10 · Minimal
- FEMA flood zone
- X (unshaded)
- Chance of flooding over 30 yrs
- 0.0%
- Est. flood insurance / yr
- $473 – $860
Fire risk 1/10 · Minimal
- Est. fire insurance / yr
- $888 – $1,650
Heat risk 2/10 · Minimal
- Hot days now (above 100°F)
- 7 days/yr
- Hot days in 30 yrs
- 14 days/yr
Wind risk 2/10 · Minimal
- Chance of severe wind over 30 yrs
- —
Air-quality risk 2/10 · Minimal
- Unhealthy air days now
- 1 days/yr
- Unhealthy air days in 30 yrs
- 1 days/yr
Risk factors via First Street. Map © Google.
Why this score? — see what drove the D- grade
The composite is a weighted blend of 9 inputs, each scored 0–100. Each bar is that input's sub-score; the figure is the points it added to the 100-point composite (weight × sub-score).
- Cash flow +9.5/30.0
- ARV discount +7.5/15.0
- Schools +5.4/10.0
- Livability +3.9/5.0
- Rent growth +3.5/5.0
- DSCR +2.7/10.0
- Condition / age +2.5/5.0
- 1% rule +2.4/10.0
- Appreciation +0.0/10.0
$499,900
🖨 Deal sheet 📄 Offer letter ✓ Due diligence
Multi-family units
County records classify this as Multi-Family (2-4 Unit). Listing-text estimate: 2 units. confirmed
Listing remarks
Well-maintained side-by-side brick duplex in Arden Hills offering flexibility for both owner-occupants and investors. One unit features 2 bedrooms and 1 bathroom and is currently owner-occupied, while the second unit offers 4 bedrooms and 2 bathrooms is tenant occupied. Charming throughout with pride of ownership evident on both sides. Spacious backyard, single-car garages, and additional off-street parking add to the appeal. Ideal setup to live in one unit and offset your mortgage or add a quality asset to your portfolio. Seller prefers a rent-back while securing their next home. Great opportunity in a desirable location. Hands down the best value in Arden Hills.
Key facts
- 0.41 acre lot
- 2 garage spots
- Built 1965
Neighborhood map
What this means for you Summary
Snapshot
- This is a 2 × 3-bed/1.5-bath units multifamily listed at $500k.
Deal economics
- At list price, monthly cash flow is $-346 ($-4k/yr) — negative. Per door: $-173/mo.
- To cash-flow at today's rent, offer at most $439k (12.2% below list).
- To meet the 1% rule (rent ≥ 1% of price), the offer needs to be $369k (26.1% below list).
- Recommended offer: $369k (26.1% below list) — sets the bar for 1% rule.
- Cap rate 5.5% vs local median 3.0% in Arden Hills — top-decile yield for the area; either an underpriced asset or a hidden risk that comps aren't pricing in. Stress-test before assuming the spread holds.
Location & tenants
- Location reads 78/100 on livability (#113 in MN, #2,556 nationally) — a middle-class / working-renter tenant base. Strengths: employment A+, housing A+, crime A; Watch: cost of living D, amenities F, health & safety F.
- Mounds View Public School District (suburban): math 58% / reading 64% proficiency, ranked #30 of 301 in MN (top 10%) — acceptable for families but not a draw, mixed tenant base, ~2y average lease.
- Market conditions: Rents rising fast (+4.1%/yr); 168 active listings in the ZIP; solid renter incomes; 1,202 units permitted in Ramsey County in 2024 (880 in 5+ unit buildings).
- At $3,694/mo this rent would consume 47% of the median local household income ($94k/yr) (locally 1134% of renters already pay >50% of income on rent) — very limited rent-growth headroom before tenants either downsize or default.
Forward outlook
- Local home prices are declining (-3.0%/yr); year-one equity from $3k of loan paydown is wiped out by about $15k of value loss. Plan a longer hold.
- Ramsey County population projected at +27% by 2050 — long-run rental-demand tailwind backs the buy-and-hold thesis.
Negotiation context
- Only 11 days on market — expect competitive offers; lowballing is unlikely to land.
- 4 sale attempts since 24y ago with the ask held roughly flat each time — persistent listings suggest the price (not the market) is what's stuck; bring a comps-based counter.
- Current owner paid $374k; 34% above their basis — modest negotiation headroom, anchor on the comps not their cost.
Questions for the listing agent
- What do current leases actually rent for vs. the listed asking? Can we see a recent rent roll and the last 12 months of T-12 income?
- Can we see the unit-by-unit rent roll, current vacancy, and any below-market leases? What's the average tenancy length?
- What capital expenditures (roof, boiler, parking lot, exteriors) have been made in the last 5 years, and what's planned in the next 2?
- Built in 1965 — when were the roof, HVAC, electrical panel, plumbing, and water heater last replaced?
- Is there a deadline driving the sale (1031 exchange, divorce, estate, relocation)? That informs how much negotiation room exists.
- Schools are A-rated — typically a magnet for longer-tenancy family renters. What's the average tenant stay here, and is there a school-zone premium baked into asking?
- The area grade is low — what's the realistic commute time and amenity access for the typical tenant pool here? Any planned neighborhood developments (good or bad) we should know about?
- What's the average days-on-market for RENTAL listings here right now (not sales)? A rising rental-DOM trend means longer vacancies and softer asking-rent achievability than the comps imply.
- What's the recent tenant-quality profile in this submarket — average credit score on applications, eviction rate, late-payment / NSF rate, and stable-employment percentage? A property-management company in the area should have these aggregated.
- How much new apartment / multifamily construction is in the pipeline within 1–3 miles? Heavy new supply (>2% of stock underway) typically softens rents 12–24 months out; light construction supports rent growth.
Investment metrics
- 1% rule
- 0.74% ✗
- Cap rate
- 5.46%
- Cash-on-cash
- -2.96%
- DSCR
- 0.87
- GRM
- 11.3
CMA / ARV
No comps found within radius.
Projected returns pro-forma
-3.0% appreciation · 4.07% rent growth · sell at horizon
- IRR
- -20.1%
- Equity multiple
- 0.29×
- Total profit
- $-99,067
- Equity at exit
- $74,537
- IRR
- -11.2%
- Equity multiple
- 0.30×
- Total profit
- $-98,014
- Equity at exit
- $43,222
Cash invested: $139,972 (down + closing). Projections, not guarantees.
Landlord ↔ Tenant lean methodology
- Overall (STATE)
- 46 Balanced
- State Minnesota
- 46 Balanced · D+2
- County
- — inherits STATE
- City
- — inherits STATE
ZIP-level market 55112
- Rents YoY
- 4.1%
- Active inventory
- 168
- Price-to-rent
- 22.6×
Monthly cashflow live
- Estimated rent
- $3,694 high interval (Pro) →
- Mortgage (P&I)
- −$2,622
- Tax from tax record
- −$434 /mo · $5,210/yr
- Insurance
- −$208
- HOA
- −$0
- Vacancy / Maint / Mgmt
- −$776
- Net cashflow
- $-346
Break-even live
2-unit breakdown (identical units grouped — click to expand)
| Units | Beds | Baths | Est. rent |
|---|---|---|---|
| 2× units | 3 | 1.5 | $3,694 |
| #1 | 3 | 1.5 | $1,847 |
| #2 | 3 | 1.5 | $1,847 |
| Total (2 units) | $3,694 | ||
UW: 25.0% down · 7.5% · 30yr · 1.5% tax · 5.0% vac · 8.0% maint · 8.0% mgmt
Financing live
Cash to close
- Down payment
- $124,975
- Closing costs
- $14,997
- Reserves months
- —
- Total cash needed
- —
Loan-product check · same deal, 3 products live
Conventional
25% down · 7.5% · 30yr
- Down + closing
- —
- Monthly P&I
- —
- Monthly cashflow
- —
- DSCR
- —
- Eligible?
- —
Personal DTI + credit; lowest rate.
DSCR
20% down · 8.5% · 30yr
- Down + closing
- —
- Monthly P&I
- —
- Monthly cashflow
- —
- DSCR
- —
- Eligible?
- —
No personal income docs; deal must DSCR.
Hard money
10% down · 12.0% · 12mo
- Down + closing
- —
- Monthly P&I
- —
- Monthly cashflow
- —
- DSCR
- —
- Eligible?
- —
Short-term bridge; refi at stabilization.
Listing history 15 events
-
2026-04-28status Pending
-
2026-04-21historical Contingent - Inspection
-
2026-04-17$499,900 Active
-
2026-04-15historical $499,900
-
2018-08-24soldstatus $374,000
-
2018-07-31soldstatus $374,000 Sold
-
2018-07-03$365,000
-
2018-07-03historical
-
2018-06-07historical
-
2018-05-21price $399,900
-
2018-05-17$425,000 Active
-
2003-04-03soldstatus $247,500
-
2002-10-23soldstatus $247,500
-
2002-09-21historical
-
2002-09-17$239,900
ⓘ Source: listings_history table (triggers on properties + properties_extension) + one-shot
backfill from property_details.listing_events for pre-trigger history.
Tax reassessment forecast MN · Partial reset (capped growth)
- Current annual tax
- $5,210 · $434/mo
- Projected year-2 tax
- $5,404 · $450/mo
- Expected delta
- +$194/yr (+$16/mo · 3.7%)
ⓘ Screening estimate from a state-policy table — verify with the county assessor before closing.
Climate risk First Street
- Flood 1/10 Low FEMA zone X (unshaded) · 0% chance over 30 yrs
- Wildfire 1/10 Low
- Heat 2/10 Low 7 d/yr ≥100°F today · 14 d/yr by 30 yrs out
- Wind 2/10 Low
- Air quality 2/10 Low 1 unhealthy d/yr today · 1 by 30 yrs out
Nearby sold comps map
Loading sold comps map…
Walkable amenities ~0.75 mi
Loading nearby amenities…
Taxation est. · year 1
- Rental income
- $44,328
- − Mortgage interest
- −$28,002
- − Property taxes
- −$5,210
- − Insurance
- −$2,500
- − Repairs & maintenance
- −$3,546
- − Management
- −$3,546
- − Depreciation
- −$14,543
- Taxable loss
- −$13,019
- Est. tax savings @ 24.0%
- +$3,124
- After-tax cash flow
- $-1,024/yr
For passive investors: Depreciation is non-cash, so a rental often shows a tax loss while cash-flowing — sheltering income. Rental losses are passive: they offset passive income freely, and up to $25,000/yr can offset ordinary (W-2) income if you actively participate and your MAGI is under $100k (phasing out to $0 by $150k); unused losses carry forward. On sale, claimed depreciation is recaptured at up to 25%, and gains may owe capital-gains tax (a 1031 exchange can defer both). Figures are a year-1 estimate at your 24.0% rate — not tax advice; consult a CPA.
Schools (NCES district)
- District
- Mounds View Public School District
- NCES district ID
- 2722950
- Math proficiency
- 58% ▼ -9.00%
- Reading proficiency
- 64% ▼ -3.00%
- Median HH income
- $72,492
- Composite
- 54.04/100
- National rank
- #1390
- State rank
- #30 of 301 in MN
Livability — Arden Hills
- Score
- 78/100
- State rank
- #113
- US rank
- #2556
Category grades
Schools grade is shown separately in the Schools card above.
Census & demographics
- Census place
- Arden Hills, MN
- County
- Ramsey County · 542,837 people
- Metro
- Minneapolis-St. Paul-Bloomington, MN-WI
- Population (ZIP)
- 45,346
- Household income
- $93,838
- Rent vs Own
- Severe rent burden
- 1134.0
Population outlook (Ramsey County) Hauer SSP2
- Today (2025)
- 603,431 people
- By 2030
- 636,459 · +5.5%
- By 2040
- 700,596 · +16.1%
- By 2050
- 765,819 · +26.9%
- By 2075
- 929,297 · +54.0%
- By 2100
- 1,053,924 · +74.7%
Race, ethnicity, and origin ACS 2023
- Neighborhood character
- Predominantly White (70%)
- Race & ethnicity
- White 70% Black 9% Hispanic / Latino 9% Two or more races 8% Asian 7%
- Hispanic origin (detail)
- Mexican 5%
- Common ancestry
- Portuguese 12% Romanian 5% Scottish 3%
- Foreign-born
- 12% · Canada, China, Vietnam
- Languages at home
- 84% English-only · Spanish 6% Other Asian/Pacific 3% Other Indo-European 1%
Political lean MEDSL · Ramsey
- 2024 margin
- Solid D (+43.3) · D 70.5% · R 27.2% · Other 2.3%
- 2008→2024 swing
- +9.4pp toward D · 2008: 33.9pp · 2024: 43.3pp
- All cycles
- 2024: D+43.3 2020: D+45.4 2016: D+39.4 2012: D+35.3 2008: D+33.9
Not yet ingested
- Civics
- —
Market trends
- HPI YoY
- ▼ -312.77%
- Current HPI
- 254.5083
- Rent YoY
- ▲ 4.07%
- Metro
- Minneapolis-St. Paul-Bloomington, MN-WI
- State GDP YoY
- ▲ 2.41%
- F500 in state
- 34
Industry mix (Fortune 500 HQ in MN)
| Industry | F500 HQs | Revenue |
|---|---|---|
| Healthcare | 2 | $407B |
|
||
| Retail | 2 | $150B |
|
||
| Consumer Goods | 2 | $32B |
|
||
| Industrial Machinery | 2 | $6B |
|
||
| Agriculture | 1 | $40B |
|
||
| Healthcare / Medical Devices | 1 | $32B |
|
||
Price history
+108.4% since first listed15 events — show timeline
- 2026-04-28 Pending — NORTHSTARMLS as Distributed by MLS Grid
- 2026-04-21 Contingent — NORTHSTARMLS as Distributed by MLS Grid
- 2026-04-17 Listed $499,900 NORTHSTARMLS as Distributed by MLS Grid
- 2026-04-15 Coming Soon $499,900 NORTHSTARMLS as Distributed by MLS Grid
- 2018-08-24 Sold (Public Records) $374,000 Public Records
- 2018-07-31 Sold (MLS) $374,000 NORTHSTARMLS as Distributed by MLS Grid
- 2018-07-03 Listing Removed — NORTHSTARMLS as Distributed by MLS Grid
- 2018-07-03 Listed $365,000 NORTHSTARMLS as Distributed by MLS Grid
- 2018-06-07 Listing Removed — NORTHSTARMLS as Distributed by MLS Grid
- 2018-05-21 Price Changed $399,900 NORTHSTARMLS as Distributed by MLS Grid
- 2018-05-17 Listed $425,000 NORTHSTARMLS as Distributed by MLS Grid
- 2003-04-03 Sold (Public Records) $247,500 Public Records
- 2002-10-23 Sold (MLS) $247,500 NORTHSTARMLS as Distributed by MLS Grid
- 2002-09-21 Listing Removed — NORTHSTARMLS as Distributed by MLS Grid
- 2002-09-17 Listed $239,900 NORTHSTARMLS as Distributed by MLS Grid
Property tax history
+3.9%/yrLatest (2025): $5,210 · +13.6% YoY. Source: county tax records.
Cash-flow waterfall
monthlySold comps — $/sqft
last 12 mo · ≤1 miLoading sold comps…