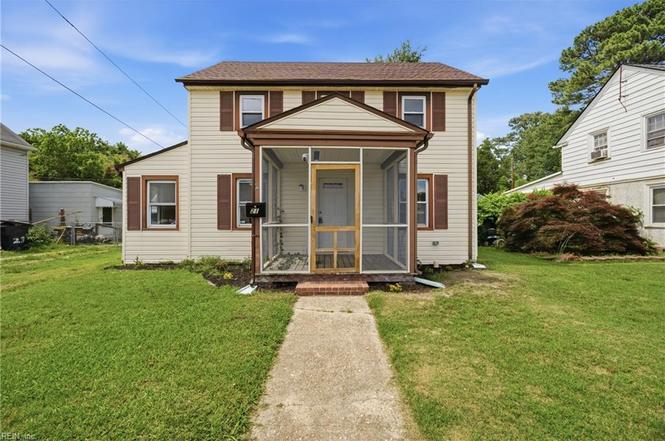
21 Aylwin Rd · Portsmouth, VA
Flood risk 3/10 · Minor
- FEMA flood zone
- X (unshaded)
- Chance of flooding over 30 yrs
- 0.12%
- Est. flood insurance / yr
- $507 – $1,088
Fire risk 1/10 · Minimal
- Est. fire insurance / yr
- $666 – $1,236
Heat risk 9/10 · Severe
- Hot days now (above 106°F)
- 7 days/yr
- Hot days in 30 yrs
- 15 days/yr
Wind risk 8/10 · Major
- Chance of severe wind over 30 yrs
- 80.0%
Air-quality risk 5/10 · Moderate
- Unhealthy air days now
- 6 days/yr
- Unhealthy air days in 30 yrs
- 7 days/yr
Risk factors via First Street. Map © Google.
Why this score? — see what drove the D grade
The composite is a weighted blend of 9 inputs, each scored 0–100. Each bar is that input's sub-score; the figure is the points it added to the 100-point composite (weight × sub-score).
- Appreciation +10.0/10.0
- Cash flow +8.1/30.0
- ARV discount +7.2/15.0
- Schools +3.9/10.0
- Livability +3.7/5.0
- Rent growth +3.5/5.0
- Condition / age +2.5/5.0
- DSCR +2.1/10.0
- 1% rule +1.7/10.0
$237,000
🖨 Deal sheet 📄 Offer letter ✓ Due diligence
Listing remarks
This newly renovated home has been refreshed from top to bottom and is ready for its new owners! Recent upgrades include brand-new LVP flooring throughout the downstairs, new carpet upstairs, a beautifully updated bathroom, and a fully renovated kitchen featuring new cabinets, countertops, tile backsplash, and stainless steel appliances. Major system updates provide peace of mind with a new roof, updated electrical throughout with a new 200 Amp Service installed, new water heater, and a new zoned ductless HVAC system throughout the home for efficient year-round comfort. Situated on a spacious lot with a storage shed, this home is tucked away in the charming historic neighborhood of Cradock
Key facts
- New cabinets
- New lvp flooring
- New countertops
Tags
Property features AI
Finance
- HOA & community: No HOA fees
Exterior
- Parking: Driveway parking spaces
- Utilities: City/County water; City/County sewer; Electric water heater; Electric power
- Home design: Detached single-family home; Cape Cod style; 2 stories; Crawl foundation; Simple ownership
- Construction: Vinyl exterior; Crawl foundation; Asphalt shingle roof
- Exterior features: Vinyl siding; Back yard fenced; Chain link and wood fencing; Storage shed; Asphalt shingle roof
Interior
- Kitchen: Dishwasher; Electric range; Refrigerator
- Bedrooms: Master bedroom; Additional bedroom; No bedroom with full bathroom on first floor
- Flooring: Carpet; Ceramic; Laminate
- Bathrooms: 1 full bathroom
- Heating & cooling: Two-zone cooling; Electric heating; Two-zone heating
- Interior features: Screened porch; Utility room; Wooded view
- Laundry & utility: Washer hookup; Dryer hookup; Utility room
Neighborhood map
What this means for you Summary
Snapshot
- This is a 2-bed/1.0-bath single-family listed at $237k.
Deal economics
- At list price, monthly cash flow is $-232 ($-3k/yr) — negative.
- To cash-flow at today's rent, offer at most $196k (17.3% below list).
- To meet the 1% rule (rent ≥ 1% of price), the offer needs to be $160k (32.7% below list).
- Recommended offer: $160k (32.7% below list) — sets the bar for 1% rule.
Location & tenants
- Location reads 73/100 on livability (#172 in VA) — a middle-class / working-renter tenant base. Strengths: amenities A+, cost of living A+, housing A+; Watch: employment C-, crime F, commute F.
- Portsmouth City Public School District (urban): math 34% / reading 58% proficiency, ranked #107 of 131 in VA (top 82%) — families likely to look elsewhere, expect single-tenant / working-renter base with shorter leases.
- Market conditions: Rents rising (+4.0%/yr); 64 active listings in the ZIP; 34 comparable units currently listed for rent nearby; rentals at typical pace (median 24d on market — plan ~3-4 weeks tenant-placement turnaround); 300 units permitted in Portsmouth city in 2024 (112 in 5+ unit buildings).
- This rent runs 39% of the median local income ($49k/yr) — at the standard rent-burdened threshold; future hikes will face affordability resistance.
Forward outlook
- In year one you build about $25k of equity ($2k loan paydown + $24k appreciation (10.0% local appreciation)).
- By year 2, paydown + projected appreciation supports a ~$41k cash-out refi (75% LTV) — recoverable capital for the next deal without selling this one.
Negotiation context
- Only 7 days on market — expect competitive offers; lowballing is unlikely to land.
- Current owner paid $135k; list at $237k implies a 76% gain — meaningful room to come down on a strong offer.
Risks & watch-outs
- Watch-outs: built in 1918 — expect roof / HVAC / electrical / plumbing capex.
- Climate carrying-cost: severe wind risk, 80% chance of damaging wind over 30y; extreme-heat days projected 7→15/yr by 2055 (HVAC capex compounding) — expect insurance premiums to compound above CPI over the hold.
Questions for the listing agent
- What do current leases actually rent for vs. the listed asking? Can we see a recent rent roll and the last 12 months of T-12 income?
- Built in 1918 — when were the roof, HVAC, electrical panel, plumbing, and water heater last replaced?
- Is there a deadline driving the sale (1031 exchange, divorce, estate, relocation)? That informs how much negotiation room exists.
- Schools are B-rated — typically a magnet for longer-tenancy family renters. What's the average tenant stay here, and is there a school-zone premium baked into asking?
- Crime grade is F in this area — have there been break-ins, vandalism, or insurance claims at this property in the last 3 years? What carrier currently insures it and at what premium?
- The area grade is low — what's the realistic commute time and amenity access for the typical tenant pool here? Any planned neighborhood developments (good or bad) we should know about?
- What's the average days-on-market for RENTAL listings here right now (not sales)? A rising rental-DOM trend means longer vacancies and softer asking-rent achievability than the comps imply.
- What's the recent tenant-quality profile in this submarket — average credit score on applications, eviction rate, late-payment / NSF rate, and stable-employment percentage? A property-management company in the area should have these aggregated.
- How much new for-sale + rental construction is in the pipeline within 1–3 miles? Heavy new supply typically softens prices + rents 12–24 months out; constrained supply supports both.
Investment metrics
- 1% rule
- 0.67% ✗
- Cap rate
- 5.12%
- Cash-on-cash
- -4.19%
- DSCR
- 0.81
- GRM
- 12.4
CMA / ARV
- ARV (on-the-fly)
- $235,416
- Comps found
- 12
Show comp detail 12 sales within ~0.75 mi
| Address | Dist | Beds/Ba | Sqft | Sold | Price | $/sf | Match |
|---|---|---|---|---|---|---|---|
| 3 Prospect Pkwy | 0.15mi | 3/2.0 (+1) | 1,216 (+5%) | 2mo | $126,000 | $104 | 73 |
| 59 Bainbridge Ave | 0.25mi | 3/1.0 (+1) | 1,214 (+5%) | 3mo | $120,000 | $99 | 72 |
| 4320 Deep Creek Blvd | 0.61mi | 3/1.0 (+1) | 1,150 (-0%) | 1mo | $234,900 | $204 | 65 |
| 9 Quackenbush Pl | 0.34mi | 3/2.0 (+1) | 1,250 (+8%) | 0mo | $260,000 | $208 | 61 |
| 12 Oakcrest St | 0.59mi | 3/1.0 (+1) | 1,115 (-3%) | 3mo | $120,000 | $108 | 59 |
| 132 Cushing St | 0.46mi | 2/1.0 | 1,016 (-12%) | 3mo | $215,000 | $212 | 56 |
| 206 Kelly Dr | 0.35mi | 2/2.0 | 1,000 (-13%) | 2mo | $125,000 | $125 | 56 |
| 100 Dahlgren Ave Unit B | 0.62mi | 3/1.0 (+1) | 1,078 (-7%) | 1mo | $194,700 | $181 | 55 |
| 4109 Deep Creek Blvd | 0.54mi | 2/1.0 | 1,000 (-13%) | 3mo | $220,000 | $220 | 50 |
| 132 Afton Pkwy | 0.58mi | 3/2.0 (+1) | 1,056 (-8%) | 3mo | $244,900 | $232 | 47 |
| 117 Edison Ave | 0.67mi | 2/1.0 | 1,000 (-13%) | 2mo | $227,500 | $228 | 45 |
| 14 Fairview Cir S | 0.72mi | 3/1.0 (+1) | 1,300 (+13%) | 2mo | $192,000 | $148 | 39 |
Match score weights: distance 35% · size 25% · config 20% · recency 20%. Top-matched comps best support the ARV.
Projected returns pro-forma
10.0% appreciation · 3.97% rent growth · sell at horizon
- IRR
- 21.5%
- Equity multiple
- 2.75×
- Total profit
- $115,822
- Equity at exit
- $213,508
- IRR
- 19.6%
- Equity multiple
- 6.36×
- Total profit
- $355,875
- Equity at exit
- $460,439
Cash invested: $66,360 (down + closing). Projections, not guarantees.
Landlord ↔ Tenant lean methodology
- Overall (STATE)
- 55 Moderately Landlord-Leaning
- State Virginia
- 55 Moderately Landlord-Leaning · D+2
- County
- — inherits STATE
- City
- — inherits STATE
ZIP-level market 23702
- Home prices YoY
- 5.2%
- Rents YoY
- 4.0%
- Active inventory
- 64
- Price-to-rent
- 12.4×
Monthly cashflow live
- Estimated rent
- $1,596 high interval (Pro) →
- Mortgage (P&I)
- −$1,243
- Tax from tax record
- −$151 /mo · $1,807/yr
- Insurance
- −$99
- HOA
- −$0
- Vacancy / Maint / Mgmt
- −$335
- Net cashflow
- $-232
Break-even live
UW: 25.0% down · 7.5% · 30yr · 1.5% tax · 5.0% vac · 8.0% maint · 8.0% mgmt
Financing live
Cash to close
- Down payment
- $59,250
- Closing costs
- $7,110
- Reserves months
- —
- Total cash needed
- —
Loan-product check · same deal, 3 products live
Conventional
25% down · 7.5% · 30yr
- Down + closing
- —
- Monthly P&I
- —
- Monthly cashflow
- —
- DSCR
- —
- Eligible?
- —
Personal DTI + credit; lowest rate.
DSCR
20% down · 8.5% · 30yr
- Down + closing
- —
- Monthly P&I
- —
- Monthly cashflow
- —
- DSCR
- —
- Eligible?
- —
No personal income docs; deal must DSCR.
Hard money
10% down · 12.0% · 12mo
- Down + closing
- —
- Monthly P&I
- —
- Monthly cashflow
- —
- DSCR
- —
- Eligible?
- —
Short-term bridge; refi at stabilization.
Rent comps 34 comps
| Address | Beds | Baths | Sqft | Rent | $/sqft | DOM | Units | Dist |
|---|---|---|---|---|---|---|---|---|
| 104 Cushing St Unit 104 Portsmouth, VA | 1.0 | 1.0 | 700 | $1,095 | $1.56 | 20d | 1 | 0.37mi |
| 104 Cushing St Portsmouth, VA | 1.0 | 1.0 | 700 | $1,200 | $1.71 | 20d | 1 | 0.37mi |
| 18 Cooper Dr Portsmouth, VA | 2.0 | 1.0 | 920 | $1,400 | $1.52 | 17d | 1 | 0.50mi |
| 231 Edison Ave Portsmouth, VA | 2.0 | 1.5 | 1100 | $1,275 | $1.16 | 20d | 1 | 0.62mi |
| 231 Edison Ave Unit 231 Portsmouth, VA | 2.0 | 1.5 | 1050 | $1,275 | $1.21 | 10d | 1 | 0.62mi |
| 3724 Deep Creek Blvd Unit 3754 Portsmouth, VA | 2.0 | 1.0 | 900 | $995 | $1.11 | 12d | 1 | 0.64mi |
| 3724 Deep Creek Blvd Unit 3728 Portsmouth, VA | 2.0 | 1.0 | 900 | $995 | $1.11 | 24d | 1 | 0.64mi |
| 134 Monmouth St Portsmouth, VA | 3.0 | 2.5 | 1440 | $2,450 | $1.70 | 44d | 1 | 0.65mi |
| 21 DeKalb Ave Portsmouth, VA | 2.0 | 1.0 | 984 | $1,550 | $1.58 | 44d | 1 | 0.71mi |
| 2750 Greenwood Dr Portsmouth, VA | 3.0 | 2.0 | 1200 | $1,700 | $1.42 | 24d | 1 | 0.87mi |
| 213 Beacon Rd Portsmouth, VA | 3.0 | 2.0 | 1280 | $2,300 | $1.80 | 24d | 1 | 0.89mi |
| 1314 Summit Ave Portsmouth, VA | 3.0 | 1.5 | 1152 | $1,750 | $1.52 | 44d | 1 | 0.92mi |
| 2810 Roanoke Ave Portsmouth, VA | 3.0 | 1.5 | 1100 | $2,100 | $1.91 | 44d | 1 | 0.94mi |
| 251 Independence St Portsmouth, VA | 3.0 | 2.5 | 1294 | $2,550 | $1.97 | 24d | 1 | 0.96mi |
| 2906 Chestnut St Unit 1328007P Portsmouth, VA | 2.0 | 1.0 | 947 | $4,650 | $4.91 | 7d | 1 | 1.03mi |
| 70 Manly St Portsmouth, VA | 2.0 | 1.0 | 1000 | $1,350 | $1.35 | 44d | 1 | 1.03mi |
| 2756 Peach St Portsmouth, VA | 2.0 | 1.5 | 1040 | $1,495 | $1.44 | 24d | 1 | 1.04mi |
| 2715 Portsmouth Blvd Portsmouth, VA | 2.0 | 1.0 | 1428 | $1,425 | $1.00 | 15d | 1 | 1.09mi |
| 2715 Portsmouth Blvd Portsmouth, VA | 2.0 | 1.0 | 1428 | $1,425 | $1.00 | 17d | 1 | 1.09mi |
| 2304 Nashville Ave Portsmouth, VA | 3.0 | 1.5 | 1226 | $1,395 | $1.14 | 44d | 1 | 1.13mi |
| 3317 Downes St Portsmouth, VA | 3.0 | 2.0 | 1148 | $1,995 | $1.74 | 10d | 1 | 1.18mi |
| 3317 Downes St Portsmouth, VA | 3.0 | 2.0 | 1148 | $1,995 | $1.74 | 3d | 1 | 1.18mi |
| 2111 Atlanta Ave Portsmouth, VA | 3.0 | 2.0 | 1418 | $2,395 | $1.69 | 44d | 1 | 1.24mi |
| 818 Coolidge St Portsmouth, VA | 2.0 | 1.0 | 1230 | $2,100 | $1.71 | 44d | 1 | 1.25mi |
| 1915 Lansing Ave Portsmouth, VA | 3.0 | 1.0 | 1085 | $1,675 | $1.54 | 3d | 1 | 1.29mi |
| 1915 Des Moines Ave Portsmouth, VA | 3.0 | 1.0 | 1070 | $1,700 | $1.59 | 16d | 1 | 1.29mi |
| 1915 Des Moines Ave Portsmouth, VA | 3.0 | 1.0 | 1070 | $1,700 | $1.59 | 24d | 1 | 1.29mi |
| 102 Francis St #98 Portsmouth, VA | 2.0 | 1.5 | 1000 | $1,395 | $1.40 | 16d | 1 | 1.29mi |
| 98 Francis St Portsmouth, VA | 2.0 | 2.0 | 984 | $1,395 | $1.42 | 15d | 1 | 1.30mi |
| 3304 Killian Ave Portsmouth, VA | 3.0 | 1.0 | 800 | $2,000 | $2.50 | 24d | 1 | 1.32mi |
| 2007 Elm Ave Portsmouth, VA | 3.0 | 1.0 | 903 | $1,300 | $1.44 | 20d | 1 | 1.33mi |
| 1 Shelby St Portsmouth, VA | 2.0 | 1.0 | 700 | $1,250 | $1.79 | 24d | 1 | 1.38mi |
| 1802 Atlanta Ave Unit 2 Portsmouth, VA | 2.0 | 1.0 | 1200 | $1,500 | $1.25 | 24d | 1 | 1.41mi |
| 49 Carver Cir Portsmouth, VA | 2.0 | 2.0 | 800 | $1,450 | $1.81 | 24d | 1 | 1.44mi |
Listing history 6 events
-
2026-06-18days on market $237,000 Active 7 DOM
-
2026-06-17days on market $237,000 Active 6 DOM
-
2026-06-16days on market $237,000 Active 5 DOM
-
2026-06-15days on market $237,000 Active 4 DOM
-
2026-06-13remarks 699-char remark
-
2026-06-13$237,000 Active 2 DOM
ⓘ Source: listings_history table (triggers on properties + properties_extension) + one-shot
backfill from property_details.listing_events for pre-trigger history.
Tax reassessment forecast VA · Resets to sale price
- Current annual tax
- $1,807 · $151/mo
- Projected year-2 tax
- $1,943 · $162/mo
- Expected delta
- +$136/yr (+$11/mo · 7.5%)
ⓘ Screening estimate from a state-policy table — verify with the county assessor before closing.
Climate risk First Street
- Flood 3/10 Moderate FEMA zone X (unshaded) · 12% chance over 30 yrs
- Wildfire 1/10 Low
- Heat 9/10 Extreme 7 d/yr ≥106°F today · 15 d/yr by 30 yrs out
- Wind 8/10 Severe 80% chance of damaging wind over 30 yrs
- Air quality 5/10 Major 6 unhealthy d/yr today · 7 by 30 yrs out
Nearby sold comps map
Loading sold comps map…
Walkable amenities ~0.75 mi
Loading nearby amenities…
Taxation est. · year 1
- Rental income
- $19,146
- − Mortgage interest
- −$13,276
- − Property taxes
- −$1,807
- − Insurance
- −$1,185
- − Repairs & maintenance
- −$1,532
- − Management
- −$1,532
- − Depreciation
- −$6,895
- Taxable loss
- −$7,080
- Est. tax savings @ 24.0%
- +$1,699
- After-tax cash flow
- $-1,082/yr
For passive investors: Depreciation is non-cash, so a rental often shows a tax loss while cash-flowing — sheltering income. Rental losses are passive: they offset passive income freely, and up to $25,000/yr can offset ordinary (W-2) income if you actively participate and your MAGI is under $100k (phasing out to $0 by $150k); unused losses carry forward. On sale, claimed depreciation is recaptured at up to 25%, and gains may owe capital-gains tax (a 1031 exchange can defer both). Figures are a year-1 estimate at your 24.0% rate — not tax advice; consult a CPA.
Schools (NCES district)
- District
- Portsmouth City Public School District
- NCES district ID
- 5103000
- Math proficiency
- 34% ▼ -40.00%
- Reading proficiency
- 58% ▼ -12.00%
- Median HH income
- $46,152
- Composite
- 39.01/100
- National rank
- #4071
- State rank
- #107 of 131 in VA
Livability — Portsmouth
- Score
- 73/100
- State rank
- #172
- US rank
- #5381
Category grades
Schools grade is shown separately in the Schools card above.
Census & demographics
- Census place
- Portsmouth, VA
- County
- Portsmouth City · 96,366 people
- City population
- 96,366
- Metro
- Virginia Beach-Norfolk-Newport News, VA-NC
- Population (ZIP)
- 12,485
- Household income
- $48,835
- Rent vs Own
- Severe rent burden
- 534.0
Population outlook (Portsmouth County) Hauer SSP2
- Today (2025)
- 96,730 people
- By 2030
- 96,760 · +0.0%
- By 2040
- 96,573 · -0.2%
- By 2050
- 95,606 · -1.2%
- By 2075
- 93,579 · -3.3%
- By 2100
- 83,756 · -13.4%
Race, ethnicity, and origin ACS 2023
- Neighborhood character
- Diverse neighborhood (Simpson 0.62)
- Race & ethnicity
- Black 50% White 35% Two or more races 9% Hispanic / Latino 8%
- Hispanic origin (detail)
- Mexican 2% Puerto Rican 3%
- Common ancestry
- Lithuanian 1% Italian 1% Slovak 1%
- Foreign-born
- 4% · Canada, South Korea
- Languages at home
- 95% English-only · Spanish 4%
Political lean MEDSL · Portsmouth
- 2024 margin
- Solid D (+38.6) · D 68.6% · R 30.0% · Other 1.4%
- 2008→2024 swing
- -0.7pp no change · 2008: 39.3pp · 2024: 38.6pp
- All cycles
- 2024: D+38.6 2020: D+40.8 2016: D+36.5 2012: D+39.6 2008: D+39.3
Not yet ingested
- Civics
- —
Market trends
- HPI YoY
- ▲ 16.70%
- Current HPI
- 340.0817
- Rent YoY
- ▲ 3.97%
- Metro
- Virginia Beach-Norfolk-Newport News, VA-NC
- State GDP YoY
- ▲ 2.40%
- F500 in state
- 50
Industry mix (Fortune 500 HQ in VA)
| Industry | F500 HQs | Revenue |
|---|---|---|
| Aerospace / Defense | 4 | $236B |
|
||
| Technology / Defense | 3 | $32B |
|
||
| Financial Services | 2 | $176B |
|
||
| Utilities | 2 | $27B |
|
||
| Insurance | 2 | $25B |
|
||
| Technology | 2 | $15B |
|
||
Price history
+169.3% since first listed3 events — show timeline
- 2026-06-11 Listed $237,000 REINMLS
- 2007-07-17 Sold (Public Records) $135,000 Public Records
- 2004-08-27 Sold (Public Records) $88,000 Public Records
Property tax history
+1.1%/yrLatest (2025): $1,807 · +1.2% YoY. Source: county tax records.
Cash-flow waterfall
monthlySold comps — $/sqft
last 12 mo · ≤1 miLoading sold comps…