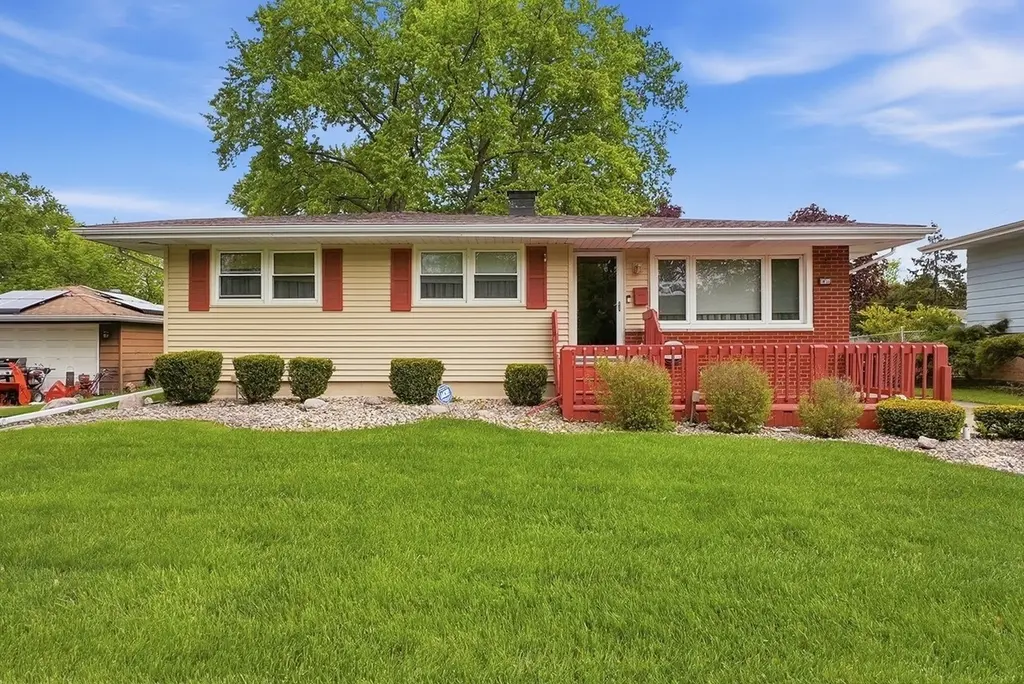
18833 Park Ave · Lansing, IL
Flood risk 3/10 · Minor
- FEMA flood zone
- X (unshaded)
- Chance of flooding over 30 yrs
- 0.13%
- Est. flood insurance / yr
- $473 – $860
Fire risk 3/10 · Minor
- Est. fire insurance / yr
- $804 – $1,492
Heat risk 3/10 · Minor
- Hot days now (above 102°F)
- 7 days/yr
- Hot days in 30 yrs
- 15 days/yr
Wind risk 2/10 · Minimal
- Chance of severe wind over 30 yrs
- 0.0%
Air-quality risk 4/10 · Minor
- Unhealthy air days now
- 5 days/yr
- Unhealthy air days in 30 yrs
- 6 days/yr
Risk factors via First Street. Map © Google.
Why this score? — see what drove the C grade
The composite is a weighted blend of 9 inputs, each scored 0–100. Each bar is that input's sub-score; the figure is the points it added to the 100-point composite (weight × sub-score).
- Cash flow +20.9/30.0
- ARV discount +13.7/15.0
- DSCR +6.6/10.0
- 1% rule +4.8/10.0
- Livability +3.7/5.0
- Rent growth +2.5/5.0
- Condition / age +2.5/5.0
- Schools +1.0/10.0
- Appreciation +0.0/10.0
$189,000
🖨 Deal sheet 📄 Offer letter ✓ Due diligence
Listing remarks
Charming home featuring 3 bedrooms and 1 full bath with a functional layout and plenty of space throughout. The main level offers a bright living room, a spacious kitchen with a dining area combo, ample cabinet space. The finished basement provides additional living or recreation space along with a dedicated laundry area. Outside, enjoy a large backyard with a wooden deck and built-in seating/swing area, perfect for relaxing or entertaining, plus a 2-car garage and driveway for added convenience. This home has solid space and character with an opportunity to add your own modern updates and personal touch. Estate sale being sold as is.
Key facts
- Dining area combo
- Spacious kitchen
- Large backyard
Tags
Property features AI
Finance
- Other: Rebuilt/rehab: No
- HOA & community: No master association fee required
Exterior
- Parking: Detached garage (owned) with approximately 2.5 garage spaces; Concrete parking surfaces
- Utilities: Lake Michigan water source; Public sewer
- Home design: Detached single-family raised ranch; Fee simple ownership; Estimated living area; Built before 1978 (original construction); Age approximately 61–70 years
- Construction: Vinyl siding and brick exterior
- Exterior features: Lot under 0.25 acre; Lot dimensions: 8127
Interior
- Kitchen: Range; Refrigerator; 17 x 11 kitchen
- Bedrooms: Main-level master bedroom (hardwood floors); Main-level bedroom (12 x 12, hardwood floors); Main-level bedroom (9 x 10, hardwood floors)
- Flooring: Hardwood flooring in main living areas and bedrooms
- Bathrooms: One full bathroom
- Heating & cooling: Natural gas forced-air heating; Central air conditioning
- Interior features: Finished full basement; Seven total rooms
- Laundry & utility: Basement laundry (24 x 13)
Neighborhood map
What this means for you Summary
Snapshot
- This is a 3-bed/1.0-bath single-family listed at $189k.
Deal economics
- At list price, monthly cash flow is $261 ($3k/yr) — positive.
- The deal already cash-flows at list — no discount required.
- To meet the 1% rule (rent ≥ 1% of price), the offer needs to be $186k (1.7% below list).
- Recommended offer: $183k (3.0% below list) — sets the bar for market timing.
- Cap rate 8.0% vs local median 5.8% in Lansing — top-decile yield for the area; either an underpriced asset or a hidden risk that comps aren't pricing in. Stress-test before assuming the spread holds.
Location & tenants
- Location reads 73/100 on livability (#296 in IL) — a middle-class / working-renter tenant base. Strengths: commute A+, cost of living A+, housing A+; Watch: schools D+, crime D+, health & safety D+.
- Thornton Fractional Twp Hsd 215 (suburban): math 9% / reading 13% proficiency, ranked #563 of 620 in IL (top 91%) — low school quality limits family demand, transient renter base, plan for 1-2y turnover.
- Market conditions: 132 active listings in the ZIP; 10 comparable units currently listed for rent nearby; rentals leasing fast (median 12d on market — plan ~1-2 weeks tenant-placement turnaround); solid renter incomes; 6,272 units permitted in Cook County in 2024 (4,658 in 5+ unit buildings).
Forward outlook
- Local home prices are declining (-3.0%/yr); year-one equity from $1k of loan paydown is wiped out by about $6k of value loss. Plan a longer hold.
Negotiation context
- It's been on market 42 days — a 3% lower offer ($183k) is reasonable based on typical stale-listing flexibility.
- Current owner paid $138k; 37% above their basis — modest negotiation headroom, anchor on the comps not their cost.
Questions for the listing agent
- It's been on market 42 days. Have you received any prior offers? Is the seller open to a 3% concession, seller financing, or rate buy-down credit?
- Built in 1963 — when were the roof, HVAC, electrical panel, plumbing, and water heater last replaced?
- Is there a deadline driving the sale (1031 exchange, divorce, estate, relocation)? That informs how much negotiation room exists.
- Schools are D-rated, which usually means shorter tenancies and higher turnover. Who's the typical renter profile here, and what's been the actual vacancy rate?
- Crime grade is D in this area — have there been break-ins, vandalism, or insurance claims at this property in the last 3 years? What carrier currently insures it and at what premium?
- What's the average days-on-market for RENTAL listings here right now (not sales)? A rising rental-DOM trend means longer vacancies and softer asking-rent achievability than the comps imply.
- What's the recent tenant-quality profile in this submarket — average credit score on applications, eviction rate, late-payment / NSF rate, and stable-employment percentage? A property-management company in the area should have these aggregated.
- How much new for-sale + rental construction is in the pipeline within 1–3 miles? Heavy new supply typically softens prices + rents 12–24 months out; constrained supply supports both.
Investment metrics
- 1% rule
- 0.98% ✗
- Cap rate
- 7.95%
- Cash-on-cash
- 5.93%
- DSCR
- 1.26
- GRM
- 8.5
CMA / ARV
- ARV (on-the-fly)
- $219,440
- Comps found
- 12
Show comp detail 12 sales within ~0.75 mi
| Address | Dist | Beds/Ba | Sqft | Sold | Price | $/sf | Match |
|---|---|---|---|---|---|---|---|
| 2916 189th St | 0.16mi | 3/2.0 | 1,092 (+4%) | 7mo | $220,000 | $201 | 77 |
| 18847 Greenbay Ave | 0.18mi | 3/1.0 | 960 (-9%) | 0mo | $225,000 | $234 | 76 |
| 18747 Sherman St | 0.55mi | 3/1.0 | 1,102 (+4%) | 2mo | $149,000 | $135 | 65 |
| 18429 Ridgewood Ave | 0.52mi | 3/2.0 | 1,080 (+2%) | 6mo | $185,000 | $171 | 63 |
| 19048 Sherman St | 0.55mi | 3/2.0 | 1,066 (+1%) | 7mo | $235,000 | $220 | 62 |
| 3252 191st St | 0.41mi | 3/2.0 | 1,104 (+5%) | 9mo | $230,000 | $208 | 61 |
| 18540 Miller Dr | 0.73mi | 3/1.0 | 1,040 (-1%) | 6mo | $243,000 | $234 | 58 |
| 3152 189th St | 0.20mi | 3/2.0 | 1,196 (+13%) | 8mo | $270,000 | $226 | 58 |
| 3320 191st St | 0.46mi | 3/2.0 | 1,150 (+9%) | 2mo | $207,000 | $180 | 58 |
| 19404 Wildwood Ave | 0.70mi | 3/2.0 | 1,074 (+2%) | 4mo | $255,000 | $237 | 57 |
| 2444 187th Pl | 0.70mi | 2/1.0 (-1) | 1,086 (+3%) | 4mo | $175,000 | $161 | 54 |
| 2843 193rd St | 0.59mi | 3/2.0 | 1,201 (+14%) | 3mo | $197,000 | $164 | 43 |
Match score weights: distance 35% · size 25% · config 20% · recency 20%. Top-matched comps best support the ARV.
Projected returns pro-forma
-3.0% appreciation · 3.0% rent growth · sell at horizon
- IRR
- -7.2%
- Equity multiple
- 0.74×
- Total profit
- $-14,016
- Equity at exit
- $28,181
- IRR
- 2.4%
- Equity multiple
- 1.17×
- Total profit
- $9,091
- Equity at exit
- $16,341
Cash invested: $52,920 (down + closing). Projections, not guarantees.
Landlord ↔ Tenant lean methodology
- Overall (STATE)
- 43 Moderately Tenant-Leaning
- State Illinois
- 43 Moderately Tenant-Leaning · D+7
- County
- — inherits STATE
- City
- — inherits STATE
ZIP-level market 60438
- Active inventory
- 132
- Price-to-rent
- 8.5×
Monthly cashflow live
- Estimated rent
- $1,858 high interval (Pro) →
- Mortgage (P&I)
- −$991
- Tax from tax record
- −$136 /mo · $1,636/yr
- Insurance
- −$79
- HOA
- −$0
- Vacancy / Maint / Mgmt
- −$390
- Net cashflow
- $261
Break-even live
UW: 25.0% down · 7.5% · 30yr · 1.5% tax · 5.0% vac · 8.0% maint · 8.0% mgmt
Financing live
Cash to close
- Down payment
- $47,250
- Closing costs
- $5,670
- Reserves months
- —
- Total cash needed
- —
Loan-product check · same deal, 3 products live
Conventional
25% down · 7.5% · 30yr
- Down + closing
- —
- Monthly P&I
- —
- Monthly cashflow
- —
- DSCR
- —
- Eligible?
- —
Personal DTI + credit; lowest rate.
DSCR
20% down · 8.5% · 30yr
- Down + closing
- —
- Monthly P&I
- —
- Monthly cashflow
- —
- DSCR
- —
- Eligible?
- —
No personal income docs; deal must DSCR.
Hard money
10% down · 12.0% · 12mo
- Down + closing
- —
- Monthly P&I
- —
- Monthly cashflow
- —
- DSCR
- —
- Eligible?
- —
Short-term bridge; refi at stabilization.
Rent comps 10 comps
| Address | Beds | Baths | Sqft | Rent | $/sqft | DOM | Units | Dist |
|---|---|---|---|---|---|---|---|---|
| 2824 186th St Lansing, IL | 3.0 | 2.0 | 1400 | $2,900 | $2.07 | 10d | 1 | 0.40mi |
| 3341 S Schultz Dr Lansing, IL | 4.0 | 2.0 | 1452 | $2,250 | $1.55 | 10d | 1 | 0.56mi |
| 18335 Sherman St Unit 3 Lansing, IL | 3.0 | 1.0 | 1000 | $1,700 | $1.70 | 1d | 1 | 0.78mi |
| 18550 Torrence Ave #25 Lansing, IL | 2.0 | 1.0 | 1000 | $1,300 | $1.30 | 12d | 1 | 0.91mi |
| 18361 Glen Oak Ave Unit 1E Lansing, IL | 2.0 | 1.0 | 900 | $1,400 | $1.56 | 25d | 1 | 0.94mi |
| 18440 Torrence Ave Lansing, IL | 2.0 | 1.0 | 800 | $1,200 | $1.50 | 25d | 1 | 0.96mi |
| 18381 Torrence Ave Lansing, IL | 2.0 | 1.0 | 900 | $1,300 | $1.44 | 25d | 1 | 0.98mi |
| 3020 178th St Unit C1 Lansing, IL | 2.0 | 1.0 | 900 | $1,550 | $1.72 | 1d | 1 | 1.34mi |
| 3020 178th St Apt C7 Lansing, IL | 2.0 | 1.0 | 900 | $1,550 | $1.72 | 25d | 1 | 1.34mi |
| 17723 Exchange Ave Unit 17723-1N Lansing, IL | 3.0 | 2.0 | 1100 | $1,800 | $1.64 | 1d | 1 | 1.45mi |
Listing history 17 events
-
2026-06-18days on market $189,000 Active 42 DOM
-
2026-06-17days on market $189,000 Active 41 DOM
-
2026-06-16days on market $189,000 Active 40 DOM
-
2026-06-16status $189,000 Active 39 DOM
-
2026-06-15days on market $189,000 Contingent - Continue to Show 39 DOM
-
2026-06-13statusdays on market $189,000 Contingent - Continue to Show 37 DOM
-
2026-06-09days on market $189,000 Active 33 DOM
-
2026-06-08days on market $189,000 Active 32 DOM
-
2026-06-07days on market $189,000 Active 31 DOM
-
2026-06-04days on market $189,000 Active 28 DOM
-
2026-06-03pricestatusdays on market $189,000 Active 27 DOM
-
2026-06-02days on market $199,000 Contingent - Continue to Show 26 DOM
-
2026-06-01days on market $199,000 Contingent - Continue to Show 25 DOM
-
2026-05-31days on market $199,000 Contingent - Continue to Show 24 DOM
-
2026-05-07$199,000 Active
-
2003-01-17soldstatus $138,000
-
1986-07-01soldstatus $74,000
ⓘ Source: listings_history table (triggers on properties + properties_extension) + one-shot
backfill from property_details.listing_events for pre-trigger history.
Tax reassessment forecast IL · Partial reset (capped growth)
- Current annual tax
- $1,636 · $136/mo
- Projected year-2 tax
- $2,963 · $247/mo
- Expected delta
- +$1,327/yr (+$111/mo · 81.1%)
ⓘ Screening estimate from a state-policy table — verify with the county assessor before closing.
Climate risk First Street
- Flood 3/10 Moderate FEMA zone X (unshaded) · 13% chance over 30 yrs
- Wildfire 3/10 Moderate
- Heat 3/10 Moderate 7 d/yr ≥102°F today · 15 d/yr by 30 yrs out
- Wind 2/10 Low 0% chance of damaging wind over 30 yrs
- Air quality 4/10 Moderate 5 unhealthy d/yr today · 6 by 30 yrs out
Nearby sold comps map
Loading sold comps map…
Walkable amenities ~0.75 mi
Loading nearby amenities…
Taxation est. · year 1
- Rental income
- $22,292
- − Mortgage interest
- −$10,587
- − Property taxes
- −$1,636
- − Insurance
- −$945
- − Repairs & maintenance
- −$1,783
- − Management
- −$1,783
- − Depreciation
- −$5,498
- Taxable income
- $59
- Est. tax owed @ 24.0%
- −$14
- After-tax cash flow
- $3,122/yr
For passive investors: Depreciation is non-cash, so a rental often shows a tax loss while cash-flowing — sheltering income. Rental losses are passive: they offset passive income freely, and up to $25,000/yr can offset ordinary (W-2) income if you actively participate and your MAGI is under $100k (phasing out to $0 by $150k); unused losses carry forward. On sale, claimed depreciation is recaptured at up to 25%, and gains may owe capital-gains tax (a 1031 exchange can defer both). Figures are a year-1 estimate at your 24.0% rate — not tax advice; consult a CPA.
Schools (NCES district)
- District
- Thornton Fractional Twp Hsd 215
- NCES district ID
- 1738940
- Math proficiency
- 9% ▼ -3.00%
- Reading proficiency
- 13% ▼ -3.00%
- Median HH income
- $48,207
- Composite
- 10.27/100
- National rank
- #9793
- State rank
- #563 of 620 in IL
Livability — Lansing
- Score
- 73/100
- State rank
- #296
- US rank
- #5698
Category grades
Schools grade is shown separately in the Schools card above.
Census & demographics
- Census place
- Lansing, IL
- County
- Cook County · 4,486,803 people
- City population
- 28,806
- Metro
- Chicago-Naperville-Elgin, IL-IN-WI
- Population (ZIP)
- 28,806
- Household income
- $75,681
- Rent vs Own
- Severe rent burden
- 830.0
Population outlook (Cook County) Hauer SSP2
- Today (2025)
- 5,347,519 people
- By 2030
- 5,357,703 · +0.2%
- By 2040
- 5,324,924 · -0.4%
- By 2050
- 5,230,762 · -2.2%
- By 2075
- 4,785,735 · -10.5%
- By 2100
- 4,188,836 · -21.7%
Race, ethnicity, and origin ACS 2023
- Neighborhood character
- Diverse neighborhood (Simpson 0.65)
- Race & ethnicity
- Black 51% White 25% Hispanic / Latino 18% Two or more races 7% Asian 2%
- Hispanic origin (detail)
- Mexican 15%
- Common ancestry
- Romanian 5% Iranian 3% Lithuanian 1%
- Foreign-born
- 10% · Canada
- Languages at home
- 83% English-only · Spanish 12% Vietnamese 1% French/Haitian/Cajun 1%
Political lean MEDSL · Cook
- 2024 margin
- Solid D (+42.0) · D 70.4% · R 28.4% · Other 1.2%
- 2008→2024 swing
- -11.4pp toward R · 2008: 53.4pp · 2024: 42.0pp
- All cycles
- 2024: D+42.0 2020: D+50.3 2016: D+53.0 2012: D+49.4 2008: D+53.4
Not yet ingested
- Civics
- —
Market trends
- HPI YoY
- ▼ -151.65%
- Current HPI
- 210.3398
- Rent YoY
- —
- Metro
- Chicago-Naperville-Elgin, IL-IN-WI
- State GDP YoY
- ▲ 1.59%
- F500 in state
- 60
Industry mix (Fortune 500 HQ in IL)
| Industry | F500 HQs | Revenue |
|---|---|---|
| Insurance | 4 | $201B |
|
||
| Consumer Goods | 4 | $87B |
|
||
| Industrial Machinery | 3 | $64B |
|
||
| Healthcare | 2 | $55B |
|
||
| Retail / Pharmacy | 1 | $148B |
|
||
| Agriculture / Food | 1 | $86B |
|
||
Price history
+168.9% since first listed3 events — show timeline
- 2026-05-07 Listed $199,000 MRED as Distributed by MLS Grid
- 2003-01-17 Sold (Public Records) $138,000 Public Records
- 1986-07-01 Sold (Public Records) $74,000 Public Records
Property tax history
-1.4%/yrLatest (2021): $1,636 · +14.7% YoY. Source: county tax records.
Cash-flow waterfall
monthlySold comps — $/sqft
last 12 mo · ≤1 miLoading sold comps…